Get a Quick View of Traffic Engineering Services
The TE Dashboard provides a high-level summary of RSVP-TE tunnel, SR-MPLS, SRv6, and Tree SID policy information.
To get to the TE Dashboard, choose Traffic Engineering > TE Dashboard.
| Callout No. | Description | ||
|---|---|---|---|
|
1 |
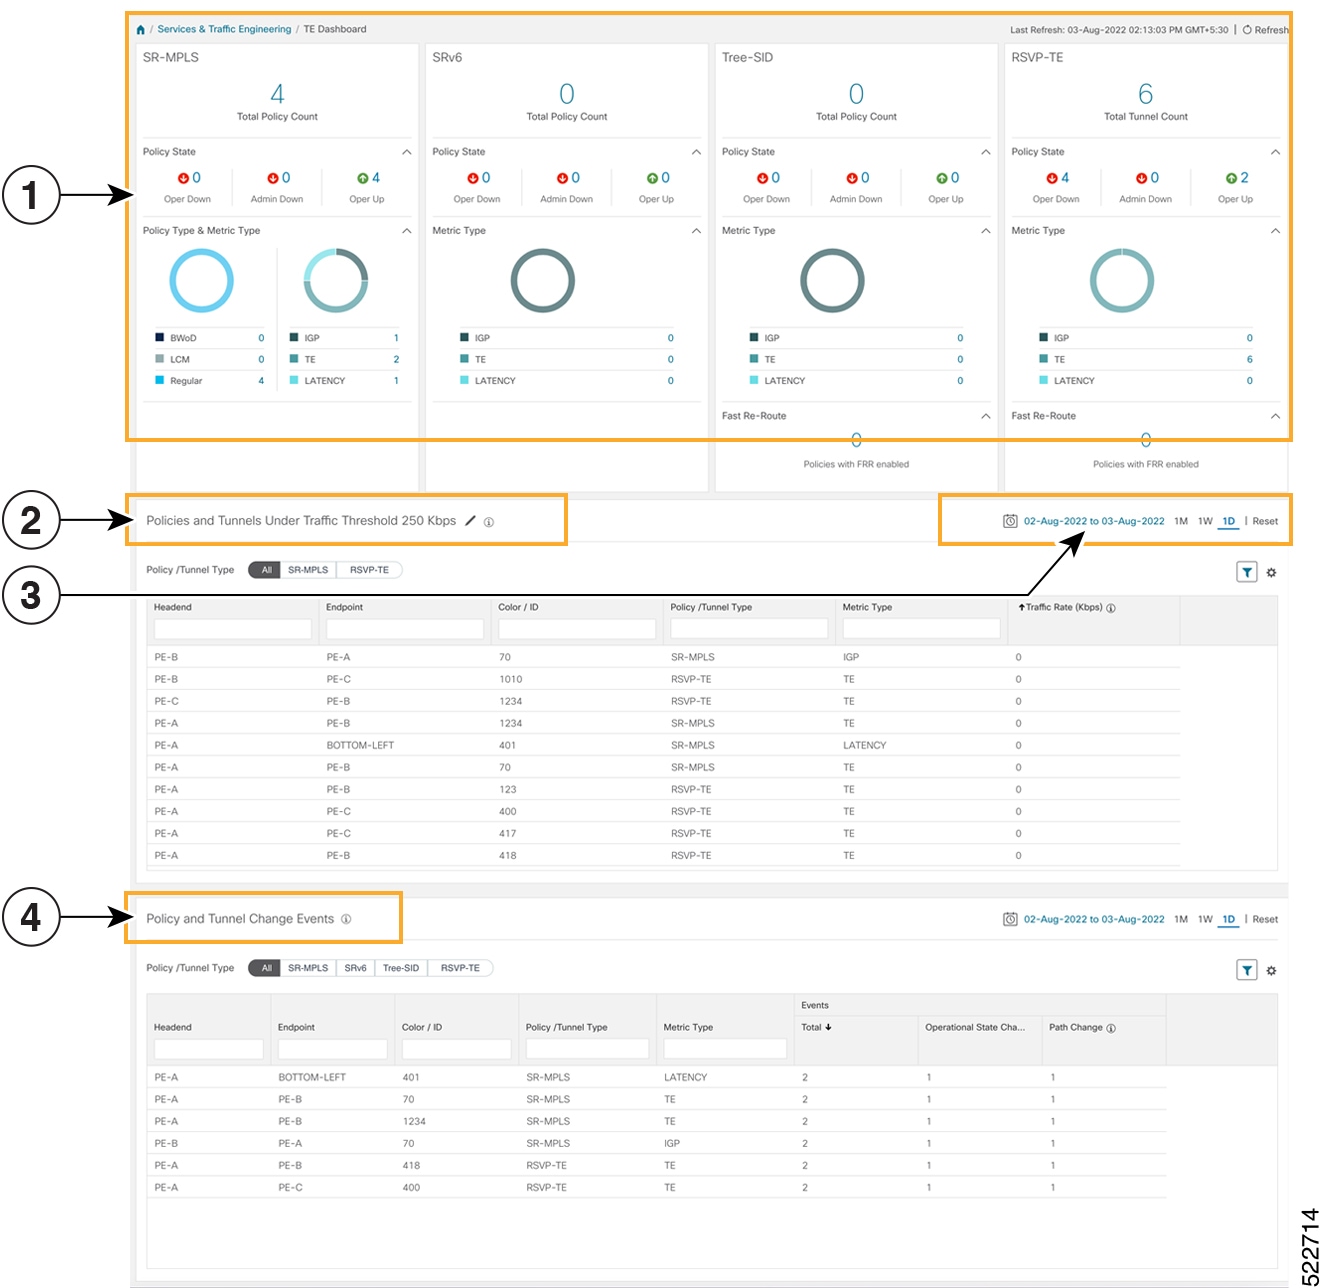
Traffic Engineering Dashlet: Displays the total policy count and count of policies according to the policy state. It also displays the number of SR-MPLS, BWoD and LCM policies and the number of policies/tunnel according to the metric types for all TE services. To drill down for more information, click on a value. The topology map and TE table appear displaying only the filtered data that you clicked on. |
||
|
2 |
Policies and Tunnels Under Traffic Threshold for Historic Data: Displays RSVP-TE tunnels and SR-MPLS policies that have traffic below the defined threshold in the selected time period.
This information may be used to find and filter the unsed policies or tunnels. Click
|
||
|
3 |
Allows you to filter the data on the dashlet based on the time range you want to view (date, 1 month, 1 week, and 1 day). |
||
|
4 |
Policy and Tunnel Change Events: Displays all the policies and tunnels that have had a path or state change event ordered by the event count, within the selected time range. This information helps identify the unstable policies and tunnels.
|
 Note |
For a list of known limitations, see the Cisco Crosswork Optimization Engine Release Notes. |
 Feedback