Analyze Service Health

This section explains how service health monitoring helps in analyzing the health of a service using the metrics displayed in the UI. It guides you on investigating degraded services and subservices to identify the root cause of service degradation.

View Monitored Services

You can view the monitored services in any of the following ways:

From the Crosswork Home Page

Figure 1. VPN Service Health Dashlet

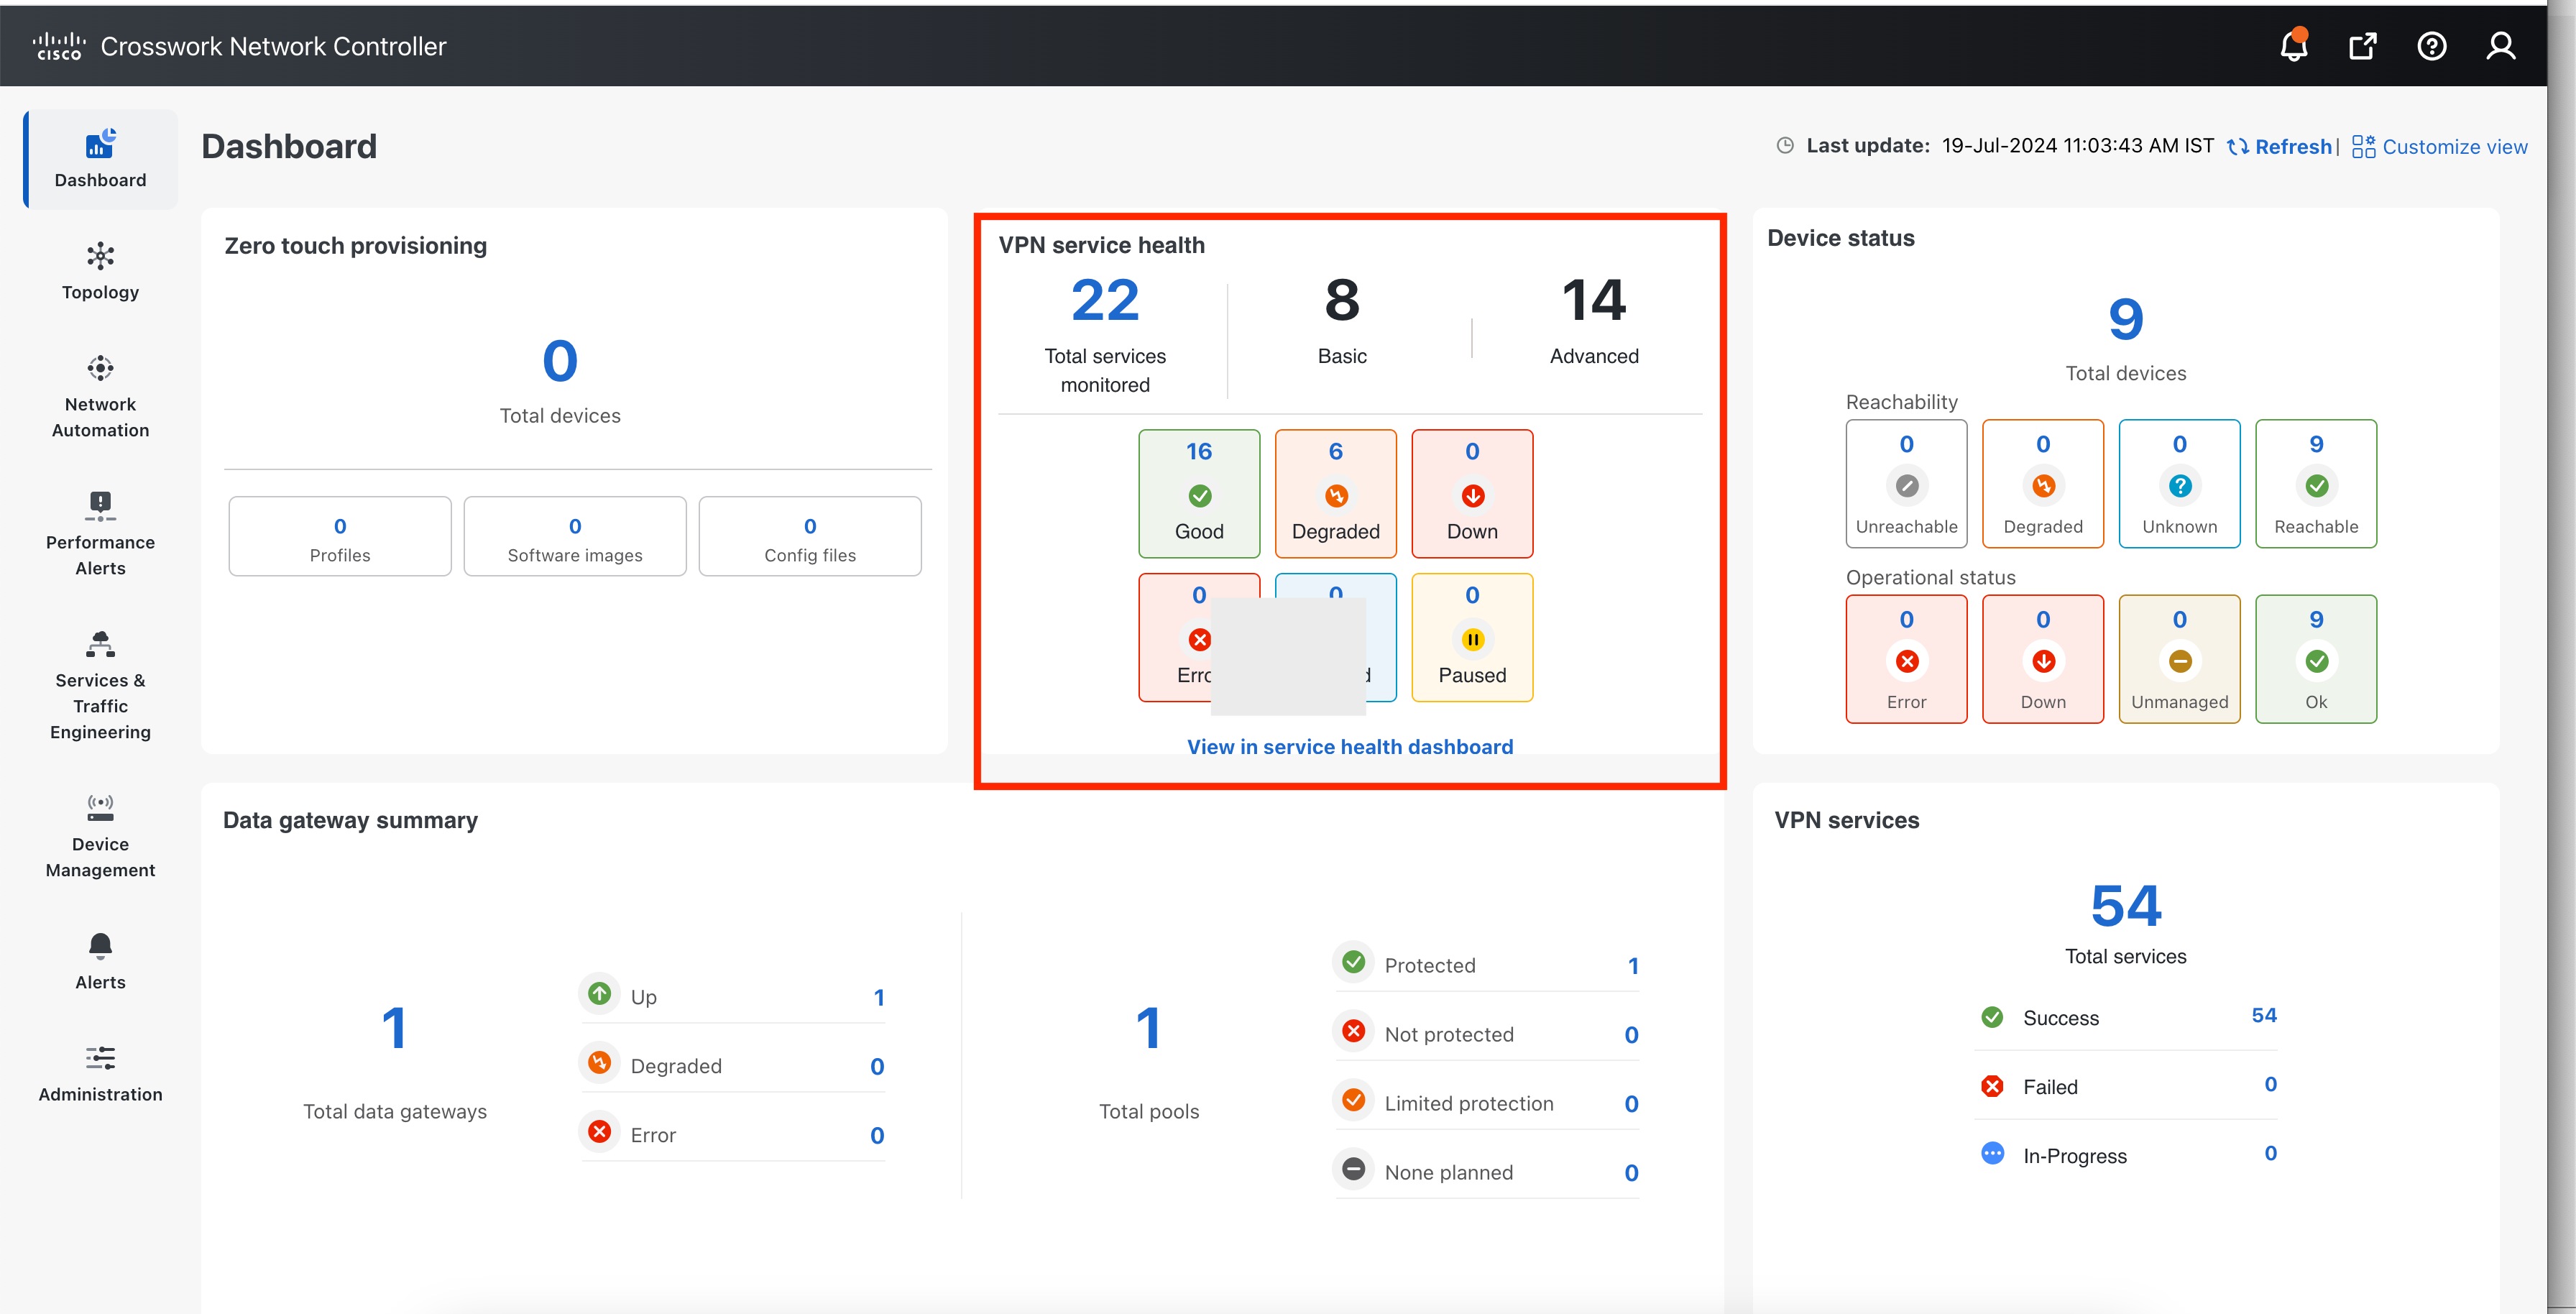
You will see the VPN Service Health dashlet on the Crosswork Home Page. This dashlet provides an overview of all the VPN services that are being monitored. From the dashlet you can click any of the status indicators to be taken to the VPN Services page with a filter set for the status you selected. To view the degraded services, click the Degraded box within the dashlet. This will take you to the VPN Services page, where only the degraded VPN services are displayed.

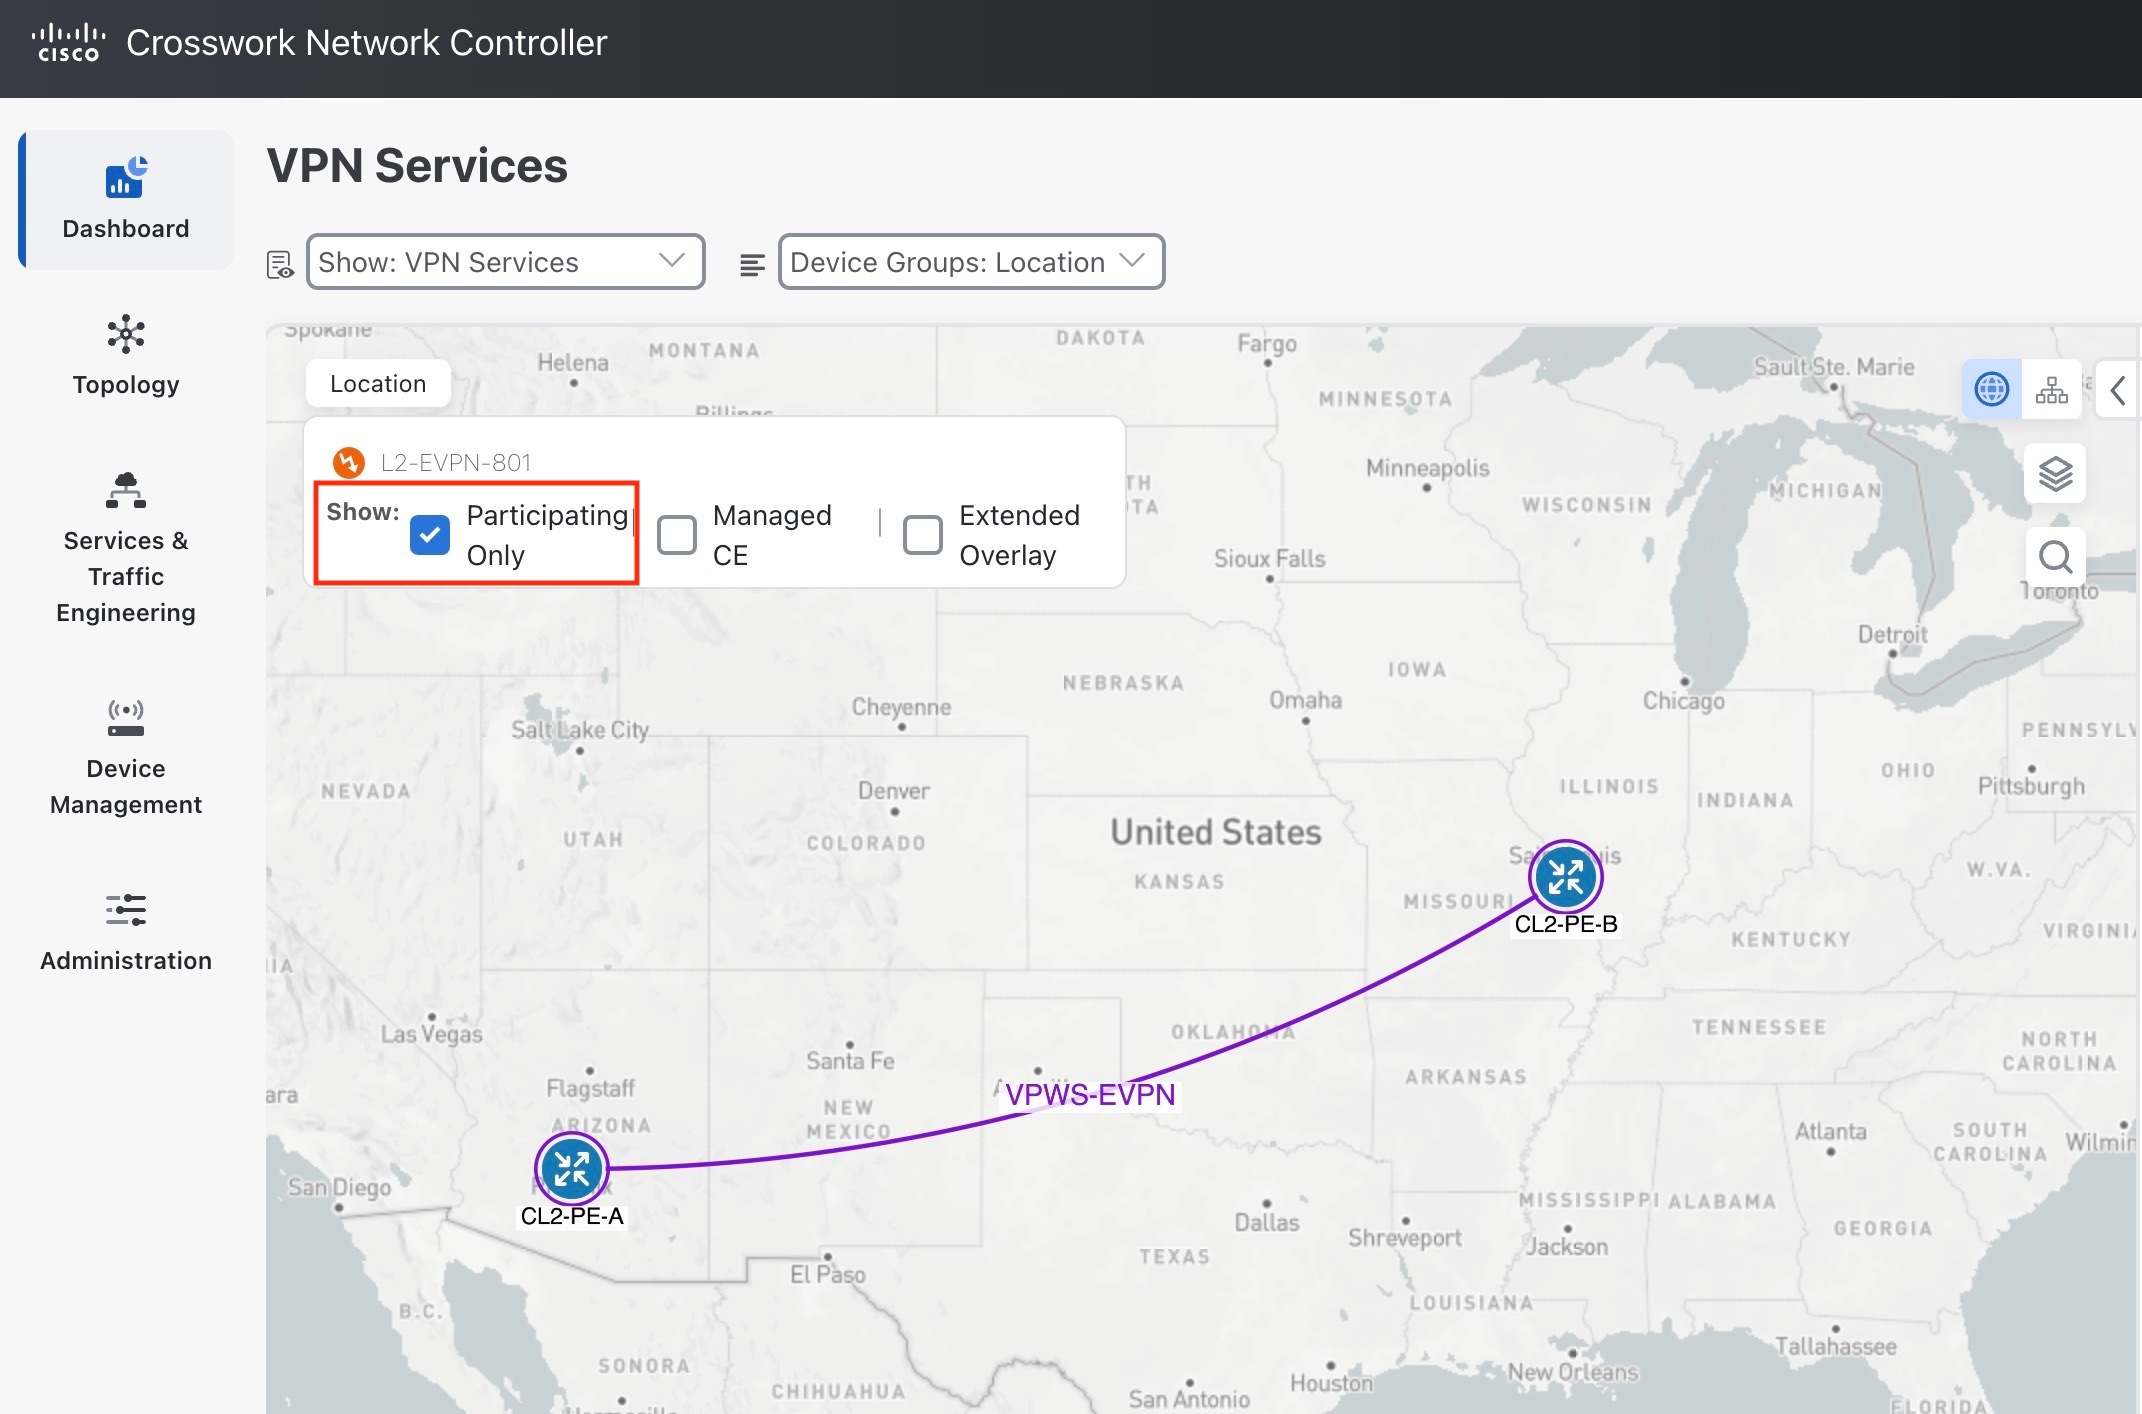
From the VPN Services Page

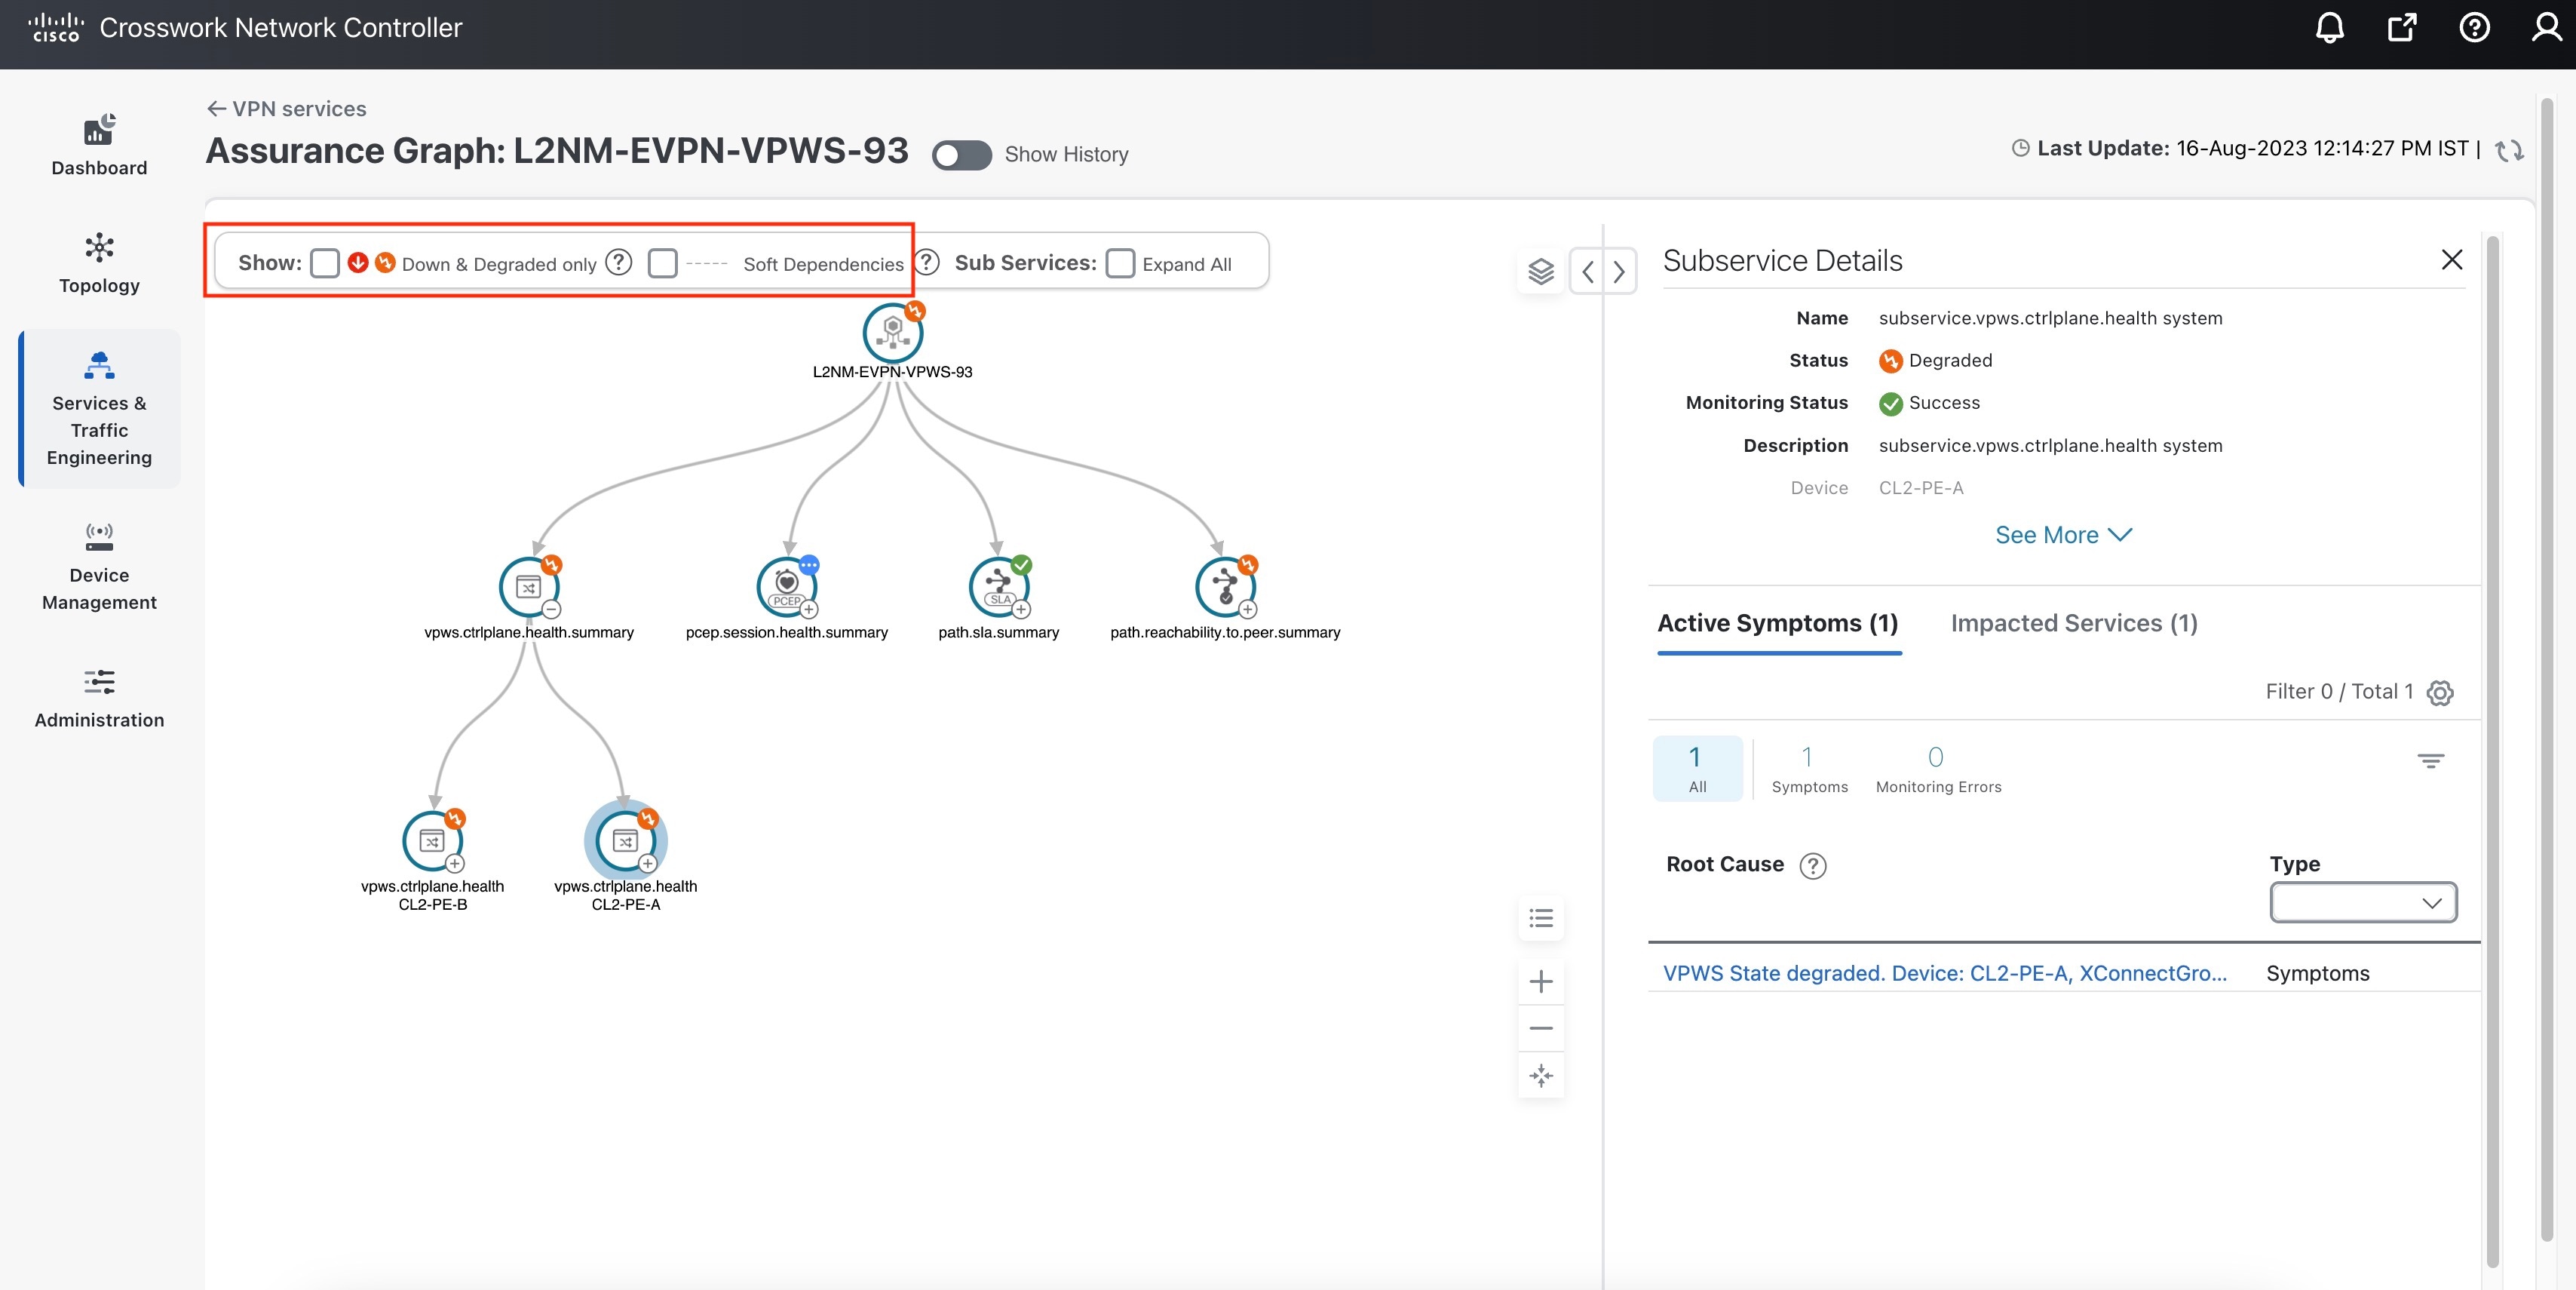
From the main menu, choose Services & Traffic Engineering > VPN Services. All the VPN services are listed on this page. The degraded services show an orange icon in the Health column.

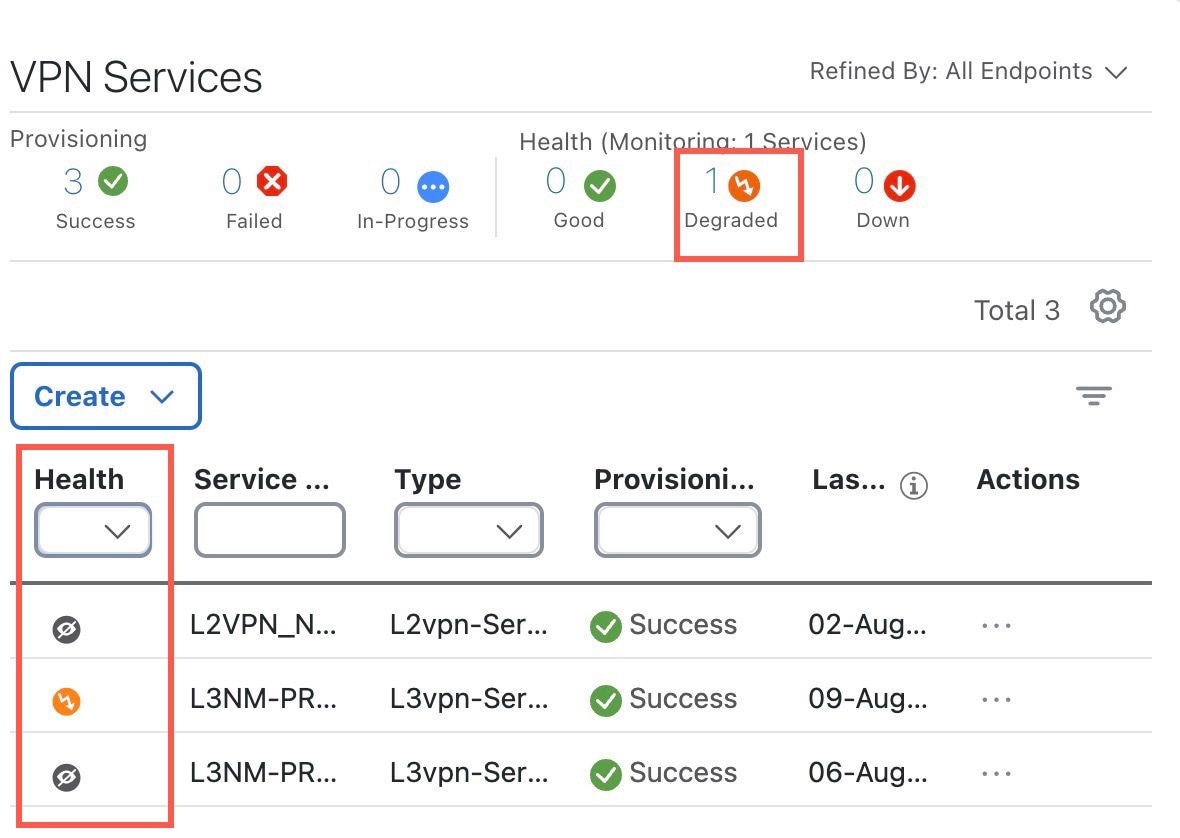
You can filter the services by their health (Down, Degraded, Good, Paused, Initiated, Error, Unmonitored). You can also click the Degraded tab in the Health tab in this page to filter and view only the Degraded services.

To clear the filter, click X next to the designated filter appearing in the space at the top of the column. To remove all the filters and to show all the VPN services, click the X icon in the Filters field above the table.


Note


If a service is not yet being monitored, a gray icon is displayed in the Health column. To enable monitoring for such a service, click and select Start Monitoring. For more information, see Start Service Health Monitoring.


Use the Service Health Monitoring Dashboard

To access the dashboard, click View in service health dashboard in the VPN Service Health dashlet on the Crosswork Home Page. The Service Health Dashboard displays consolidated view of L2VPN and L3VPN services including the total number of provisioned Services and number of monitored services. The dashboard also displays active monitoring sessions for L2VPN and L3VPN services, and indicates any SLA breaches for measured metrics such as latency, jitter, and packet loss in both directions.

Figure 2. Service Health Dashboard

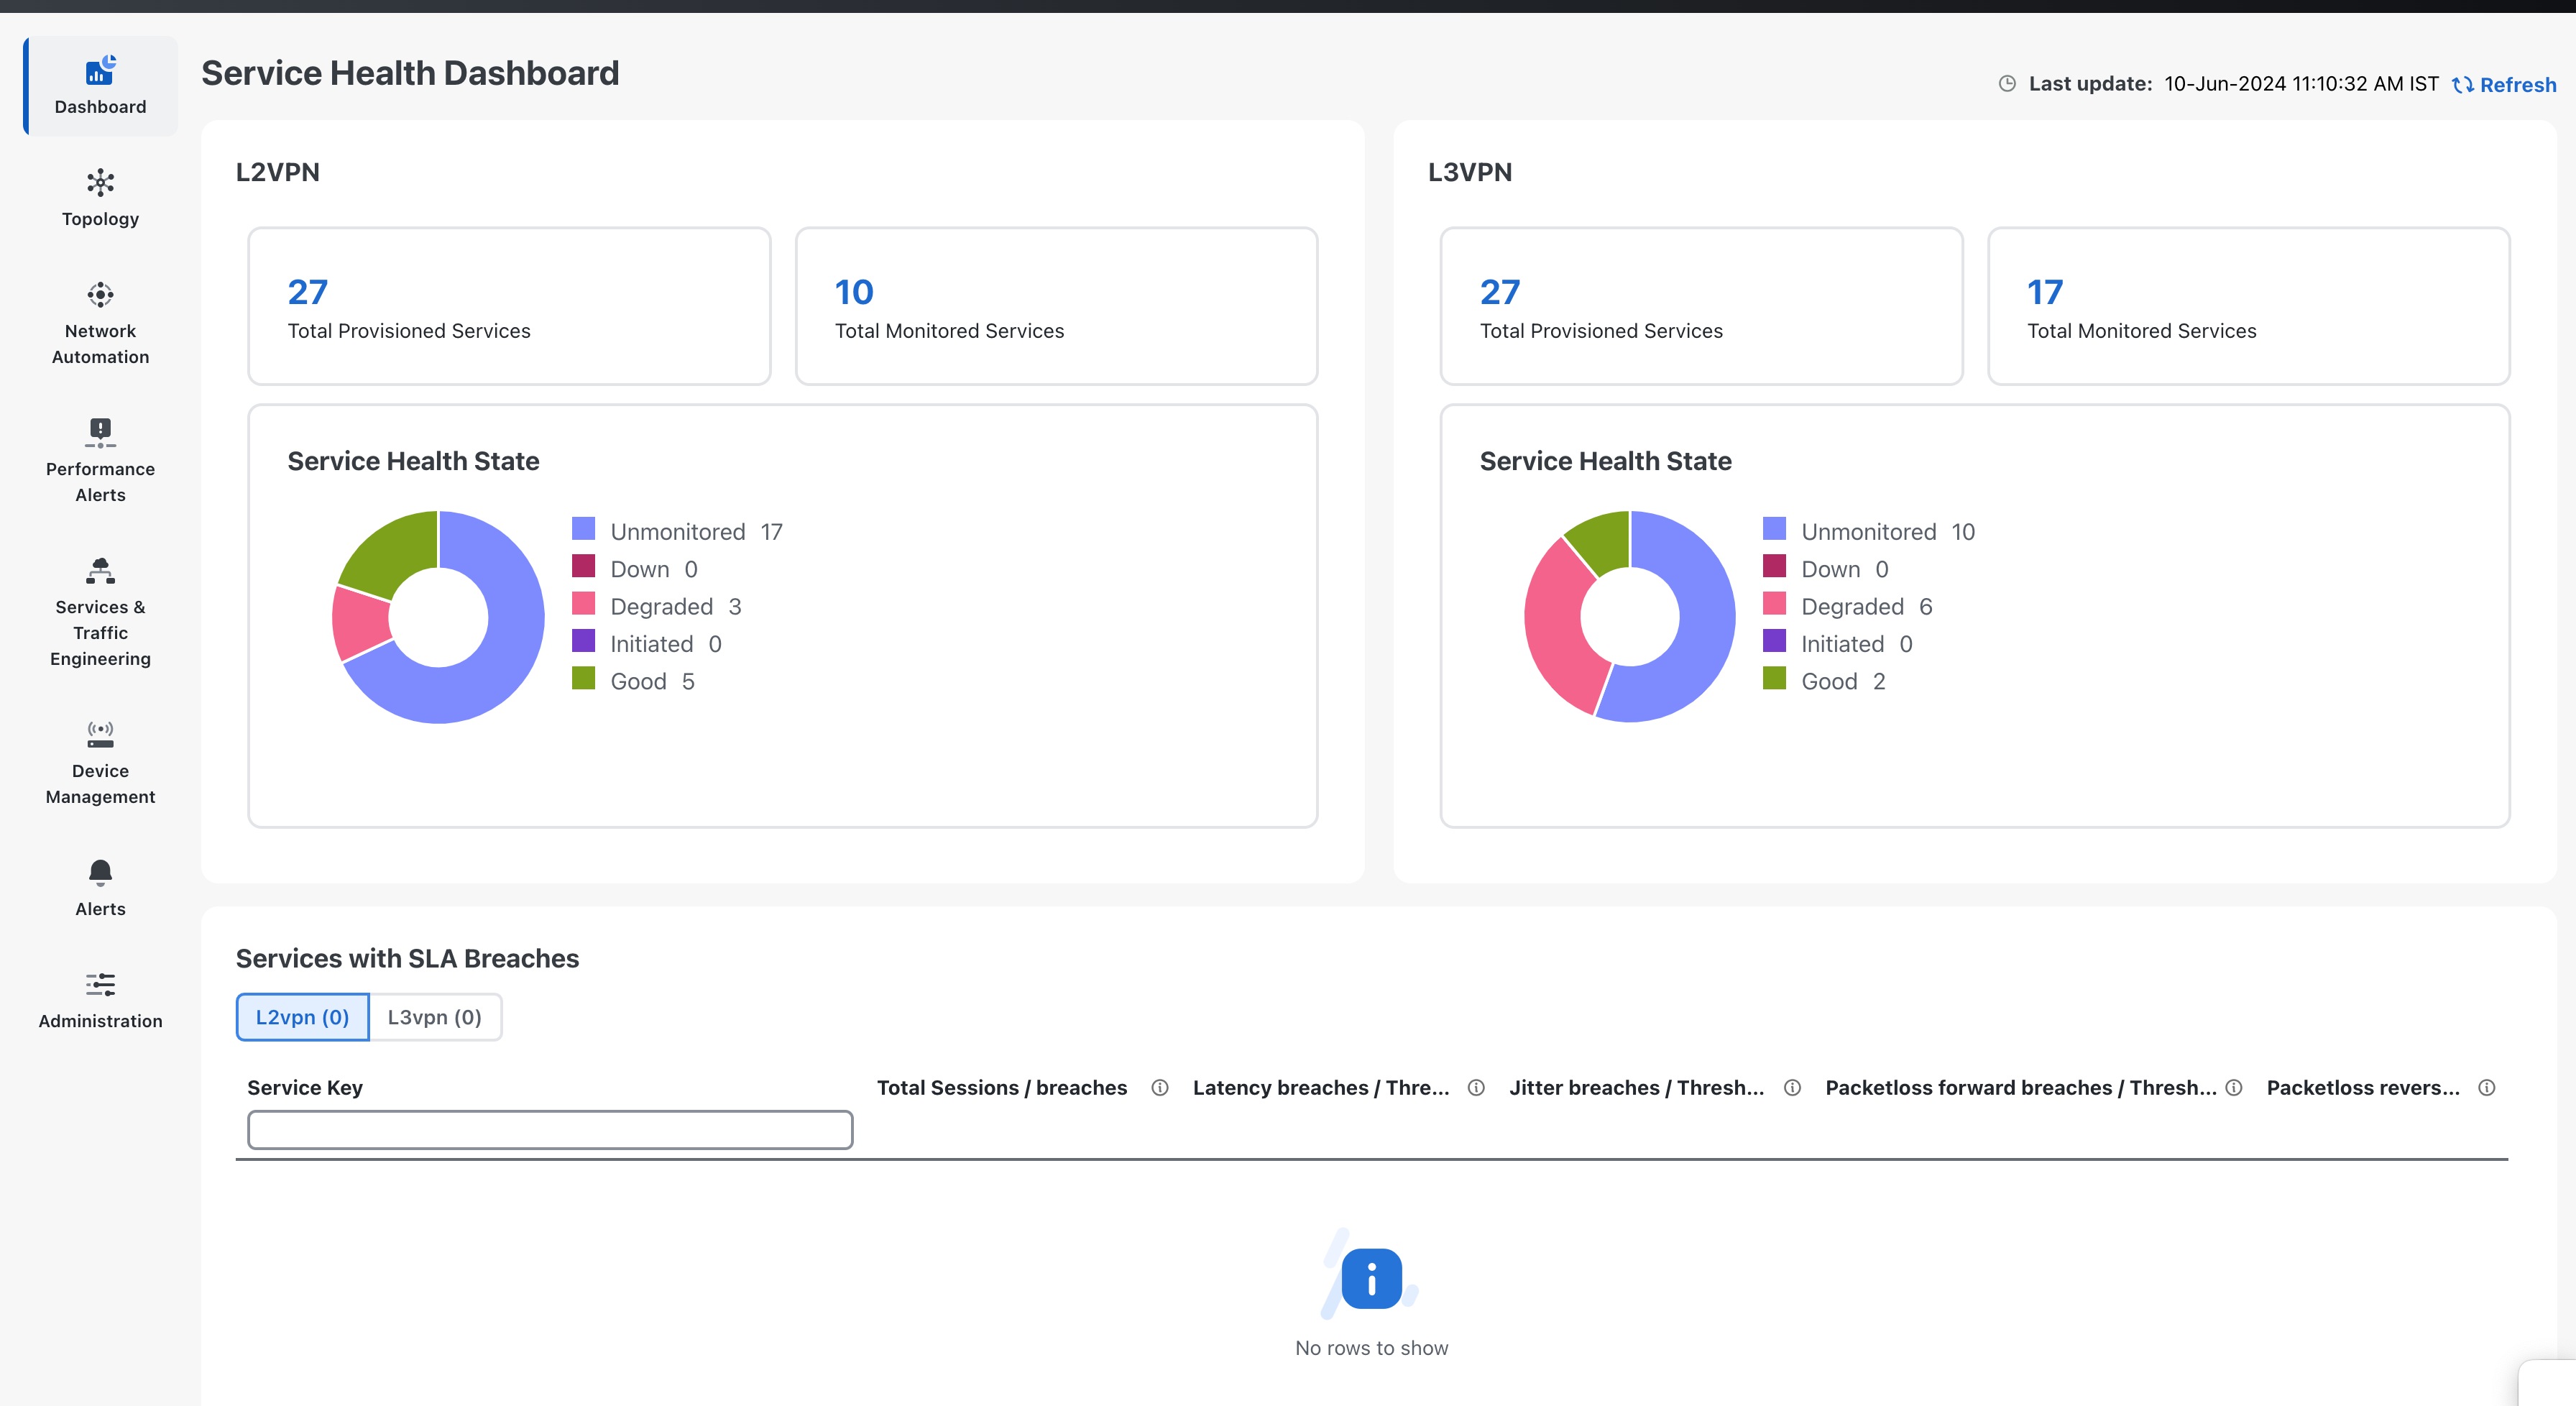
Clicking on any of the status indicators redirects you to the VPN Services page with a filter set for the status you selected.

View Monitoring Status of a Service

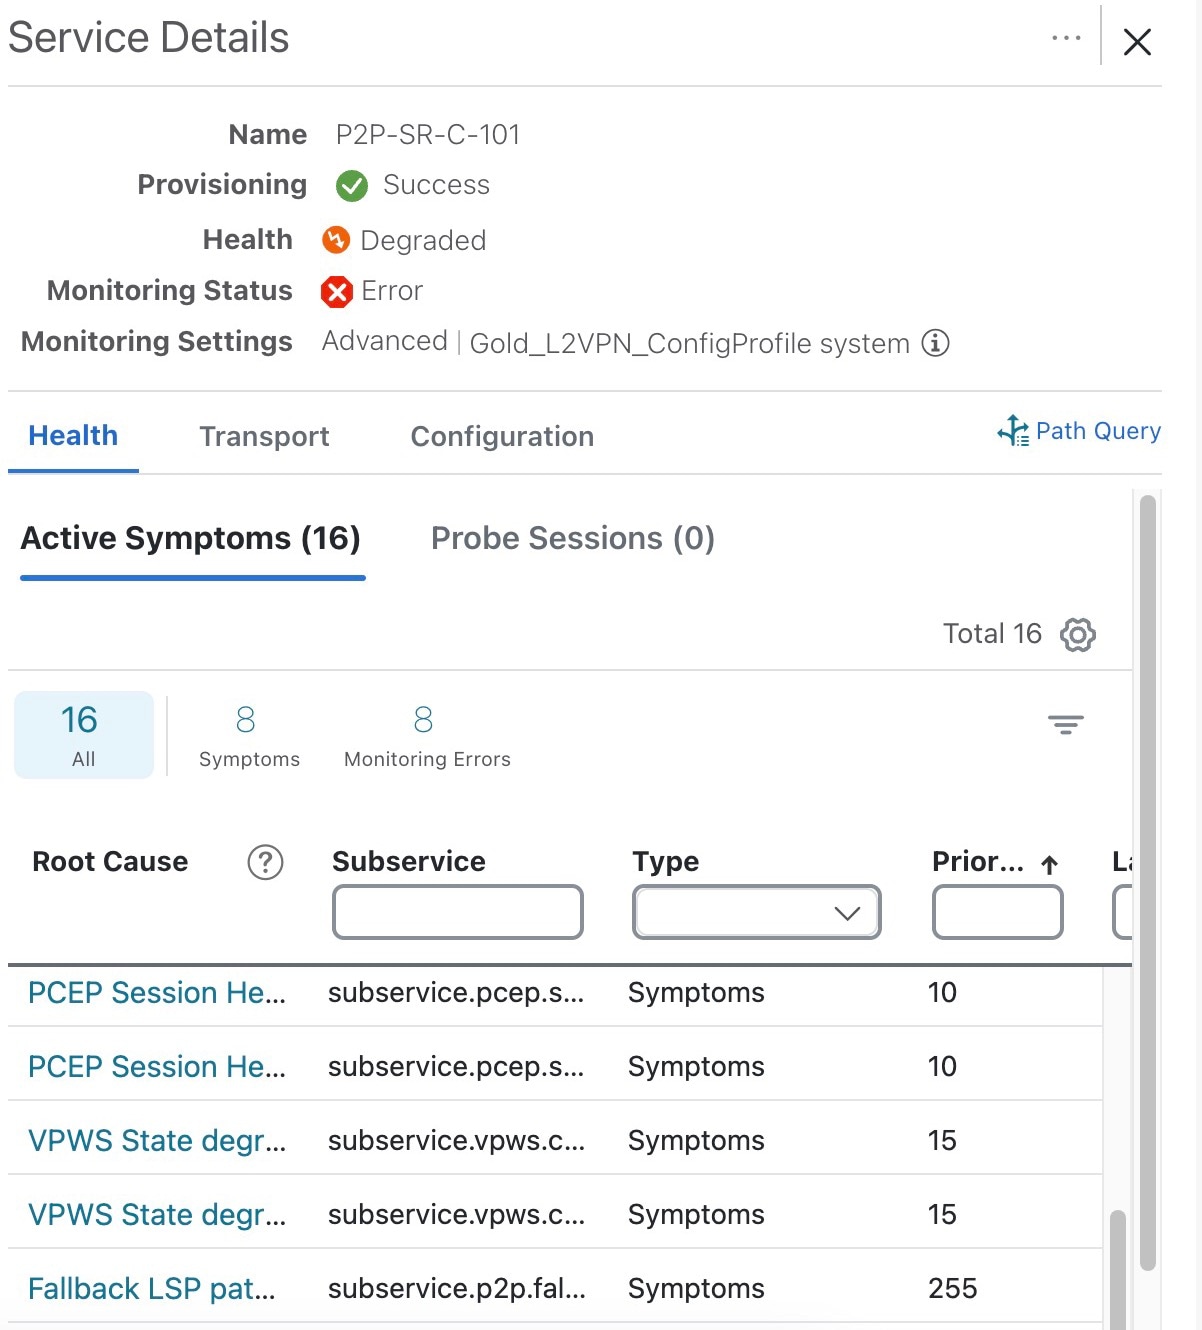
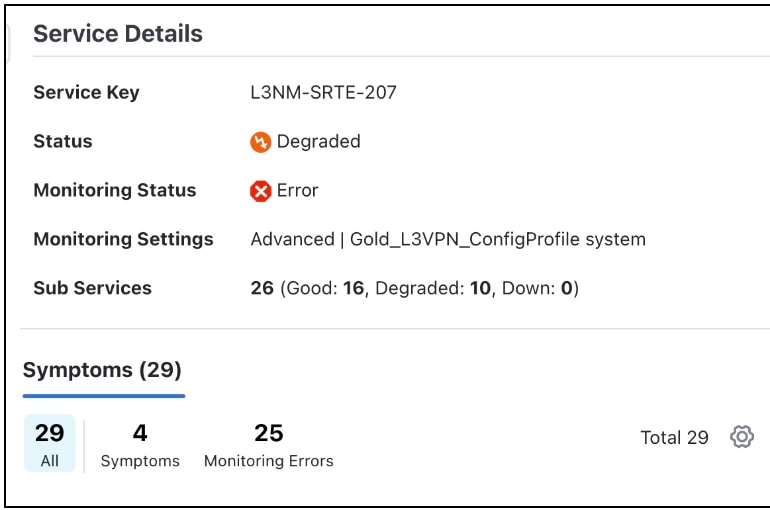
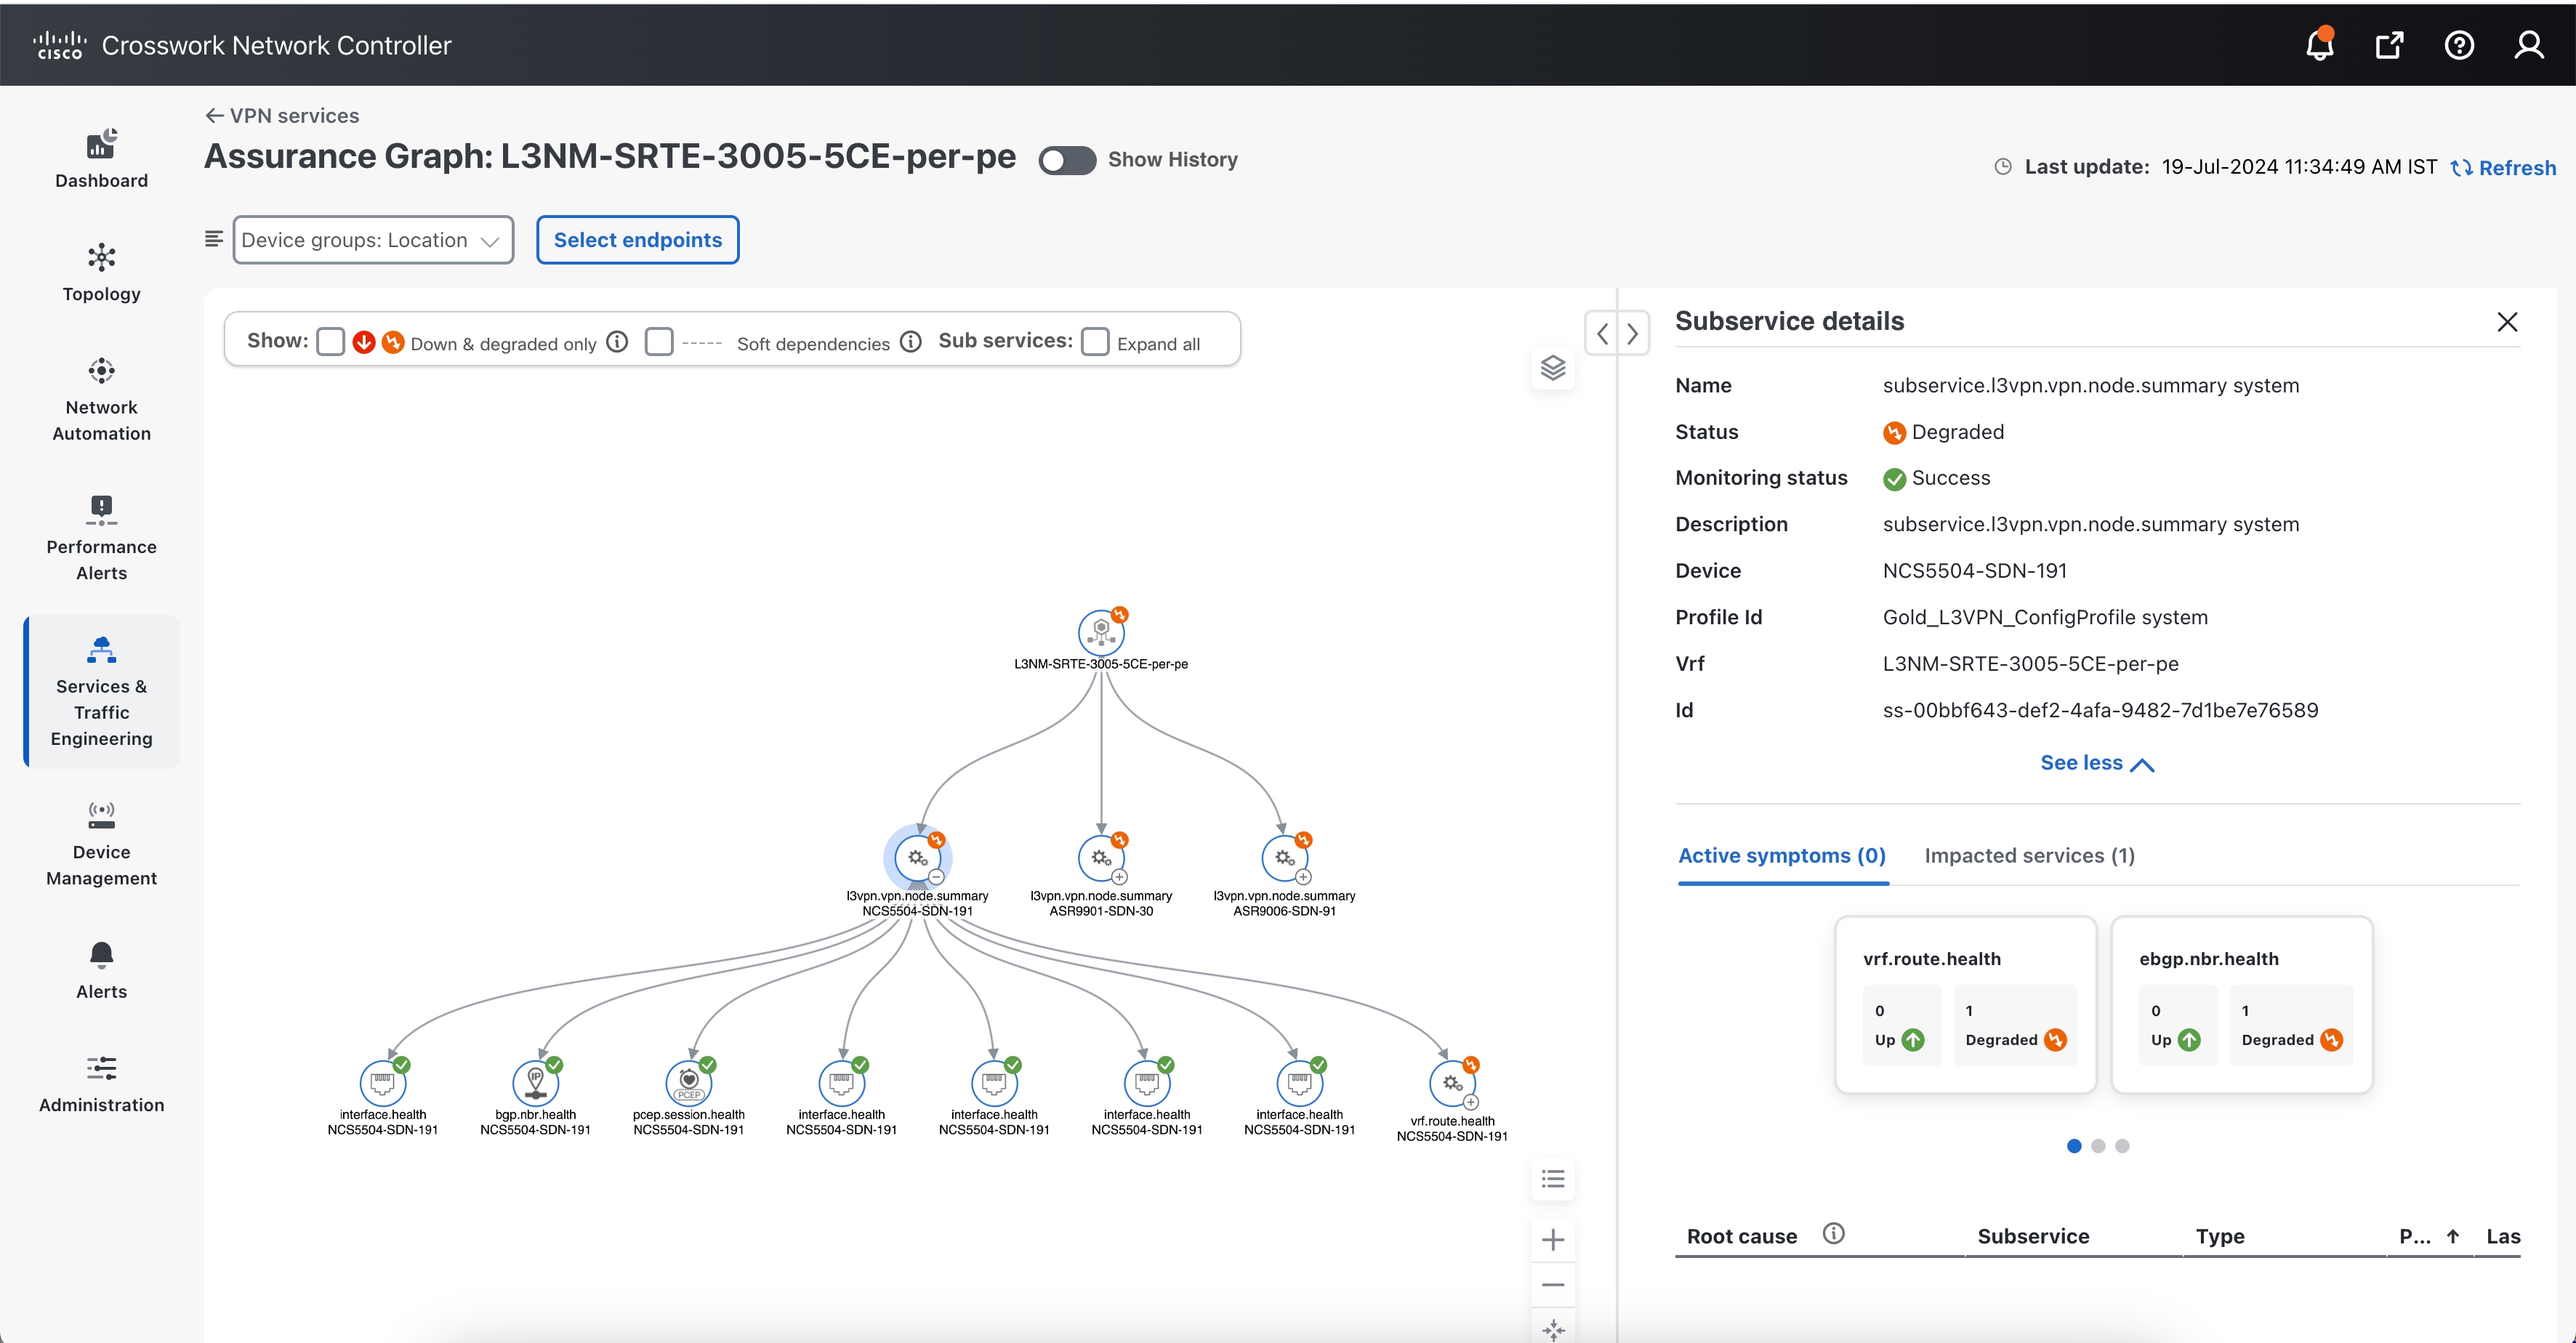
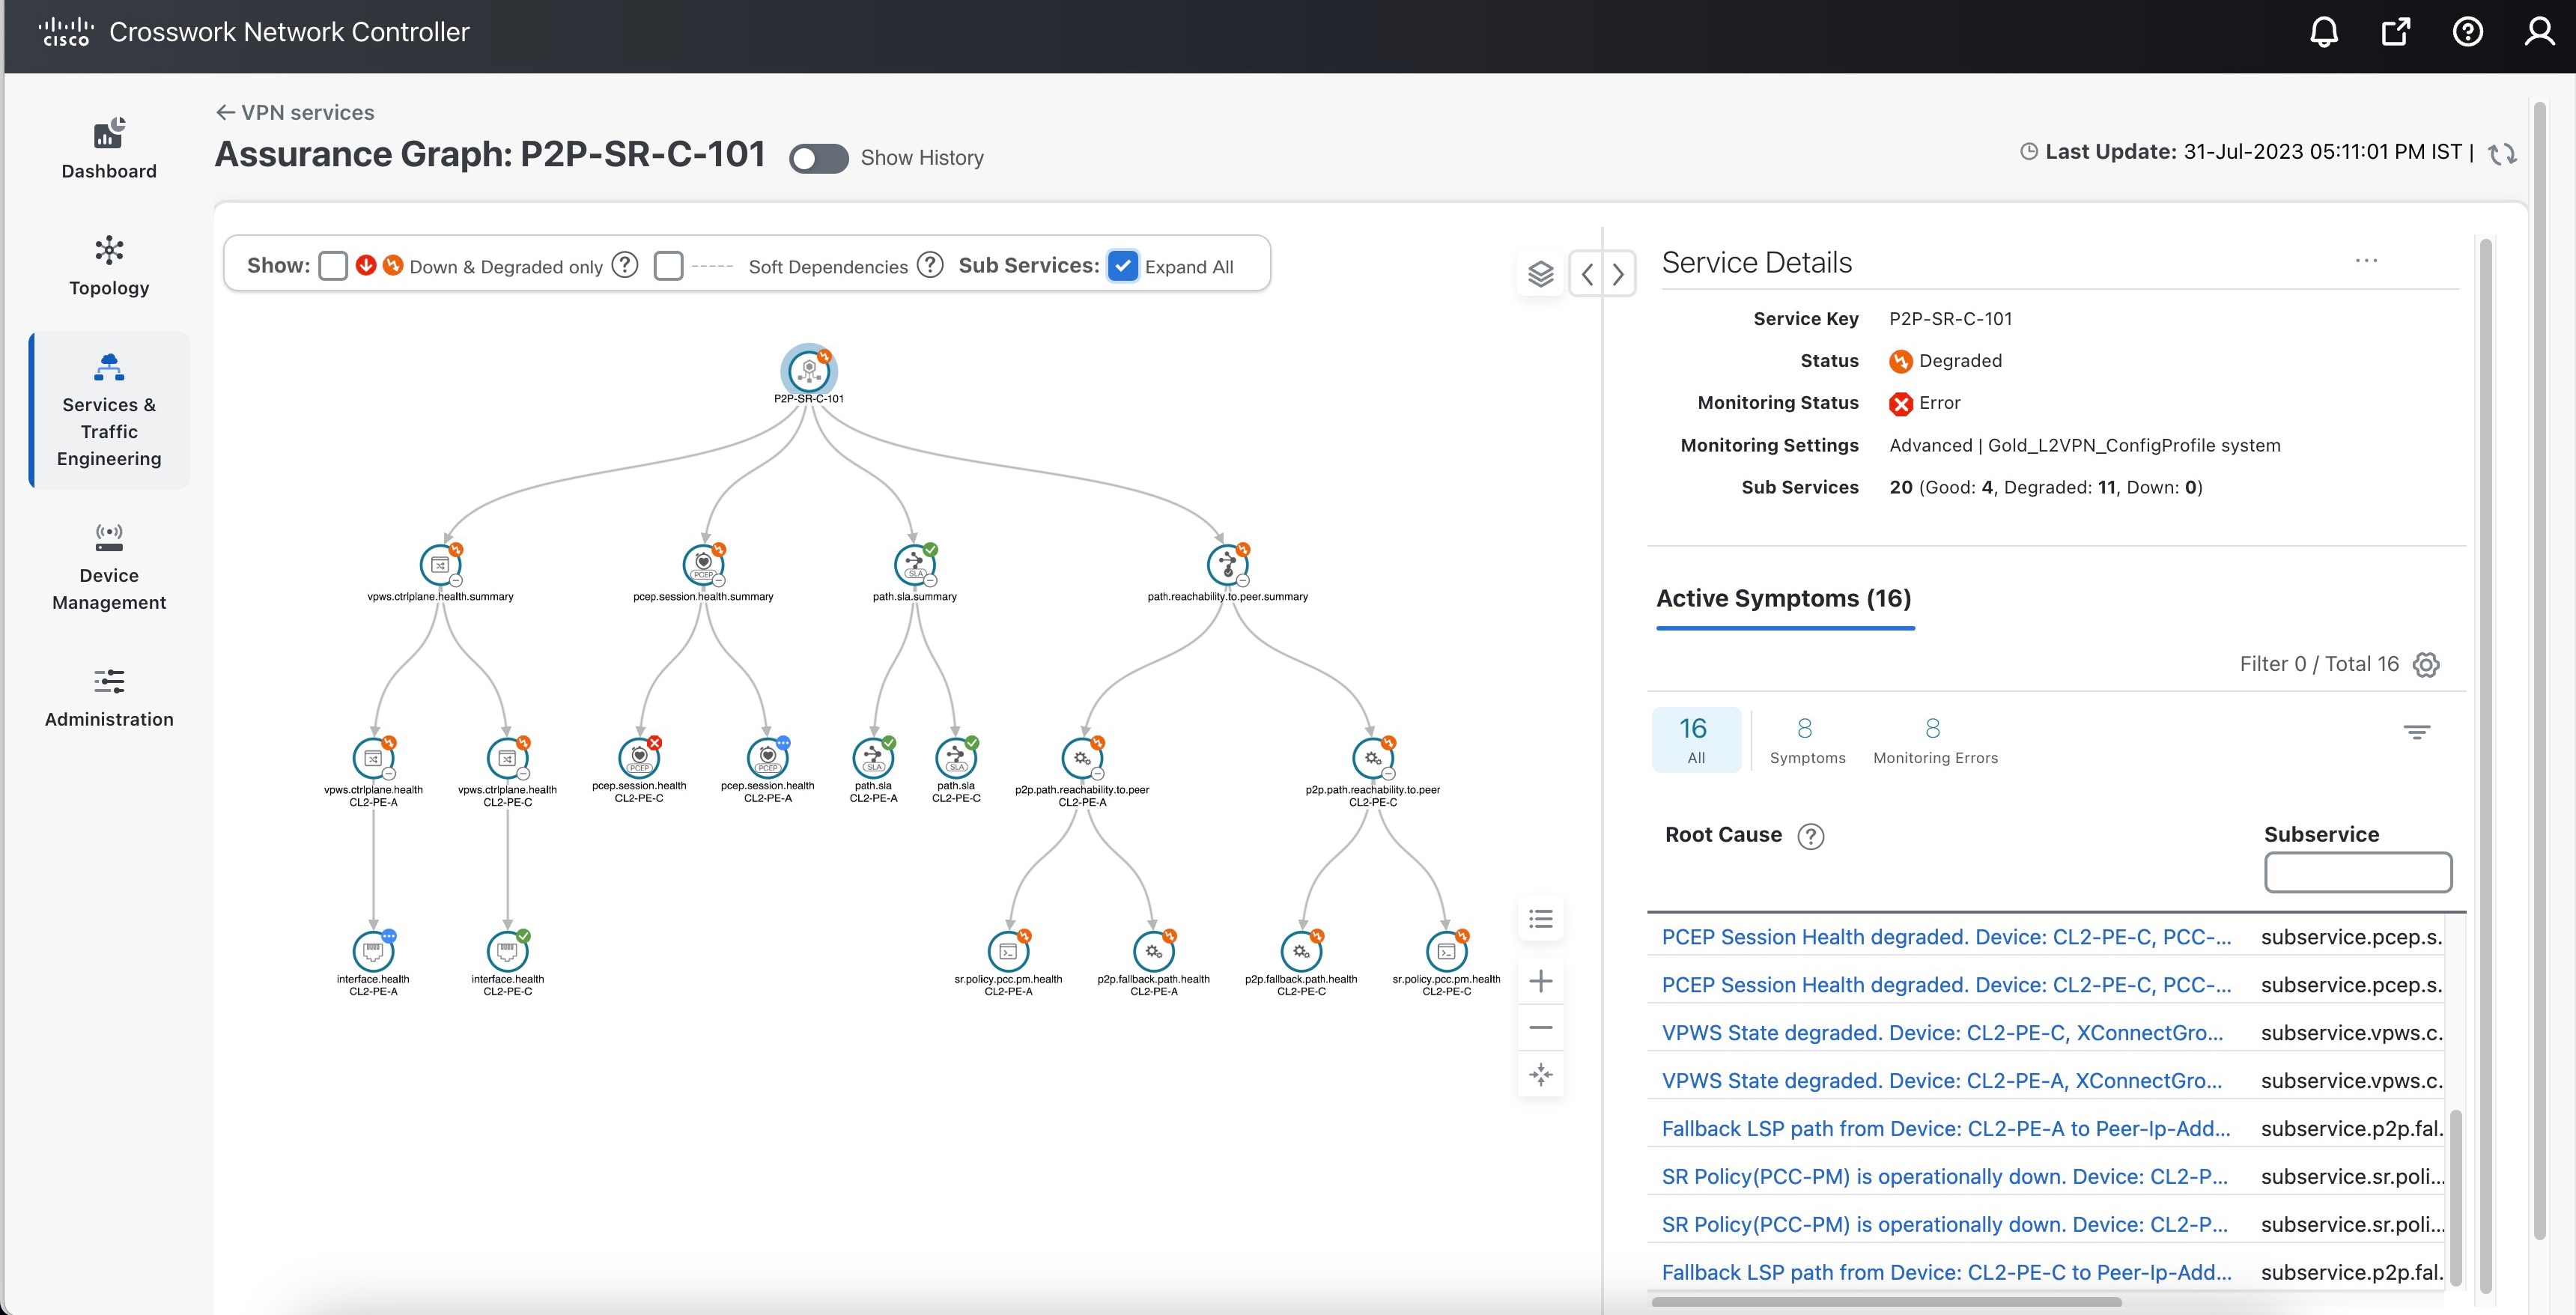
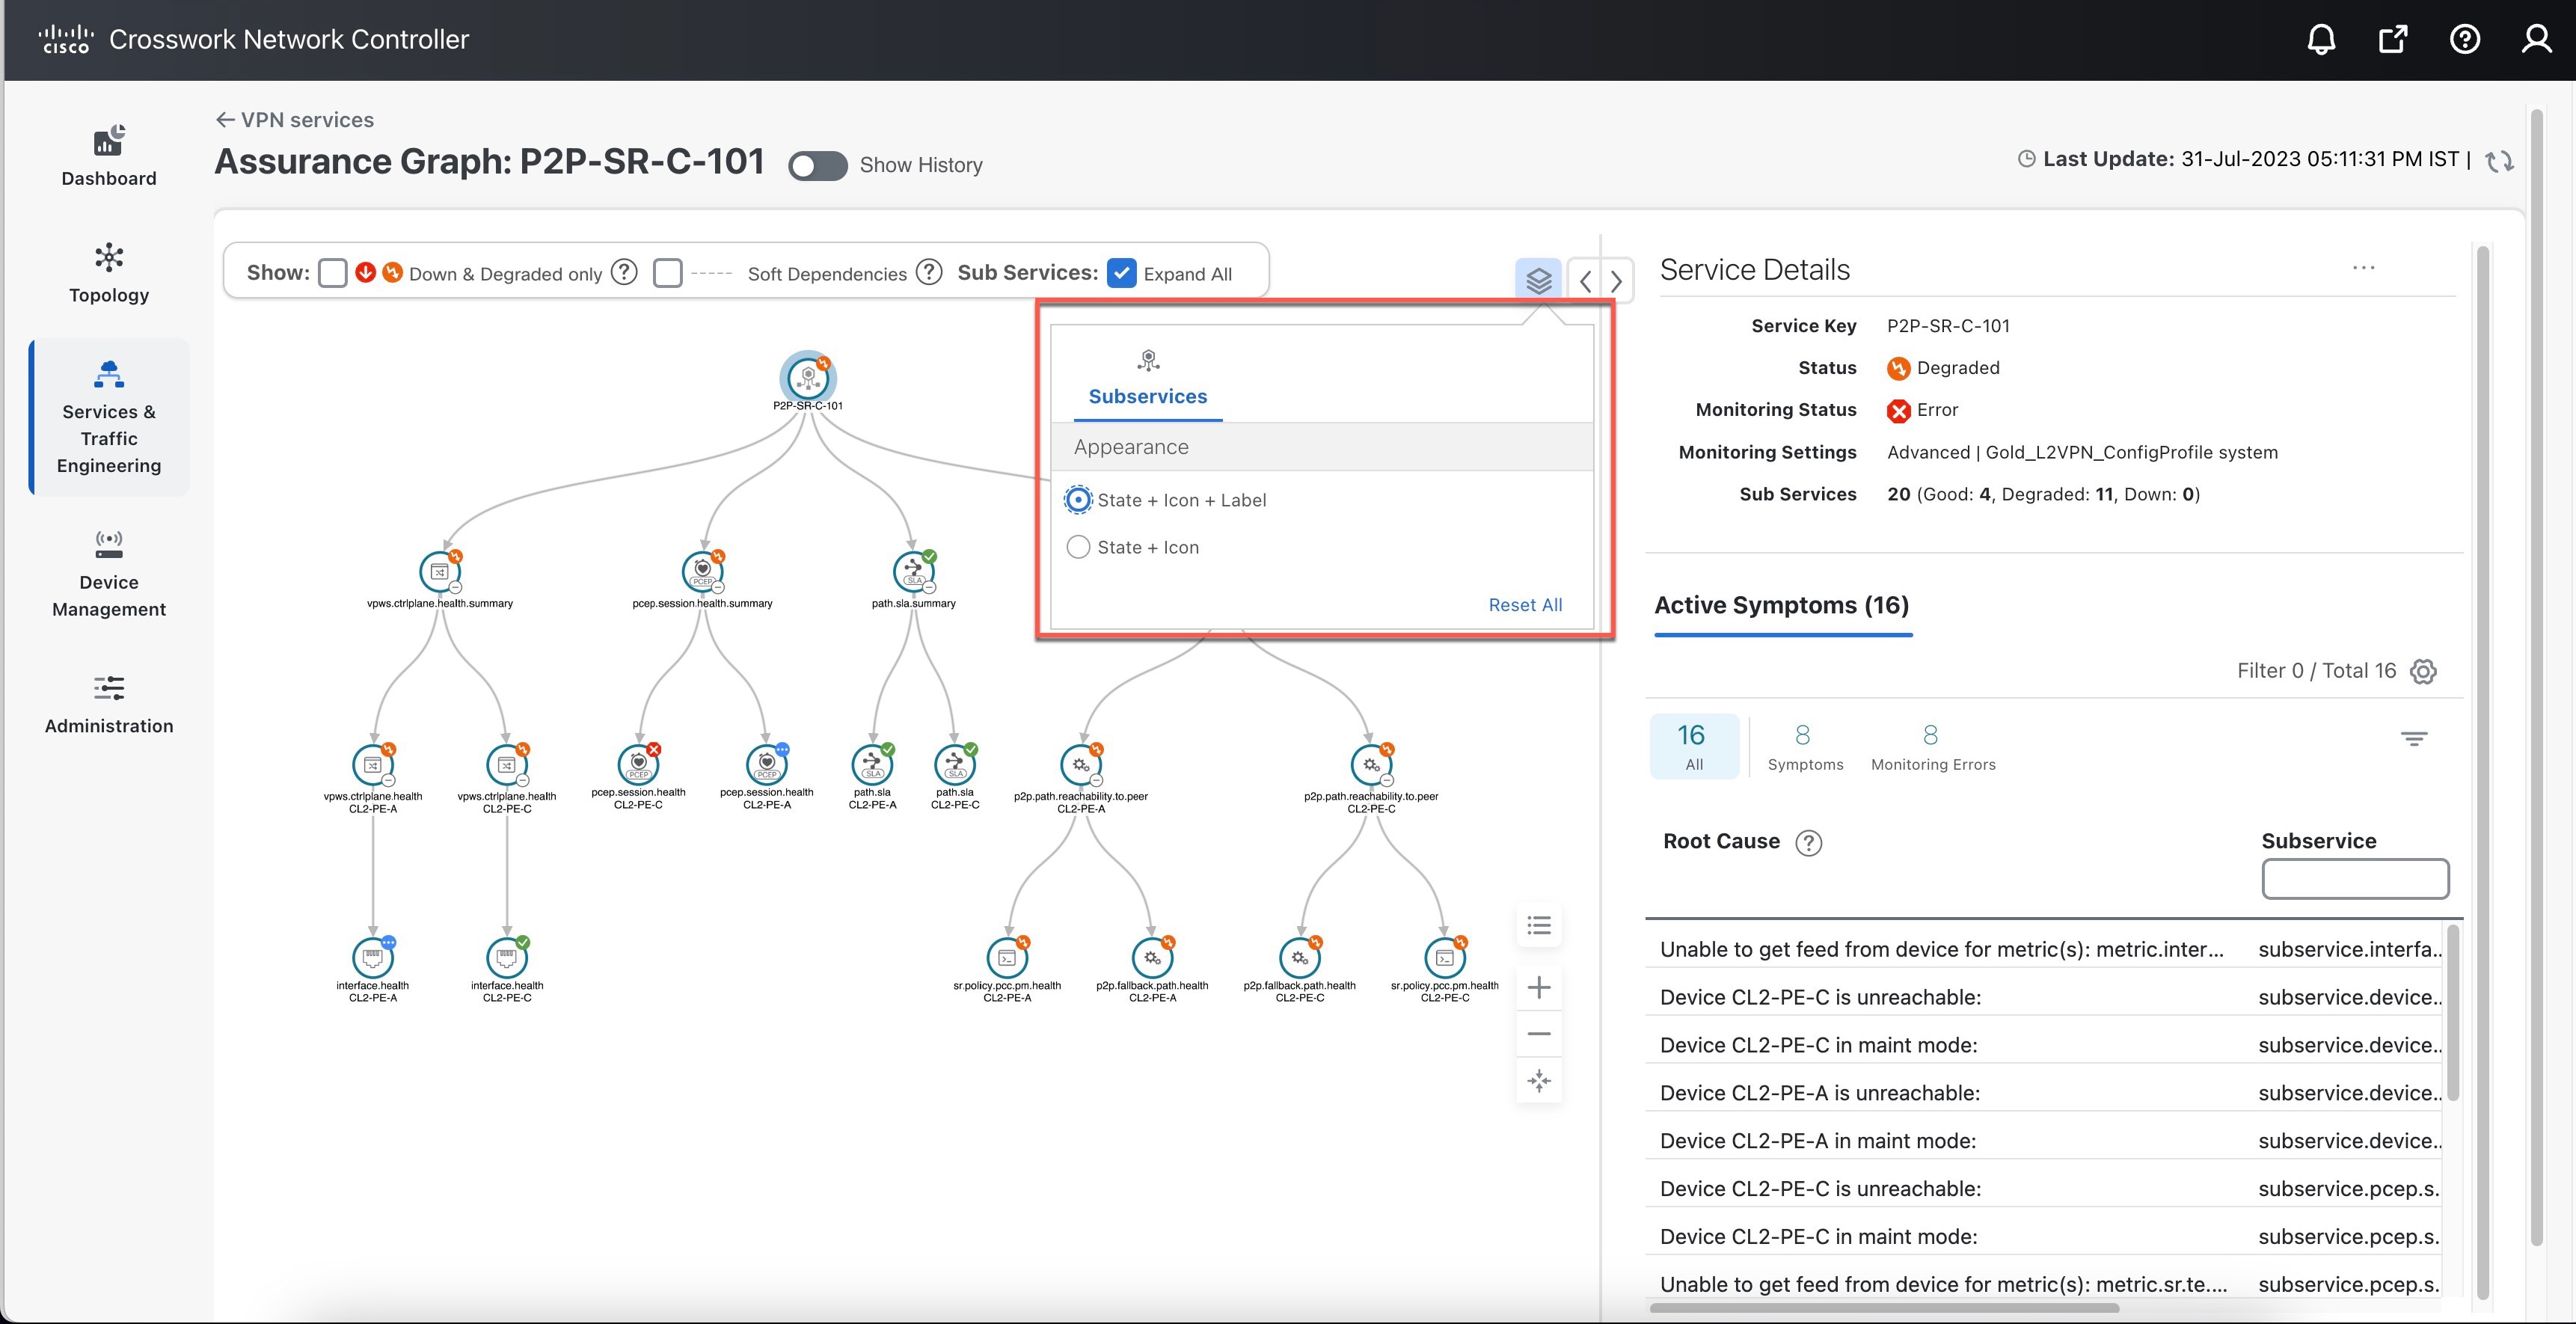
You can view the Monitoring Status of a service from its Service Details page.

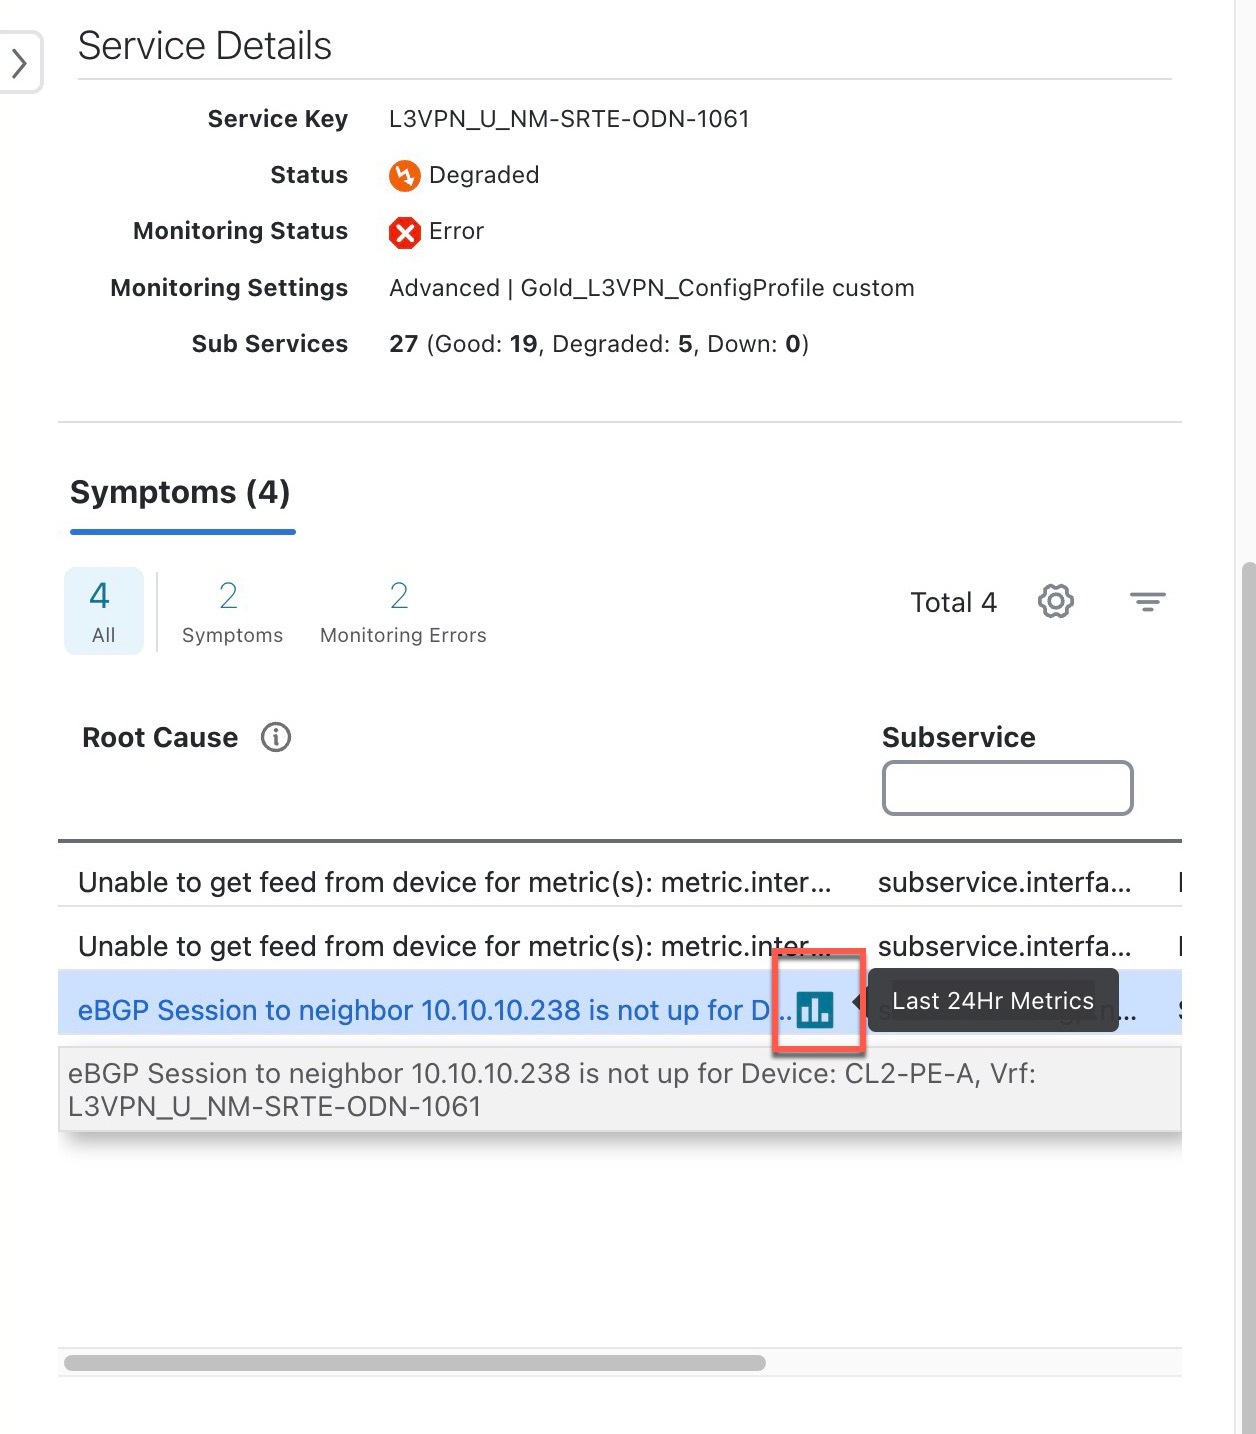
From the main menu, choose Services & Traffic Engineering > VPN Services. Locate the service that you are interested in and under the Actions column, click View Details. This page displays the Monitoring Status and the Health status of the service.

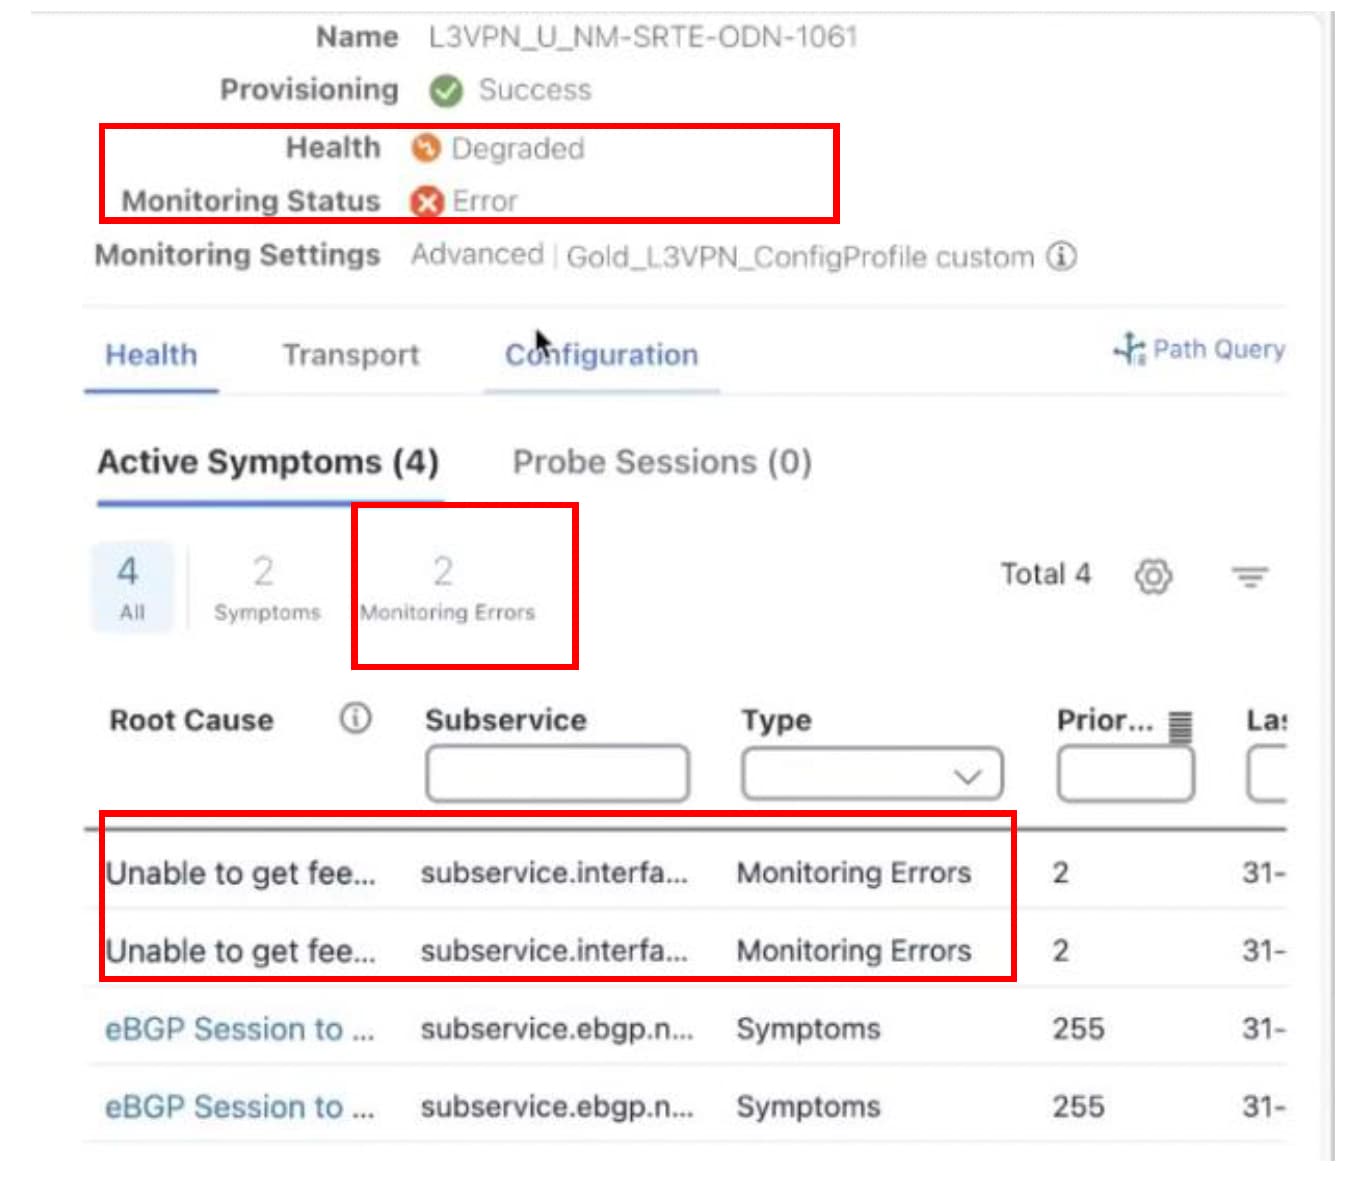
Monitoring status for a service can be either Healthy or Error.

  • Healthy: This means the end-to-end flow of monitoring the service is working as expected and Crosswork Network Controller is able to evaluate the health of the service successfully.

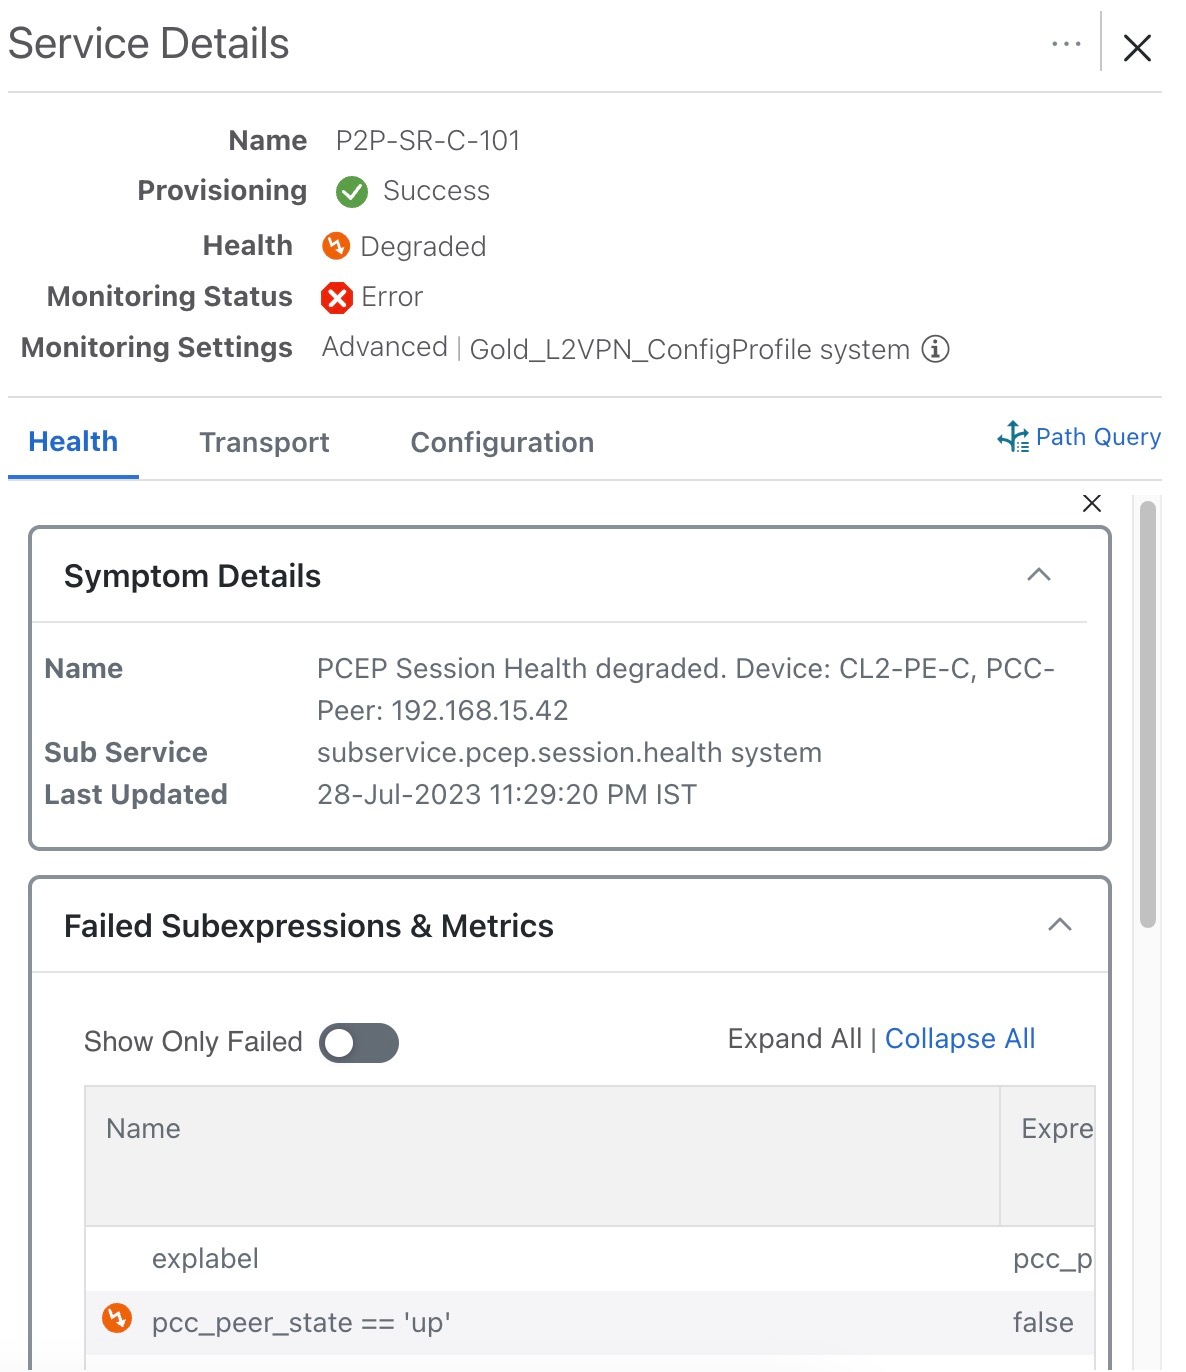
  • Error: This means Crosswork Network Controller is unable to monitor the current health of the service due to component failures, operational errors or device errors, and the health status that is displayed is the last known health of the service. You can filter monitoring errors using the mini dashboard or the filters.


    Note


    Monitoring errors reported on account of device health do not affect the overall health of the service.

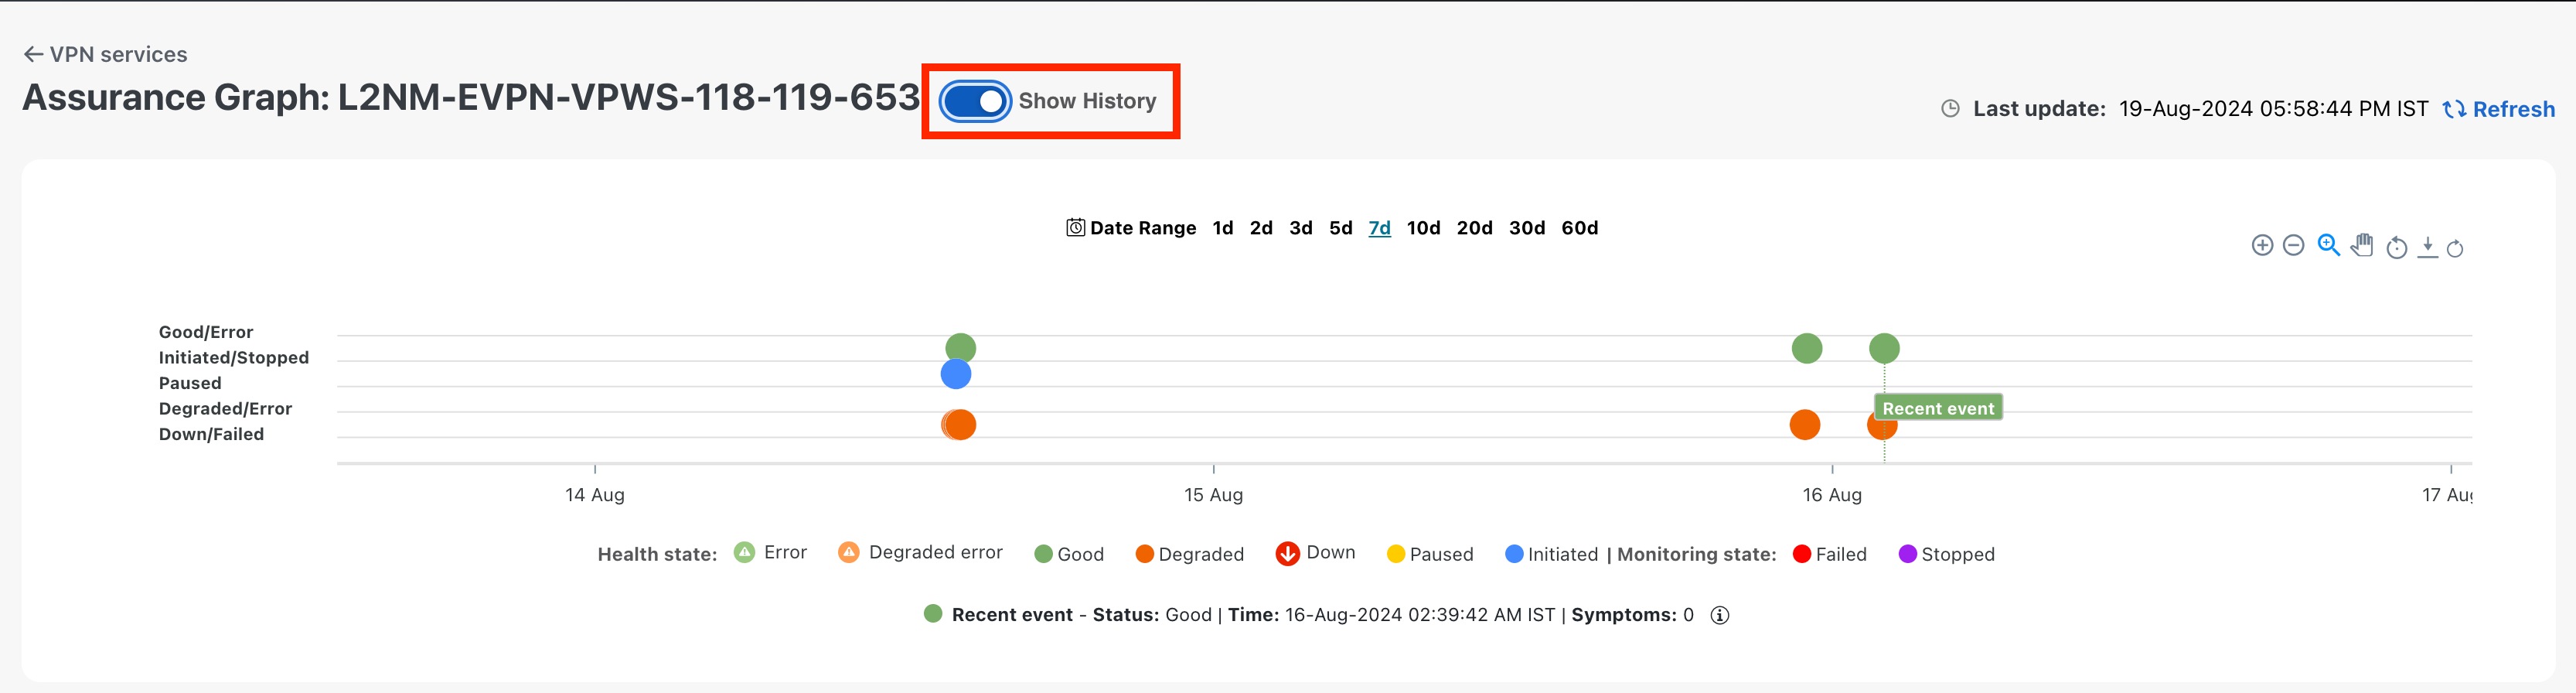
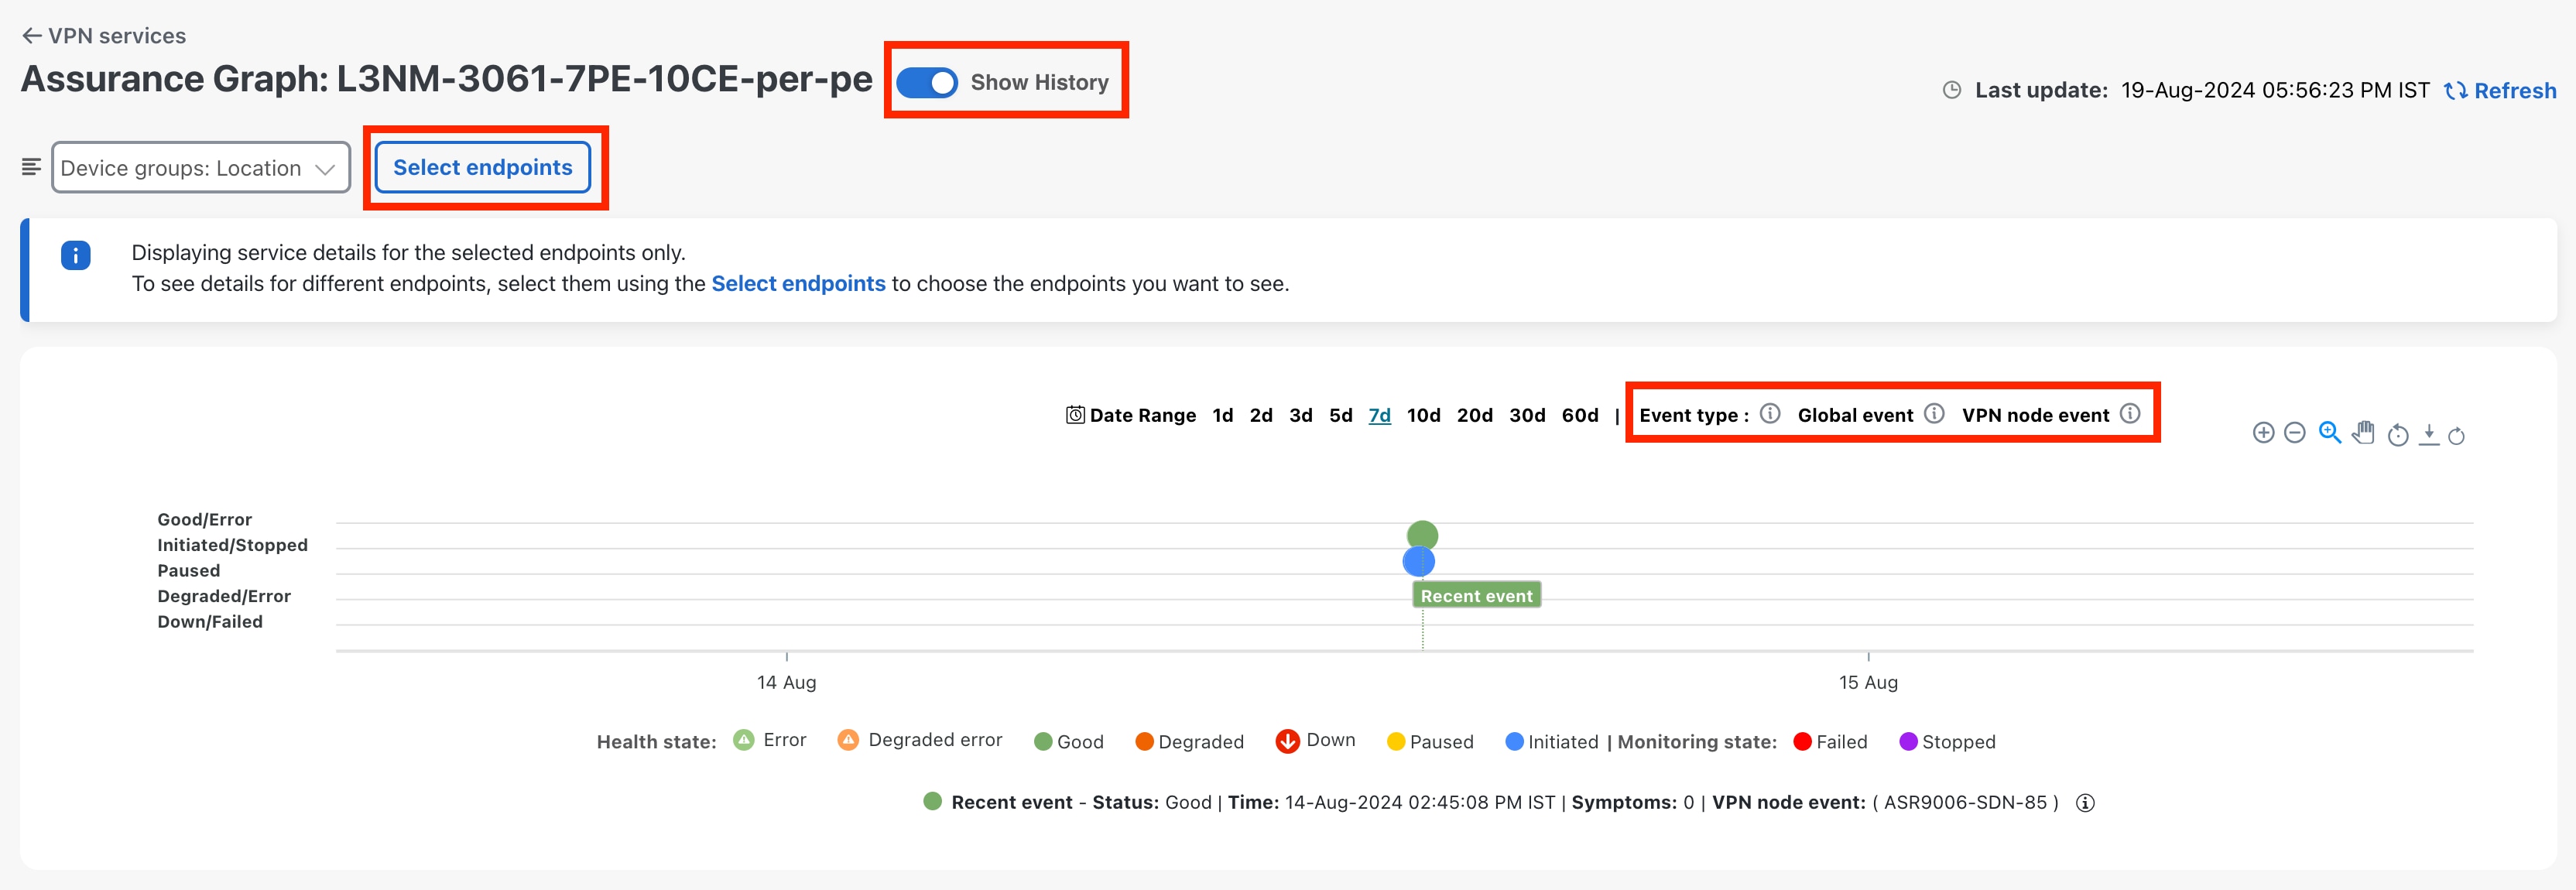
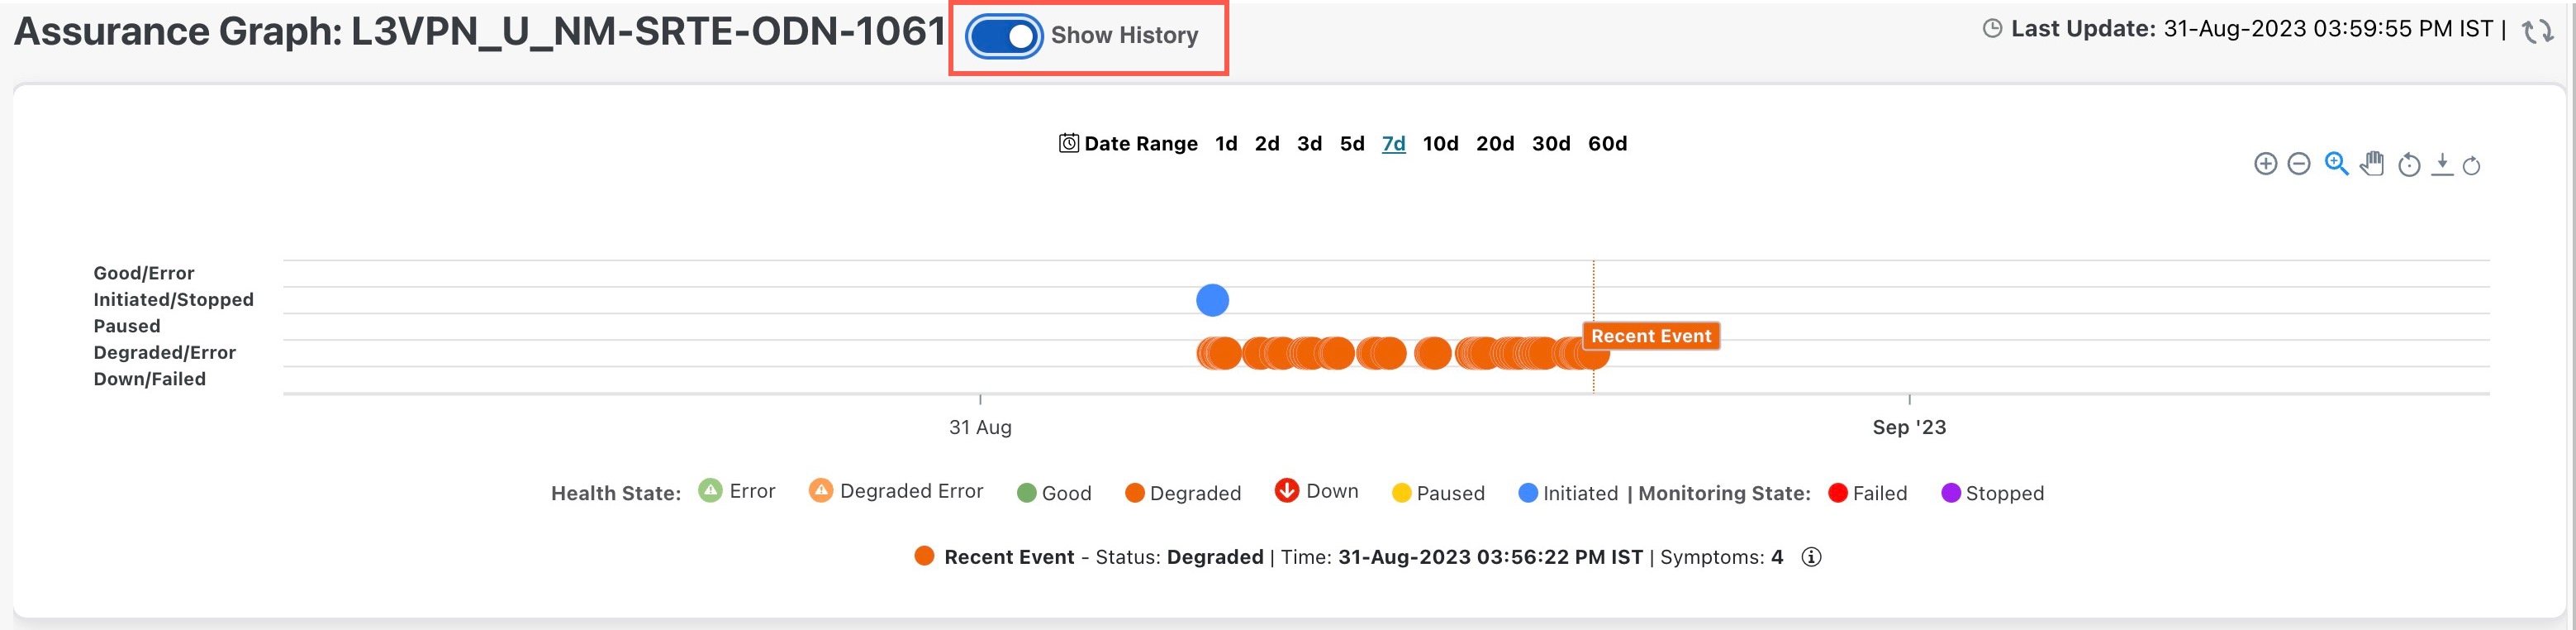
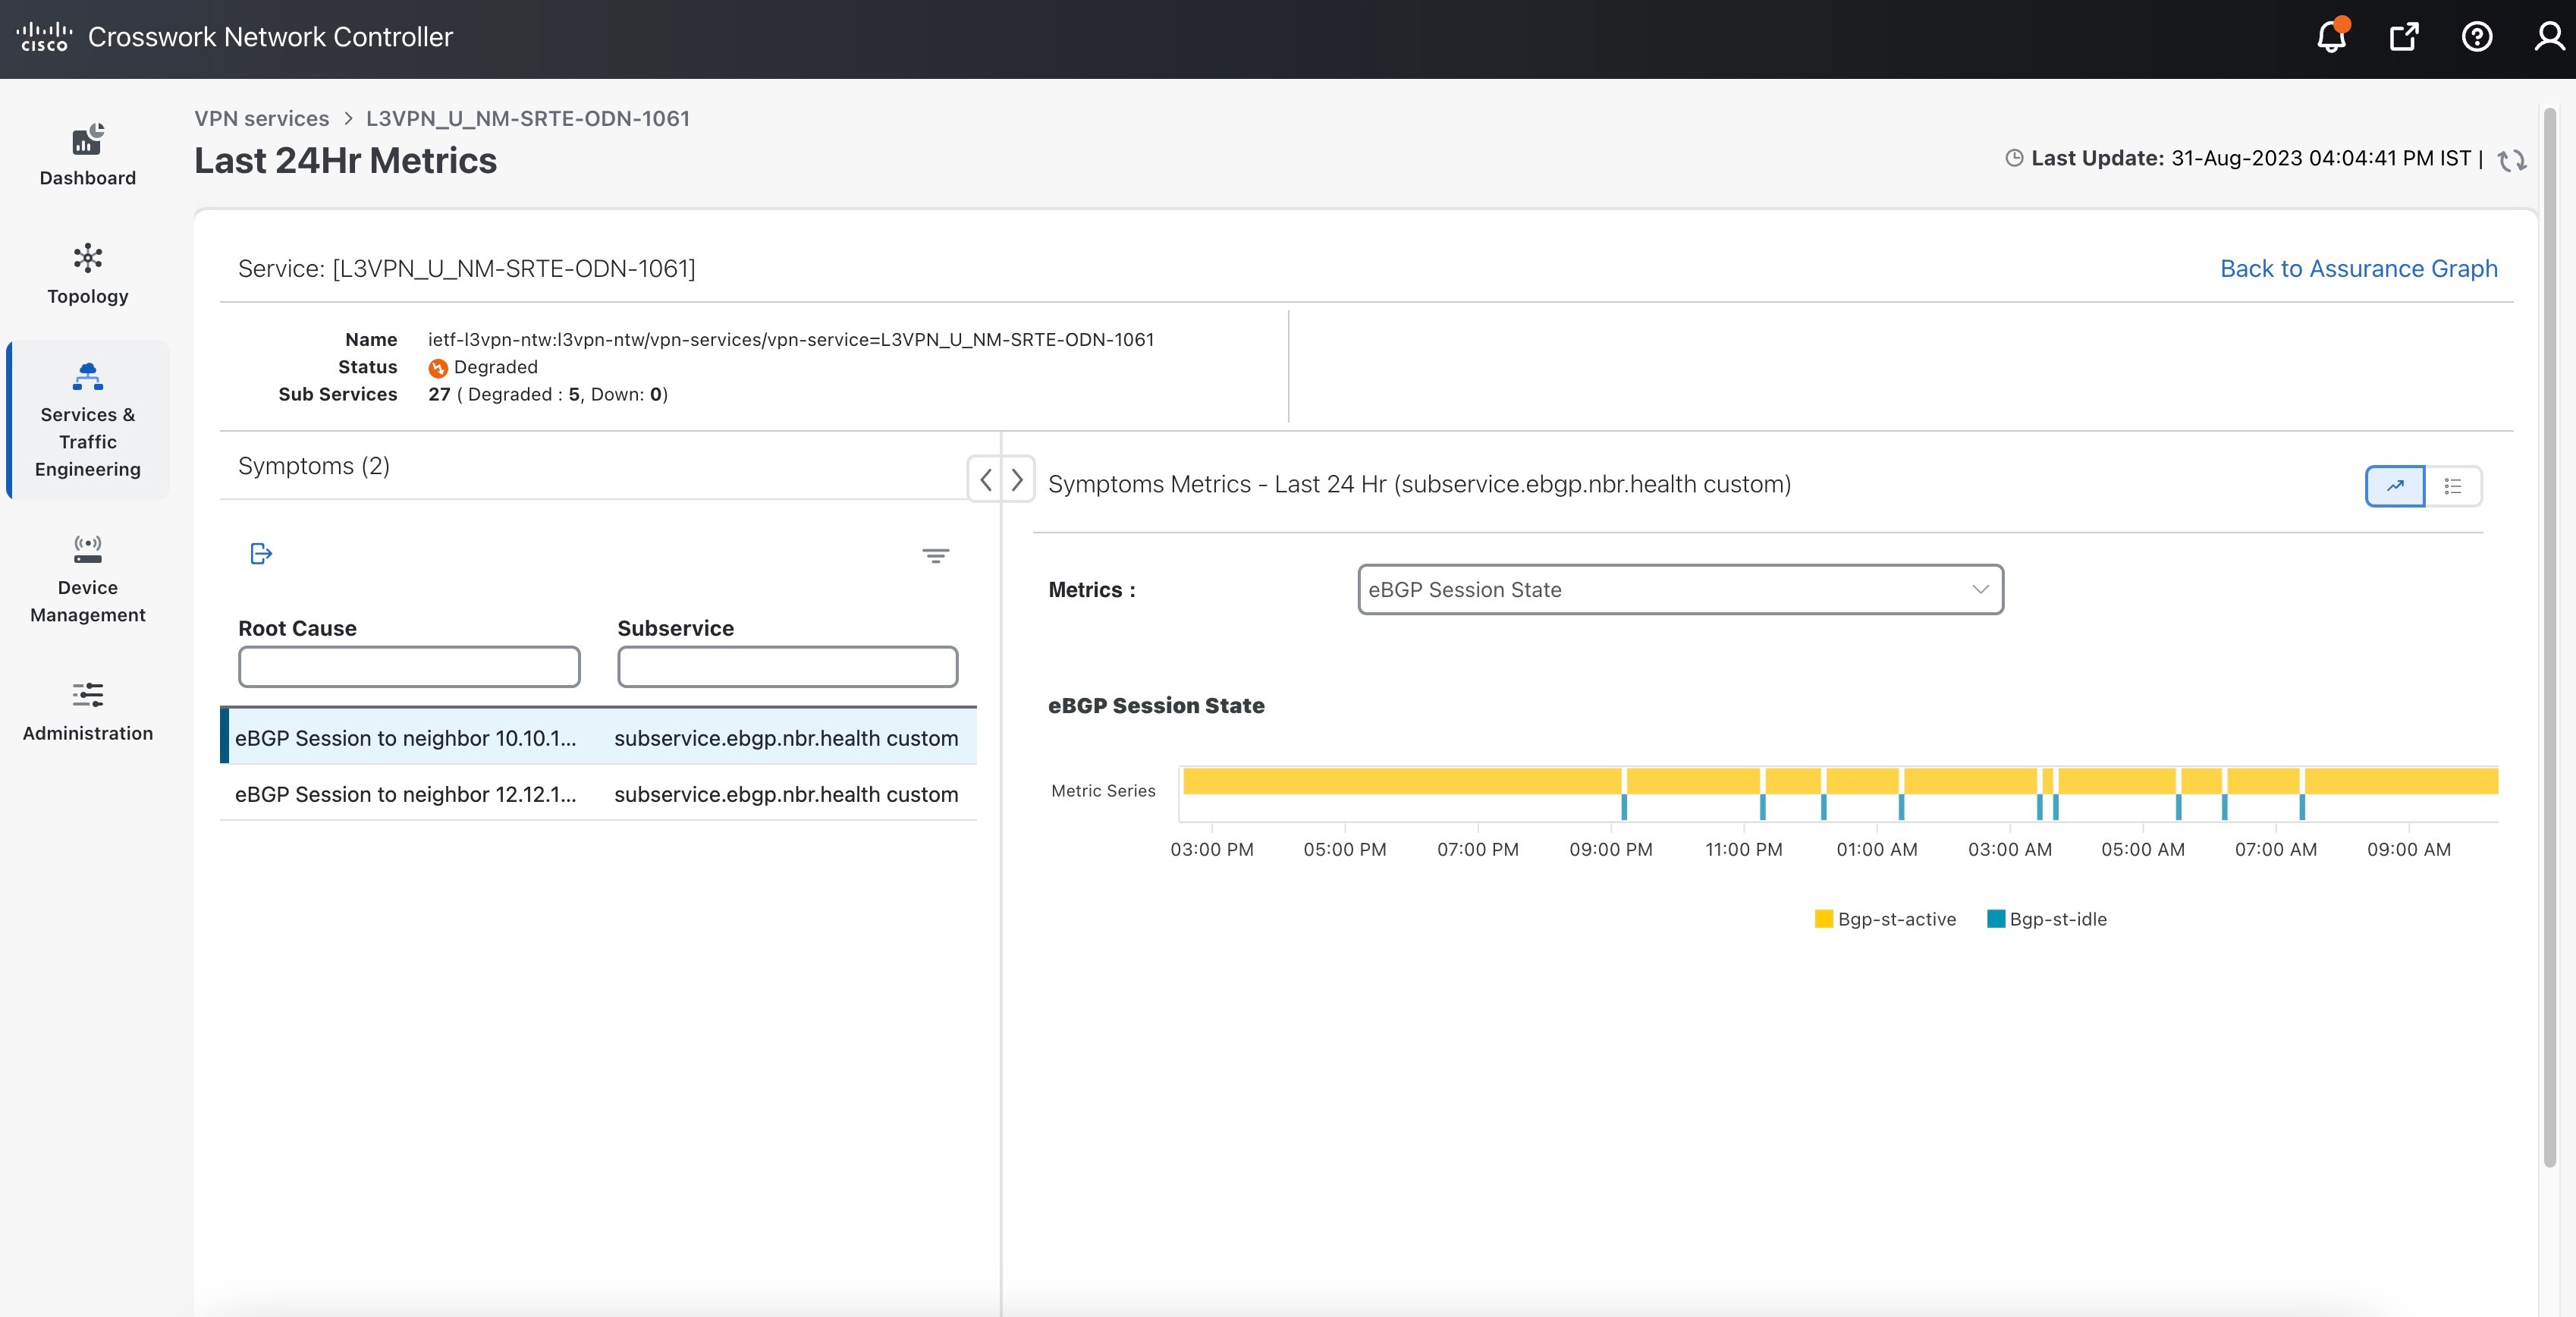
In the Historical Graph, Events of Significance (EoS) are displayed for monitoring errors as well. If the service is healthy but there are monitoring errors, a green warning icon is displayed. However, if the service is degraded and there are monitoring errors, then an orange warning icon is displayed. Clicking these icons provides you with the details in the symptoms table with type as Monitoring Errors.


Note


The Historical Graph displays monitoring errors only when the Monitoring Errors setting is enabled via API. There is no option to enable this setting from the UI. Once this setting is enabled, the system starts to log these monitoring errors as Events of Significance and display them in the historical graph. Refer to the API documentation on Cisco Devnet for more information.


Identify Active Symptoms and Root Causes of a Degraded Service

By analysing the root cause of reported active symptoms and impacted services, you can determine what issues must be addressed first to maintain a healthy setup and what requires further inspection and troubleshooting.


Note


L3VPN service monitoring is supported on Cisco IOS XR devices and not on Cisco IOS XE devices. For an L3VPN service being monitored, if a provider and devices are deleted, and then added again, the monitoring status will remain in the degraded state with a monitoring status as Monitoring error. Stop and restart the service monitoring to recover from this error.


To view the active symptoms and root causes for a service degradation:

Procedure


Step 1

From the main menu, choose Services & Traffic Engineering > VPN Services. The service assurance dependency graph opens on the left side of the page and the table opens on the right side.

Step 2

In the Actions column, click and click View Details. The Service Details panel appears on the right side.

Step 3

Select the Health tab and click the Active Symptoms tab. The Active Symptoms table displays Active Symptoms and Monitoring Errors by default. To filter the table to show only the Active Symptoms, either click the Symptoms tab in the mini dashboard above the table or select Symptoms from the filter box under the Type. The table now shows a filtered list containing only the Active Symptoms.

Review the Active Symptoms for the degraded service (including the Root Cause, Subservice, Type, Priority, and Last Updated details).

Active Symptoms

Step 4

Click on a Root Cause and view both the Symptom Details and the Failed Subexpressions & Metrics information. You can expand or collapse all of the symptoms listed in the tree, as required. In addition, use the Show Only Failed toggle to focus only on the failed expression values.

Step 5

Click the Transport and Configuration tabs and review the details provided.

Step 6

Click X in the top-right corner to return to the VPN Services list.


About Assurance Graph

In Crosswork Network Controller, a service instance comprises various subservices, each assured independently. The overall health of the service depends on the health of these subservices. The Assurance Graph visually represents the service instances and their dependent subservices in a graphical format. The topmost node in this logical dependency tree represents the monitored service instance, while the child nodes represent its subservices, which may further depend on other subservices.

This graphical representation helps locate problem areas and provides indications of possible symptoms and impacting metrics, aiding in troubleshooting degradation issues. Crosswork Network Controller updates the Assurance Graph automatically when the service instance is modified.


Note


For L3VPN services, Crosswork Network Controller monitors service at the node level. See Assurance Graph for L3VPN Services for more information.


To view a service in the Assurance Graph, from the Actions column for the service, select Assurance Graph. The Assurance Graph displays the graph on the left pane and details of the service on the right pane. Toggle the Show History button to view the historical data chart. Each dot on the history chart represents one Event Of Significance (EOS) for a service.

For each EOS, you can view the Assurance Graph and symptoms with 24 hours of metrics collected based on the EOS time. For example, for a service for which monitoring was stopped, a dot appears indicating that the monitoring was stopped. Clicking and dragging over a selected range on the EOS allows you to zoom in on the time range, and hovering over the EoS provides details about the event and associated symptoms.

Assurance Graph for L3VPN Services

For L3VPN services, Crosswork Network Controller monitors the service and the builds the Assurance graph at the node level. The graph includes a summary node for each device and feature-level nodes under each summary node. Nodes with dependencies spanning other nodes (for example path.sla.summary) have a feature-level summary node in the graph.

Select endpoints

The Assurance Graph builds its view based on the data-sending endpoints (headends) of VPN nodes. If the Assurance graph becomes too cluttered with more than 50 nodes, Crosswork Network Controller indicates that the graph is too large to display. Use the Select endpoints option above the graph to view up to 50 endpoints at a time.

The Assurance Graph filtering is based only on the VPN nodes and does not support filtering by a combination of VPN nodes and endpoints. For example, in a service with 2 VPN nodes, each having 2 endpoints (totaling 4 endpoints), deselecting one endpoint using the Select endpoints option will not update the Assurance Graph. The graph updates only when both the endpoints for a VPN node are removed, leading to the entire VPN node being removed from the Assurance graph.


Note


For a service, the Transport Tab displays all discovered transports related to selected VPN nodes, considering both headend and tailend roles based on the import/export policy configured in the service intent. When you use the Select endpoints option and deselect a headend endpoint, the Transport tab updates to remove the headend endpoint from view but may still show the tailend endpoint if it is relevant to other headends.

In contrast, the Assurance Graph focuses only on headend endpoints. If you deselect a endpoint and no other endpoints are left for that node, the graph removes the entire node from the display.


Show History

When you toggle the Show History button to view the historical data chart, you’ll see two types of events: VPN Node events and Global events. The event type is indicated in the description of the Event of Service (EoS) when you hover over it.

  • Global Events: These events span multiple VPN nodes. For example, an EoS in the probe service (path.sla.summary) is classified as a Global event.

  • VPN Node Events: These events are specific to a single VPN node.

In L3VPN services, symptom counts are shown at the VPN node level, with the Device ID (VPN node name) displayed alongside the symptoms. The timeline series in the Show History view displays these symptoms at the VPN node level (endpoint).

The Service Details will continue to show the total symptoms count of the service, for the selected EoS time.


Note


If endpoints are selected, the total symptom count indicates the total symptom count of the selected endpoints.


Service details

In the Service details page, the Active Symptoms tab shows the health details of feature-level nodes, including the number of subservices in the Up or Degraded state. Clicking on the Degraded state in a feature node, filters the table to display symptoms and monitoring errors only for that node.

Identify Root Causes Using Assurance Graph

You can use the Assurance Graph to inspect and drill down to the root cause of a service degradation.

Before you begin

Ensure that service health monitoring is enabled for the service you want to inspect. For details, see Start Service Health Monitoring.


Note


For an L3VPN service being monitored, if a provider and devices are deleted, and then added again, the monitoring status will remain in the degraded state with a monitoring status as Monitoring error. Stop and restart the service monitoring to recover from this error.


To identify the root causes using Assurance Graph, do the following:

Procedure


Step 1

From the main menu, choose Services & Traffic Engineering > VPN Services.

Step 2

In the Actions column, click for the required degraded service and click Assurance Graph. The service assurance dependency graph view of services and subservices appear with the Service Details panel showing Service Key, Status, Monitoring Status, Monitoring Settings, Sub Services, and Active Symptoms details.

This may take up to 5-10 minutes to update after a service has been enabled for monitoring.

At the top-right of the service assurance dependency graph, select the stack icon to select the appearance option for the Subservices: State + Icon + Label or State + Icon.

Step 3

By default, the Assurance Graph displays a concise view with only the service and the top level dependencies (feature nodes). Click the + icon in the nodes to expand the graph and to view the dependent details. To expand all the nodes at once, click the Subservices: Expand All check box at the top.

Step 4

Select a degraded subservice in the Assurance Graph. The Subservice Details panel appears with subservice metrics, as well as subservice specific Active Symptoms and Impacted Services details.

  • Active Symptoms: Provides symptom details for nodes actively being monitored.

  • Impacted Services: Provides information for services that are impacted by issues based on historical monitoring of health status.

Note

 
At the top left of the service assurance dependency graph, check the Down & Degraded only or Soft Dependencies check boxes to further isolate the subservices. Soft Dependencies implies that a child subservice’s health has a weak correlation to its parent’s health. As a result, the degraded health of the child will not result in the parent’s health degradation.

Step 5

Inspect the Active Symptoms and Impacted Services information, and the root causes associated with the degraded service to determine the issues that may need to be addressed to maintain a healthy setup.


Identify Root Causes Using Last 24Hr Metrics

You can utilize the Last 24Hr Metrics to identify the issues with the degraded services within a specific time range. By isolating the issues within a specific time range, you can drill down on the details that may have caused the degraded (or down) service that can lead to troubleshooting the service or the node to address detailed symptoms.

Before you begin


Note


For an L3VPN service being monitored, if a provider and devices are deleted, and then added again, the monitoring status will remain in the degraded state with a monitoring status as Monitoring error. Stop and restart the service monitoring to recover from this error.


Procedure


Step 1

From the main menu, choose Services & Traffic Engineering > VPN Services. The service assurance dependency graph opens on the left side of the page and the table opens on the right side.

Step 2

In the Actions column, click for the degraded service and click Assurance Graph. The service assurance dependency graph of services and subservices appear with the Service Details panel showing Service Key, Status, Monitoring Status, Monitoring Settings, Sub Services, and Active Symptoms details.

Note

 
This may take up to 5-10 minutes to update after a service has been enabled for monitoring.

Step 3

At the top of the page, click the Show History mode toggle. The historical Date Range graph appears. This graph shows different ranges of historical health service monitoring details from one day (1d) up to sixty days (60d). When you hover over an event on the Date Range graph, a tool tip with information about that event appears (such as date and time of the event, and number of symptoms).

Step 4

Review the Root Cause information by clicking a particular event in the graph. The Service Details panel reloads, showing the active symptoms and the root causes associated with the event. Columns can be resized using your mouse or you can select the gear icon to deselect or select columns you want to appear.

Note


Once you enable Show History mode, Root Cause information in the Active Symptoms table will start to show the blue Last 24Hr Metrics icon. Data from the device will be initially delayed, however, and may take some time before Last 24Hr Metrics begins to populate with data. Until then, the value of zero is reported.

Step 5

To further isolate the possible issues and to utilize the Last 24Hr Metrics, perform the following steps:

  1. In the Date Range graph, use your mouse to select the range of historical health service monitoring details from one day (1d) up to sixty days (60d).

    Note

     
    At the top-right of the Date Range graph, select the appropriate icons to either zoom in or out, horizontally scroll through the date ranges, or refresh the graph to go back to the most recent event, for example. You can also use your mouse to draw a rectangle over events to further zoom in on the degraded devices. Events that are consecutive may appear as a line of white space.
  2. Click on a degraded event in the graph. The Service Details panel reloads, showing any active symptoms and the root causes to be inspected. Expand the table and information as necessary for further details.

Step 6

Check the Down & Degraded Only check box at the top-left corner of the Assurance graph to show only the Subservices which are degraded, along with other dependent but healthy subservices. Inspect the Service Details panel showing the active symptoms and their root cause. Uncheck the Down & Degraded Only check box and check the Soft Dependencies check box in the top-left corner of the Assurance graph. Soft Dependencies implies that a child subservice’s health has a weak correlation to its parent’s health. As a result, the degraded health of the child will not result in the parent’s health degradation.

Use the + or symbols in the bottom-right corner of the Assurance graph to zoom in or out on sub-services mapped. Select the ? to view the Link Color Legend that explains all of the icons, symbols, badges, and colors and their definitions.

Step 7

Select the degraded subservice in the Assurance graph to show the subservice details.

Step 8

Click the Symptoms tab to show any root causes for the service health details that are displayed and then click the Impacted Services tab to view the impacted services.

Step 9

Click X in the top-right corner to return to the VPN Services list and in the Actions column, click for the degraded service in the list and click Assurance Graph to show the Service Details panel.

Step 10

Again, select the Show History toggle in the top-right corner of the Service Details panel before selecting the blue metrics icon in one of the Root Cause rows. The Symptoms Metrics – Last 24 Hr bar chart appears. This chart provides details of the metric patterns, different sessions states (such as active, idle, failed if applicable) for individual root cause symptoms with Status, Session, Start Time, and Duration information to assist in troubleshooting prevailing issues. Use your mouse to hover over the chart to view the different details.


View the Devices Participating in the Service

When a device or interface related subservice degrades, the corresponding devices display an orange icon in the topology view. To view the devices participating in the services, do the following:

Procedure


Step 1

From the main menu, choose Services & Traffic Engineering > VPN Services.

Step 2

Click a service that shows as degraded. The topology map is updated, isolating the corresponding devices participating in that service.

Step 3

At the top-left of the service assurance dependency graph view, select the Show Participating Only check box so that the topology map only shows the devices participating in the service.

Step 4

Hover your mouse over the device icons and review the popup information relating to its Reachability State, Host Name, Node IP, and Type.

The devices that are healthy may show an orange badge to indicate that there are device or interface related subservices underneath that are not healthy. This ensures that unhealthy subservices are easily visible and can be identified from the topological view even if the device itself is healthy. After examining the Service Details for a device, for example, a condition, such as the CPU is low on a subservice node, helps to take the necessary steps to address the unhealthy subservice.


View Collection Jobs

The Parameterized Jobs tab on the Collection Jobs page displays all active jobs created by the Service Health application in Crosswork Network Controller.


Note


If Service Health is not deployed, this page will not contain any data.


Crosswork Network Controller enables you to view Parameterized Jobs, which are template-based collection jobs that support a large number of tasks, including CLI collection jobs. This feature is particularly useful for troubleshooting collection job issues, as it allows you to examine the details of individual devices. Devices are identified by their Context ID (protocol), indicating whether the jobs are gNMI, SNMP, or CLI-based.

Procedure


Step 1

From the main menu, choose Administration > Collection Jobs.

The Collection Jobs page appears.

Step 2

Click the Parameterized Jobs tab.

Step 3

Review the Parameterized Jobs list to identify the devices that may have service health degradation issues. By reviewing Parameterized Jobs, you can identify and focus on gNMI, SNMP, and CLI-based jobs by their Context ID (protocol) for further troubleshooting purposes.

Step 4

In the Job Details panel, select the collection job you want to export and click to download the status of collection jobs for further examination. The information provided is collected in a .csv file when the export is initiated.

Note

 
When exporting the collection status, you must fill in the information each time an export is executed. In addition, make sure to review the Steps to Decrypt Exported File content available on the Export Collection Status dialog box to ensure you can access and view the exported information.

Step 5

Click Export.

Step 6

To check the status of the exported collection job data, click View Export Status at the top right of the Job Details panel. The Export Status Jobs panel appears providing the status of the export request.

Step 7

Review the exported .csv file for collection job details and the possible cause of the degraded device.