Start Service Health Monitoring
Before you begin
The following procedure assumes that you have already provisioned L2VPN/L3VPN services. To create and provision services, refer to the Orchestrated Service Provisioning chapter in the Cisco Crosswork Network Controller 7.0 Solution Workflow Guide.
To start health monitoring for a service:
Procedure
|
Step 1 |
From the main menu, choose . The map opens on the left side of the page and the table opens on the right side. |
||
|
Step 2 |
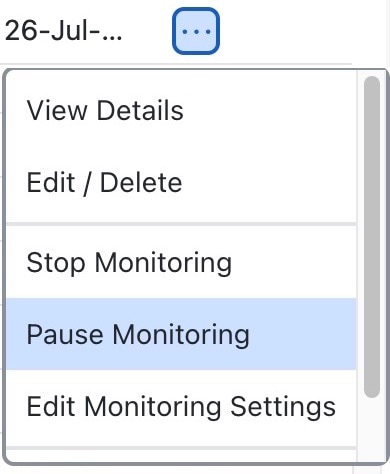
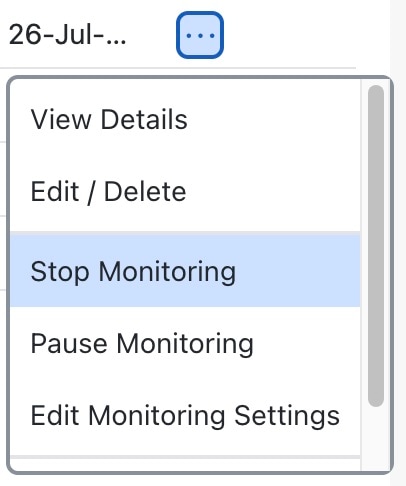
For a service not currently being monitored as indicated by a gray icon in the Health column for which you wish to enable monitoring, click |
||
|
Step 3 |
Click Start Monitoring. 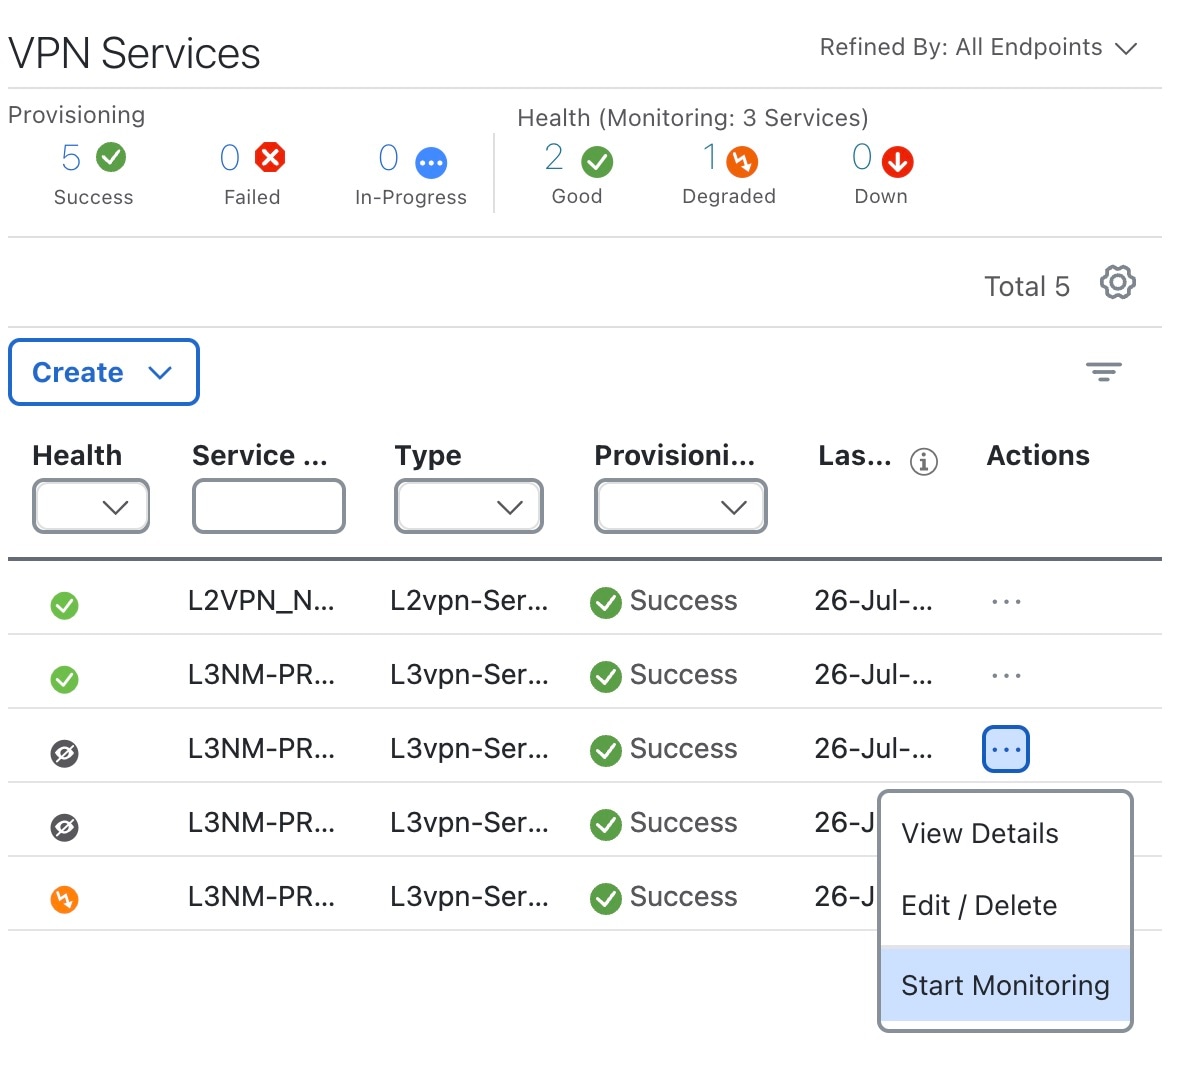 |
||
|
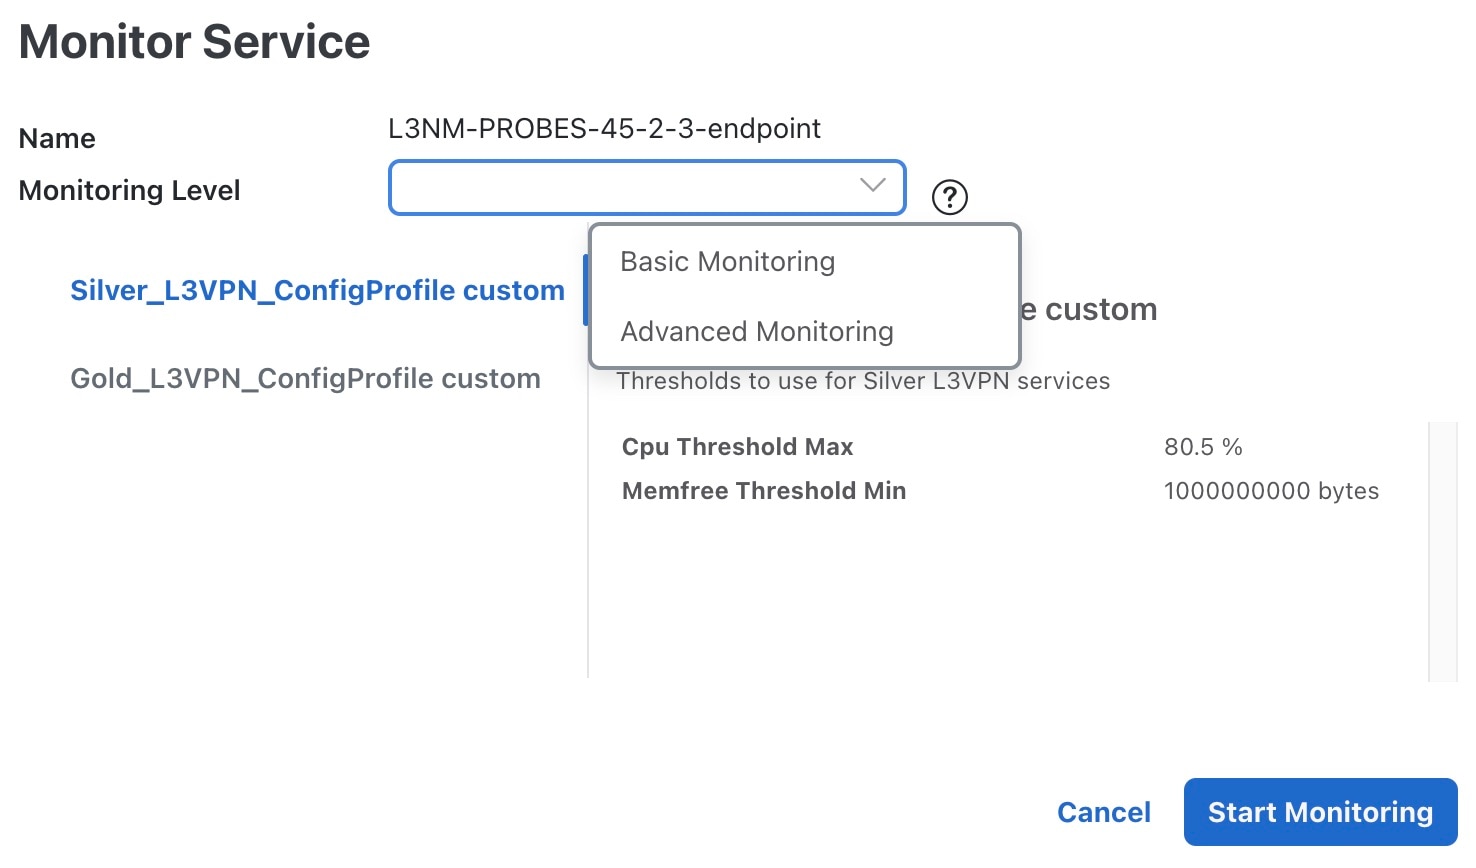
Step 4 |
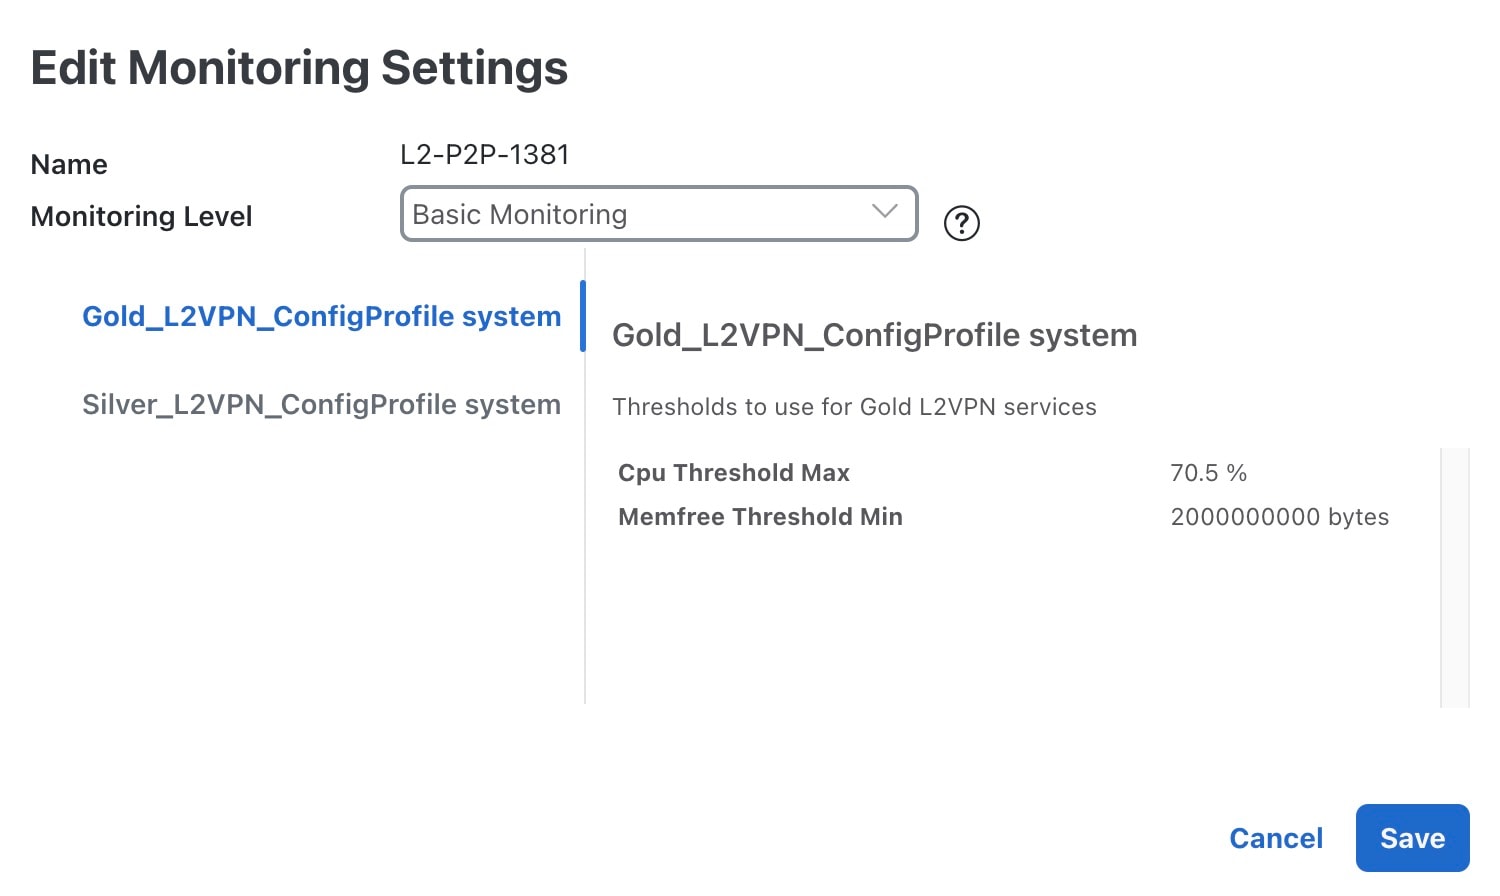
In the Monitor Service window that appears: .
 |
||
|
Step 5 |
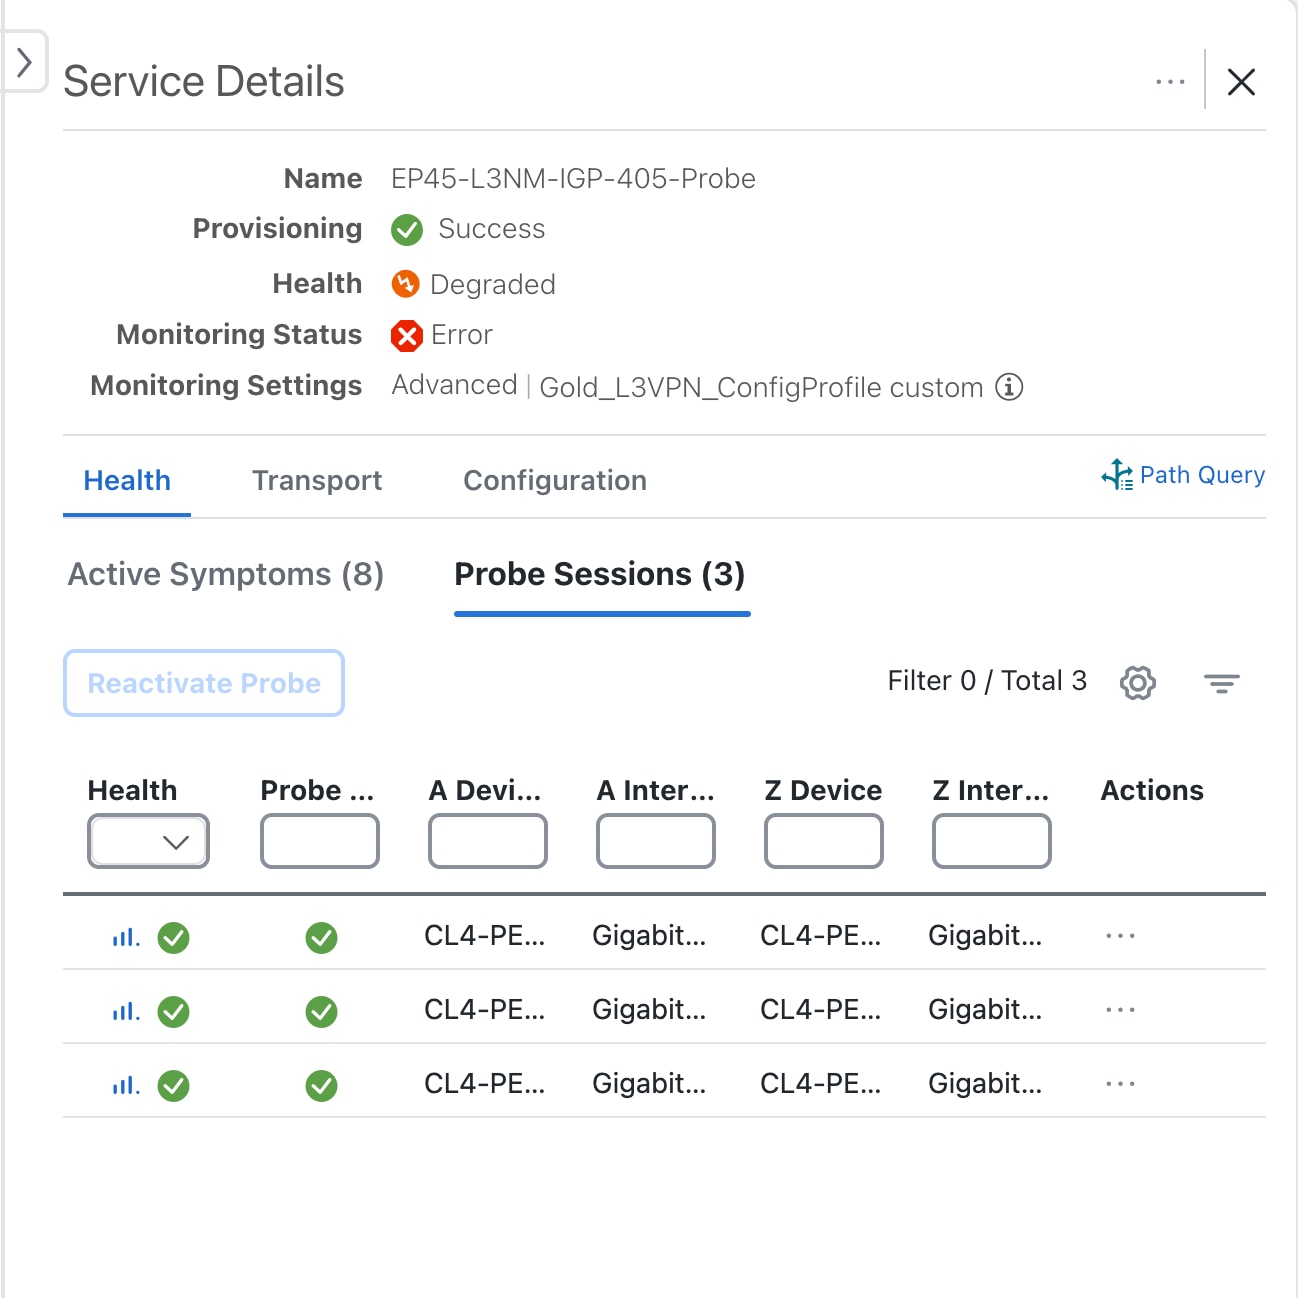
Click Start Monitoring. The Health column of the service gets updated to reflected the health of the service.
 |
What to do next
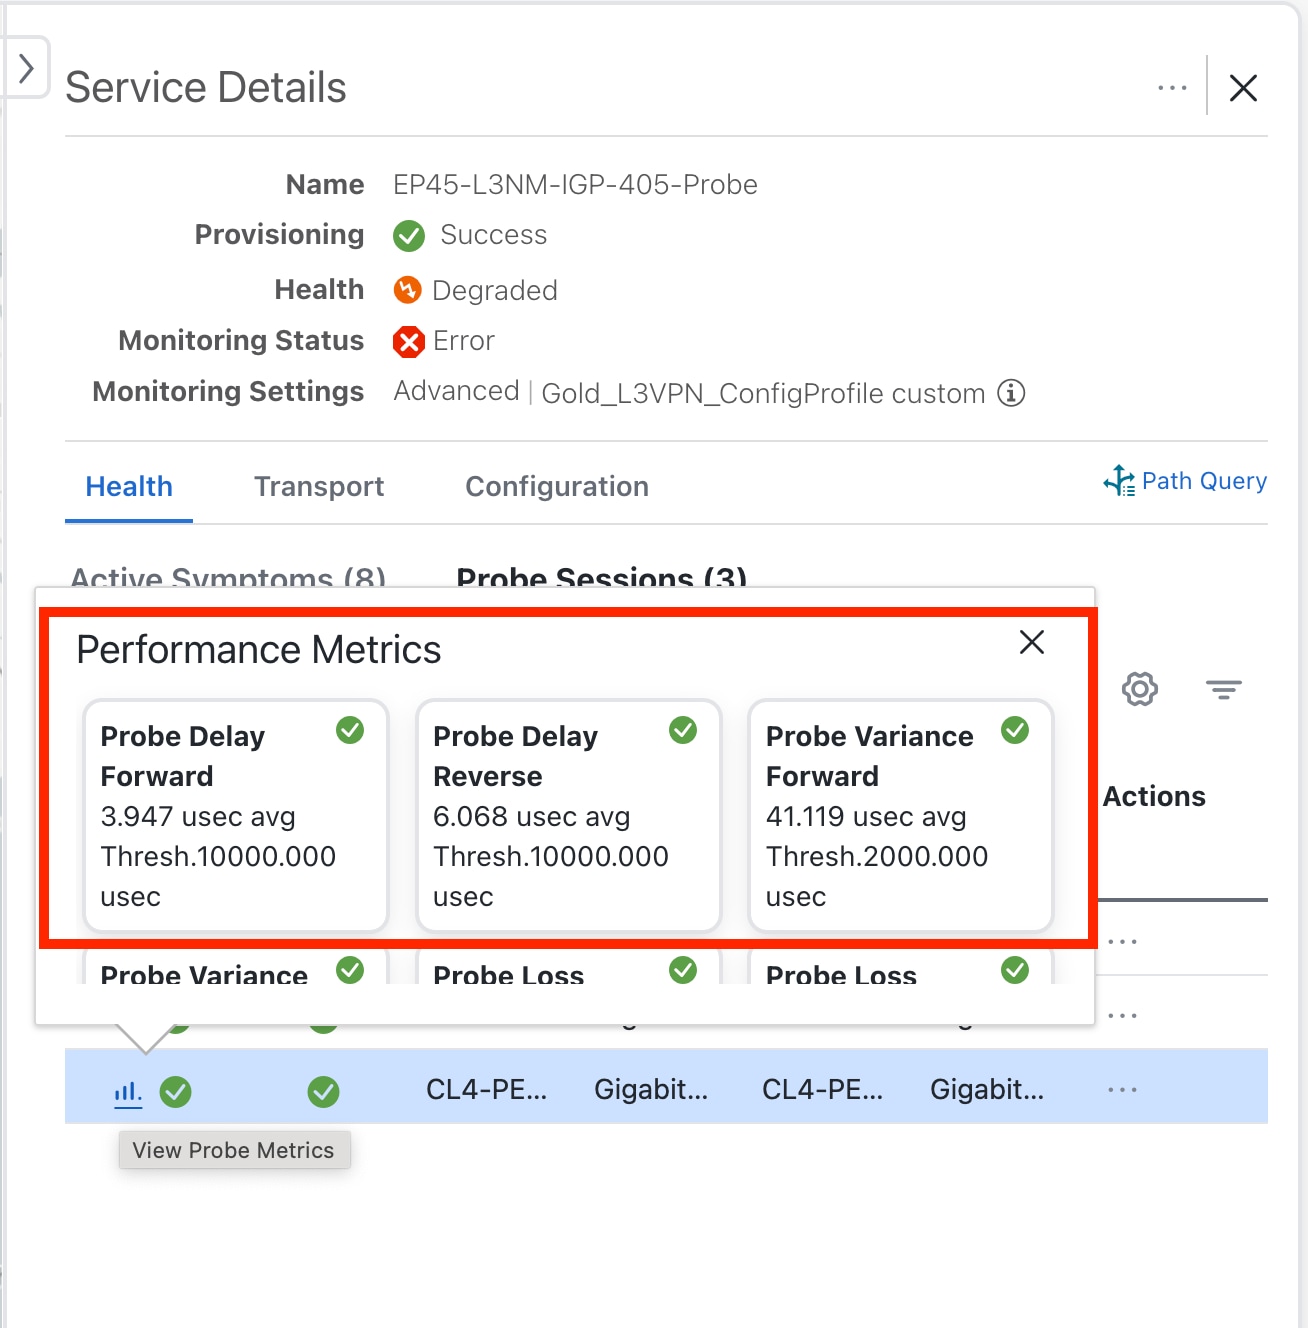
If the health of the service is Degraded, identify the root cause for service degradation and take measures to correct the issue. See Analyze Service Health for more information.

 Feedback