Overview
By using the scenario workflows described in this section, we are providing examples of how to configure the system to deliver the operator’s intended configuration. These scenarios do not fully demonstrate all of the capabilities of Crosswork Network Controller. They are intended to demonstrate the flexibility of the platform. Additional customization is possible either by leveraging the resources available on Cisco DevNet or through engagement with Cisco Customer Experience.
Objective
Provision a set of VPN services with underlay transport policies that will meet and maintain service-level agreements (SLAs) between the service provider and the customer. An SLA defines the service-delivery expectations agreed upon between the service provider and the customer. The SLA details the products or services that the provider is to deliver to the customer, the provider's point of contact to which the customer will bring service issues, and the metrics the provider and customer both use to monitor compliance with the SLA.
Challenge
The service-provider network state changes continuously and so quickly that it is difficult to track and react to network problems fast enough to avoid congestion and maintain SLA compliance. In a typical lifecycle, there is a feedback loop that traditionally requires manual monitoring and intervention, which is time- and resource-intensive.
Solution
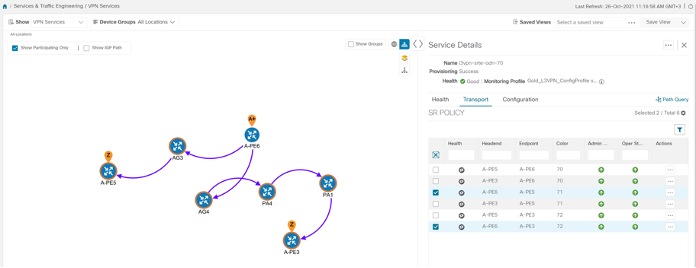
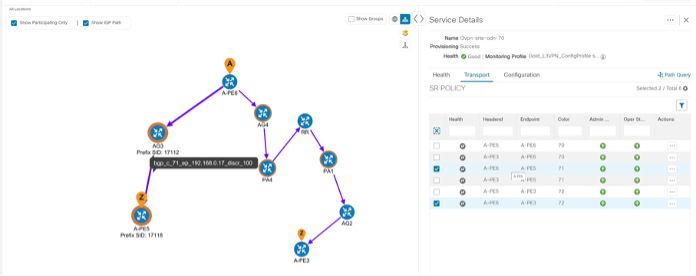
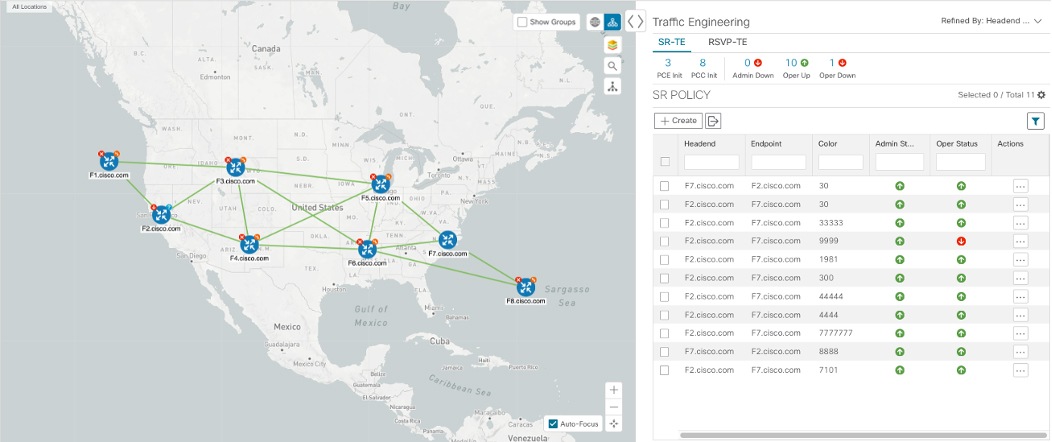
With network automation, the objective is to automate the feedback loop to enable quicker reaction to and remediation of network events. With Crosswork Network Controller, network operators can orchestrate L2VPN and L3VPN services across the transport network, via a programmable interface, in a very quick and efficient manner. Segment routing traffic engineering (SR-TE) polices can be configured to continuously track network changes and automatically react to optimize the network. These SR-TE polices can serve as the underlay configuration for the VPN services to automatically maintain the SLAs.
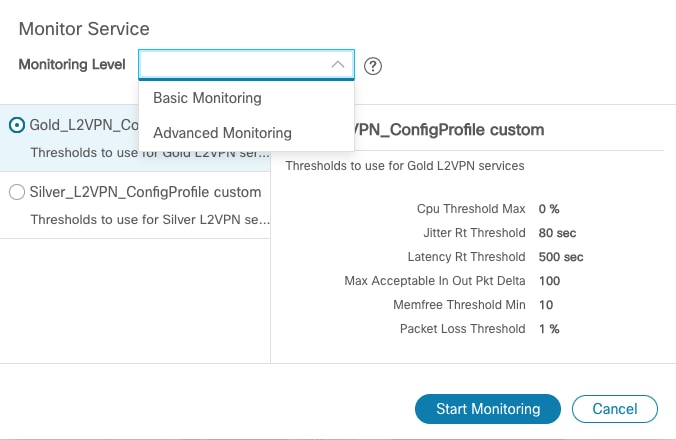
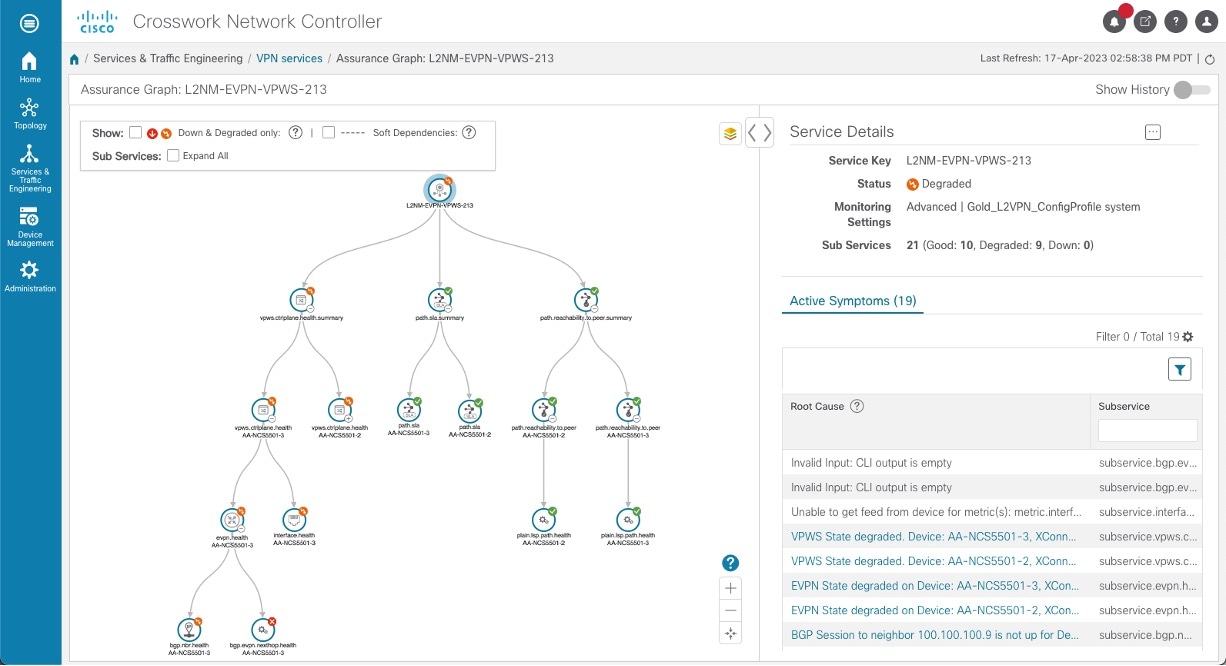
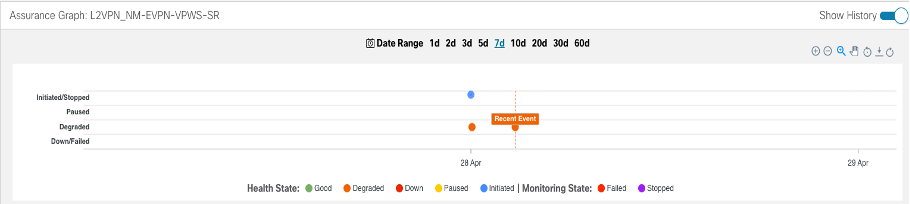
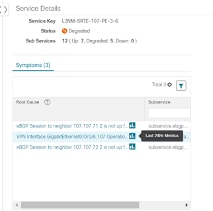
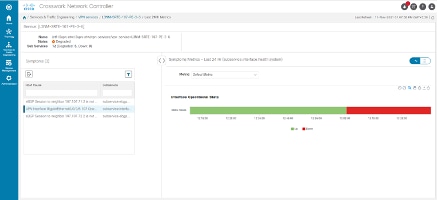
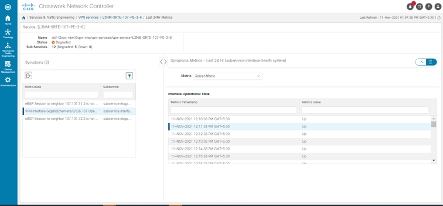
The services required for this solution can be created and managed using the Crosswork Network Controller UI. L2/L3 VPN Yang model-based service intents are implemented using the Cisco Network Services Orchestrator sample function packs, which provide sample service models that can be extended and fine-tuned to meet customer needs. Optionally, Service Health monitoring can be enabled to see which services are working as provisioned, if issues have been flagged, and what symptoms are detailed so to quickly address and fix.
 Note |
The Network Services Orchestrator sample function packs are provided as a starting point for VPN service provisioning functionality in Crosswork Network Controller. While the samples can be used “as is” in some limited network configurations, they are intended to demonstrate the extensible design of Crosswork Network Controller. Answers to common questions can be found on Cisco Devnet and Cisco Customer Experience can provide answers to general questions about the samples. Support for customization of the samples for your specific use cases can be arranged through your Cisco account team. |
How Does it Work?
-
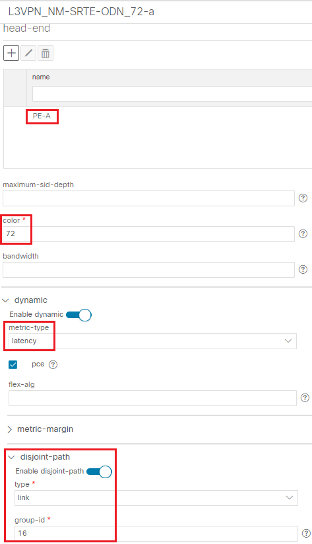
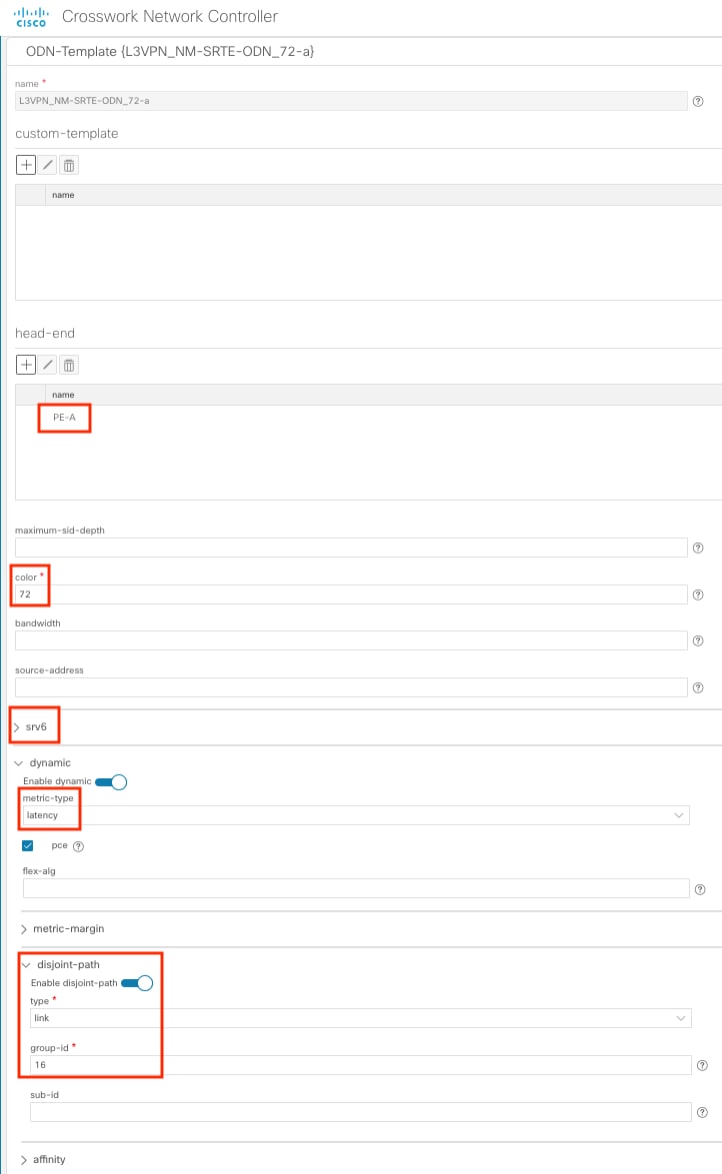
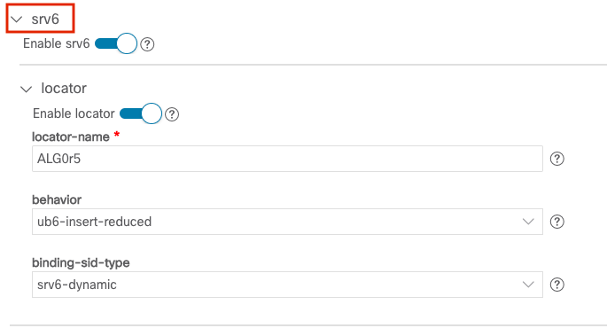
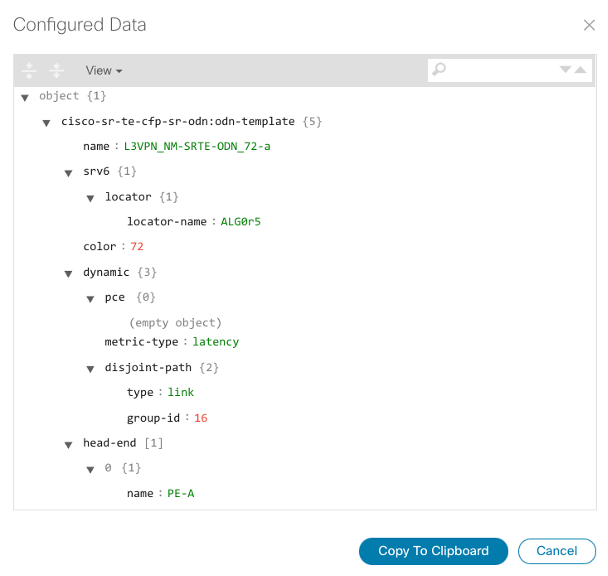
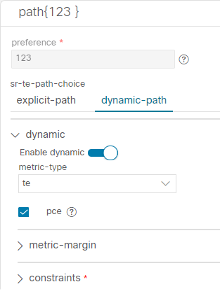
User creates an SR-TE policy/On-Demand Next Hop (ODN) template with intent (e.g., bandwidth, latency) using the Cisco Crosswork Network Controller UI or APIs.
-
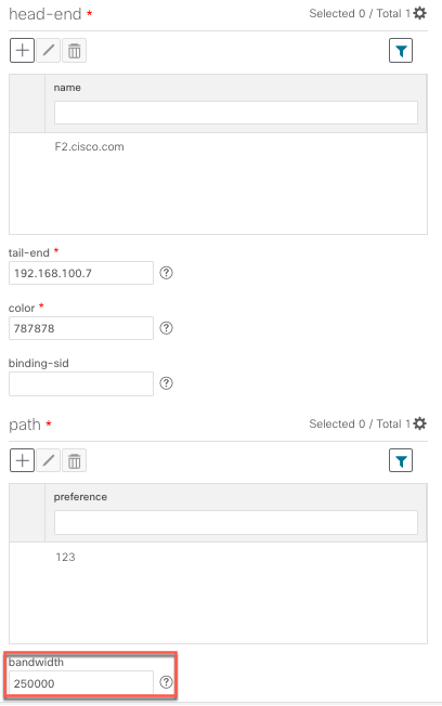
User creates a VPN service using the UI or APIs and specifies the following:
-
The endpoints participating in the VPN
-
Other required VPN parameters
-
The SR-TE policy/ODN template that is to be associated with the VPN service
-
-
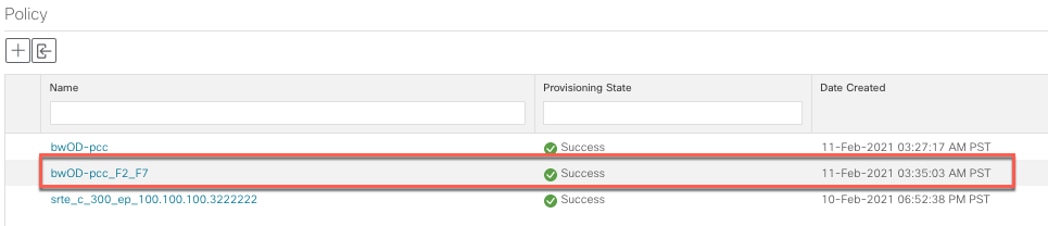
During the provisioning process for the above steps, Cisco Network Services Orchestrator configures the SR-TE policy and the VPN service on the specified endpoints.
-
When the service is active, the network interacts with the SR-PCE to dynamically program the path that meets the intent in the configured SR-TE policy/ODN template. The headend device requests a path from the SR-PCE via PCEP (for dynamic SR-TE policies). If the request specifies bandwidth, the SR-PCE gets the path from Cisco Crosswork Optimization Engine.
-
The SR-PCE sends the path to the headend device via PCEP and updates the headend if path changes are required.
Usage Scenarios
We will walk you through the following usage scenarios that illustrate the execution of the orchestrated service provisioning use case using the Cisco Crosswork Network Controller UI:
-
Scenario 1 – Implement and Maintain SLA for an L3VPN Service for SR-MPLS (using ODN)
-
Scenario 2 – Implement and Maintain SLA for an L3VPN Service for SRv6 (using ODN)
-
Scenario 3 – Mandate a Static Path for an EVPN-VPWS Service using an Explicit SR-TE policy
-
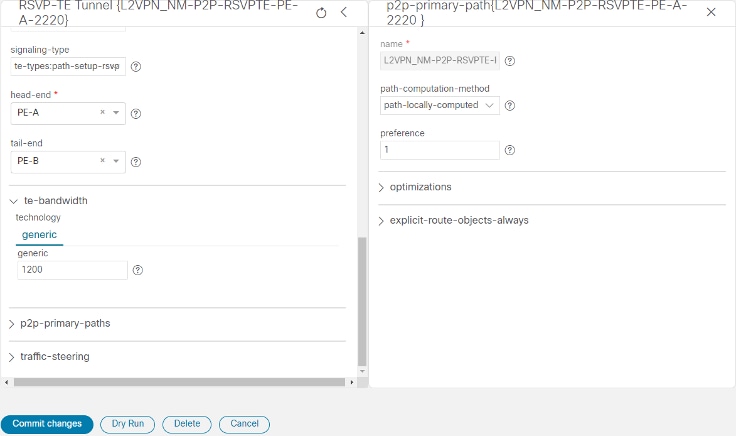
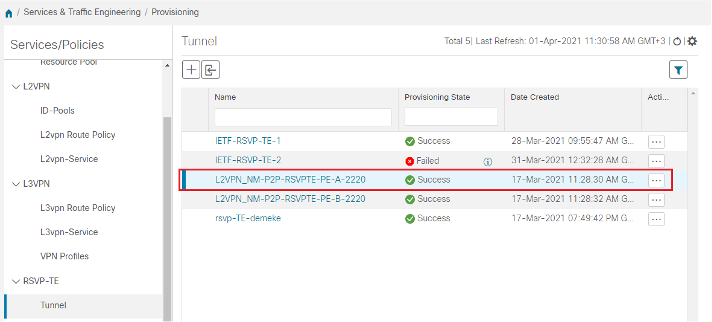
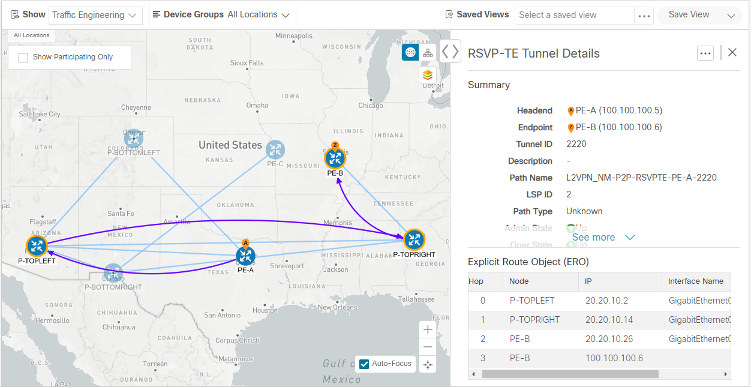
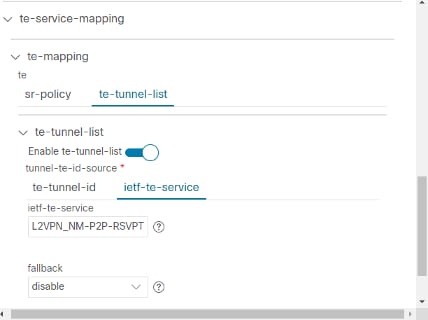
Scenario 4 – Provision an L2VPN service over an RSVP-TE tunnel with reserved bandwidth
-
Scenario 5 – Provision a Soft Bandwidth Guarantee with Optimization Constraints
Additional Resources

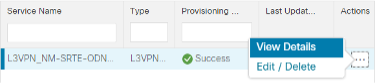

 button above the table .


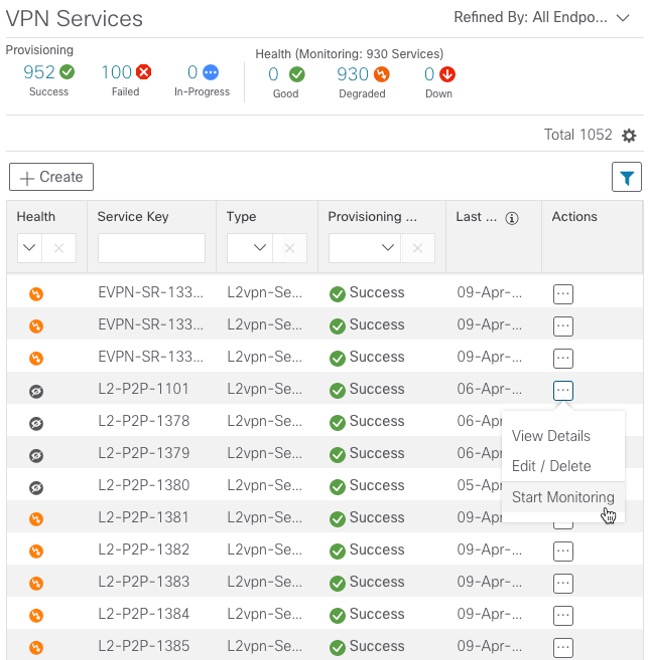
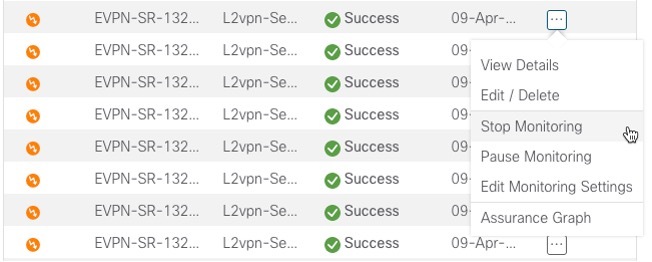
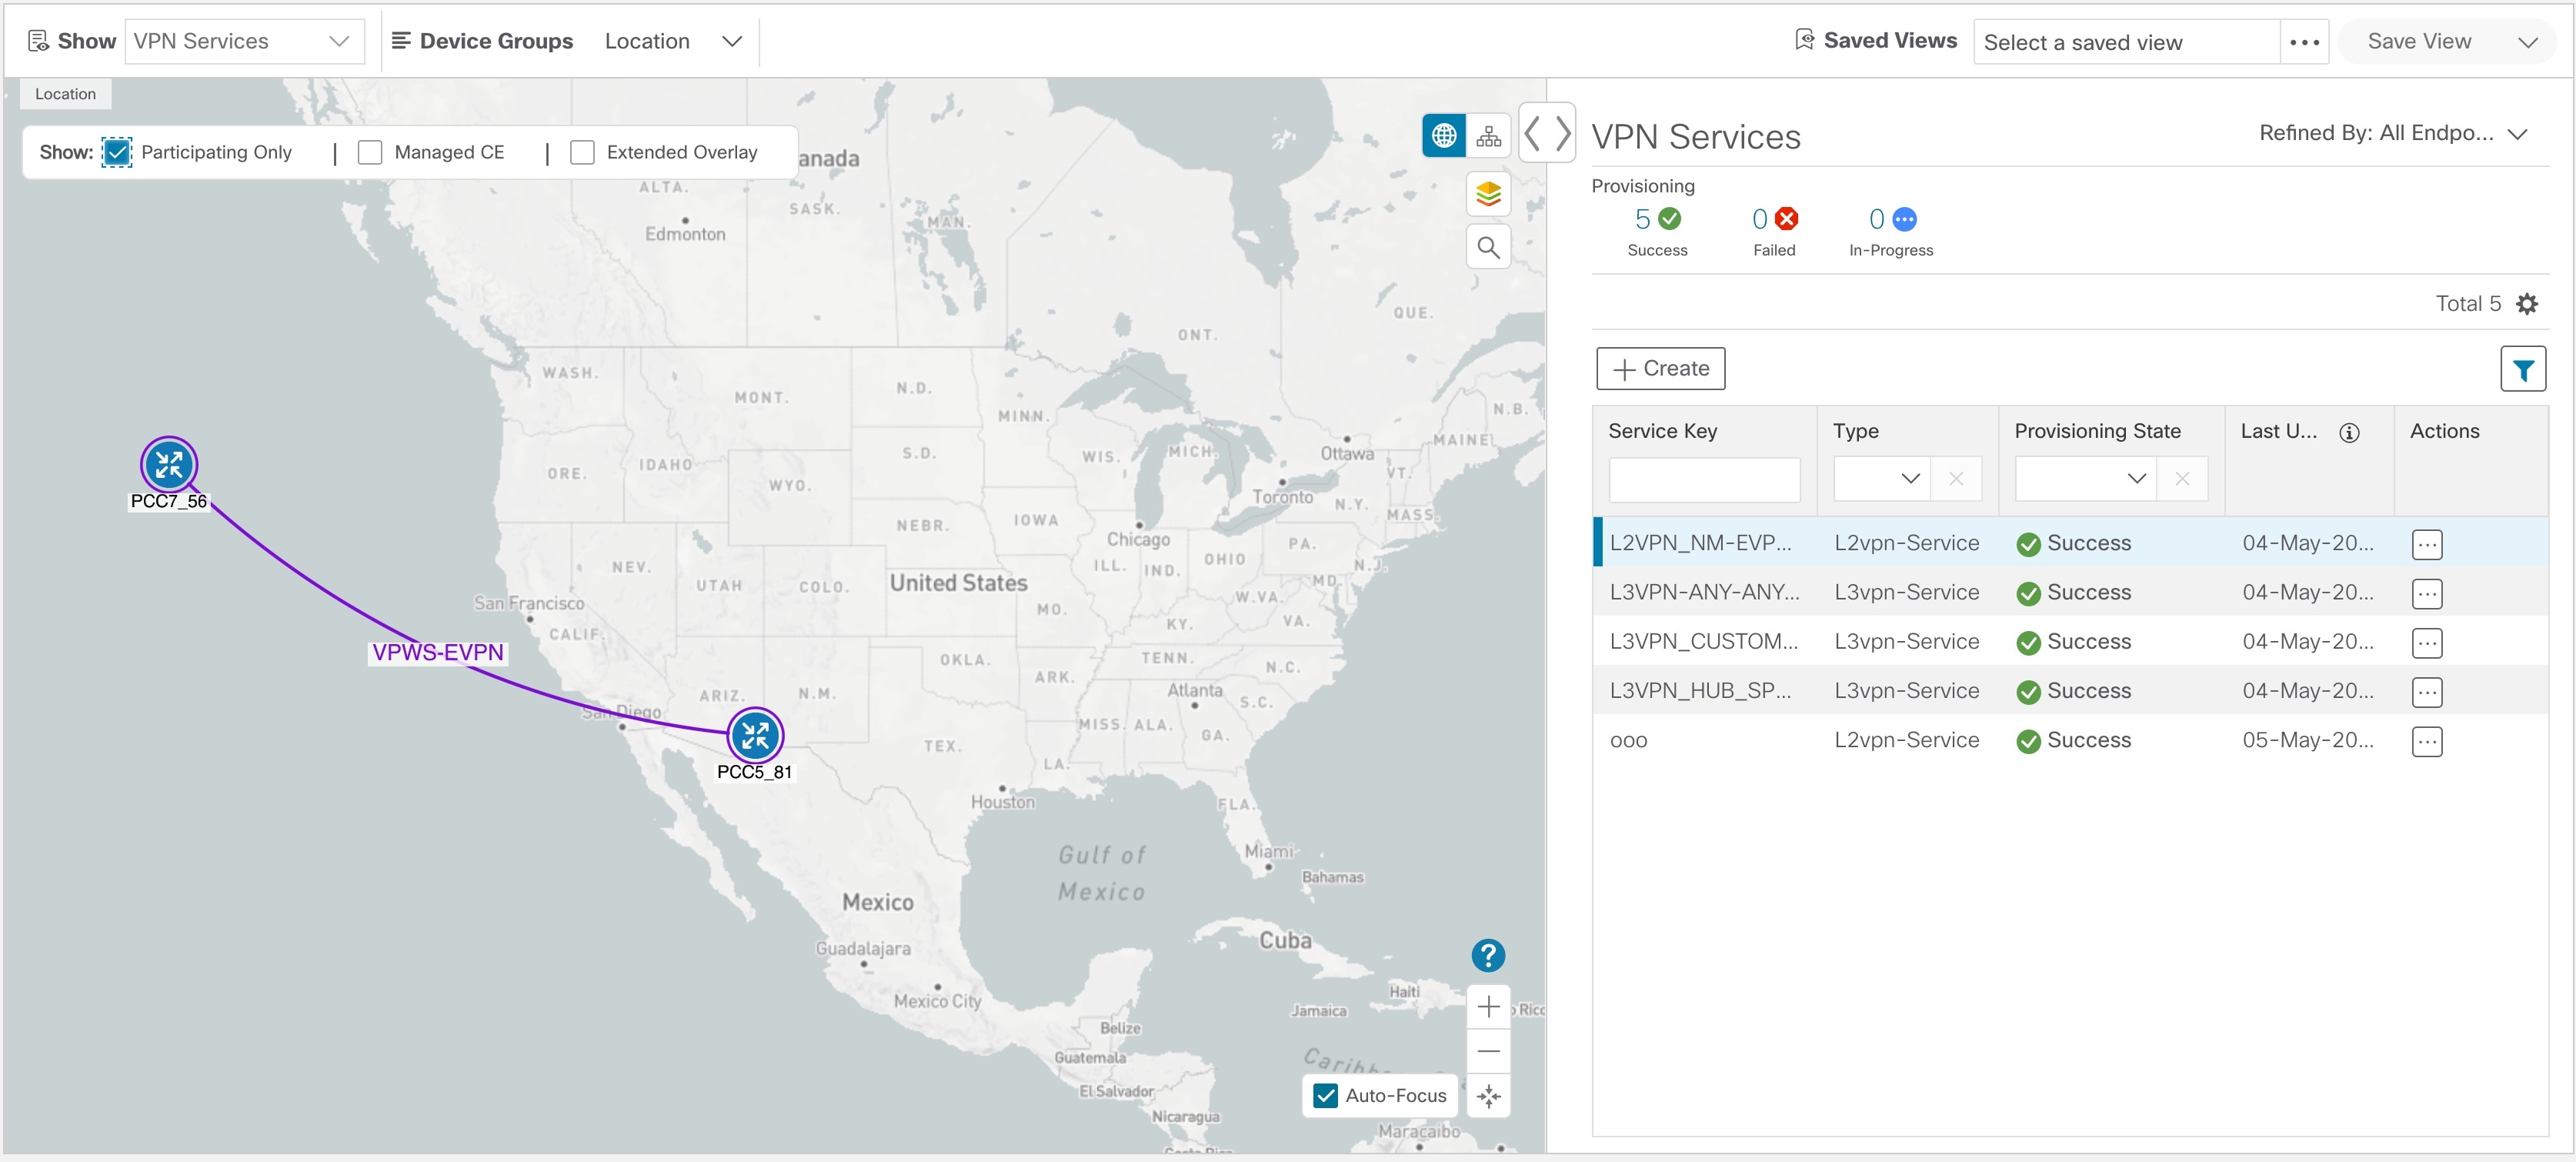
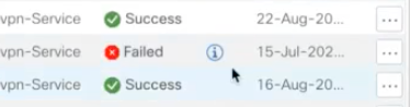
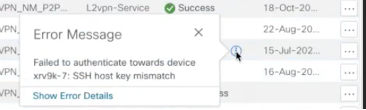
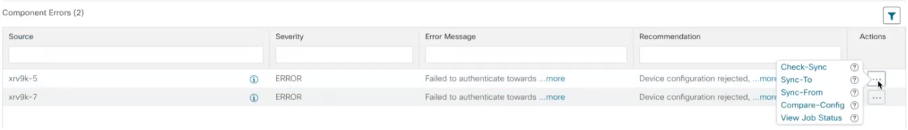
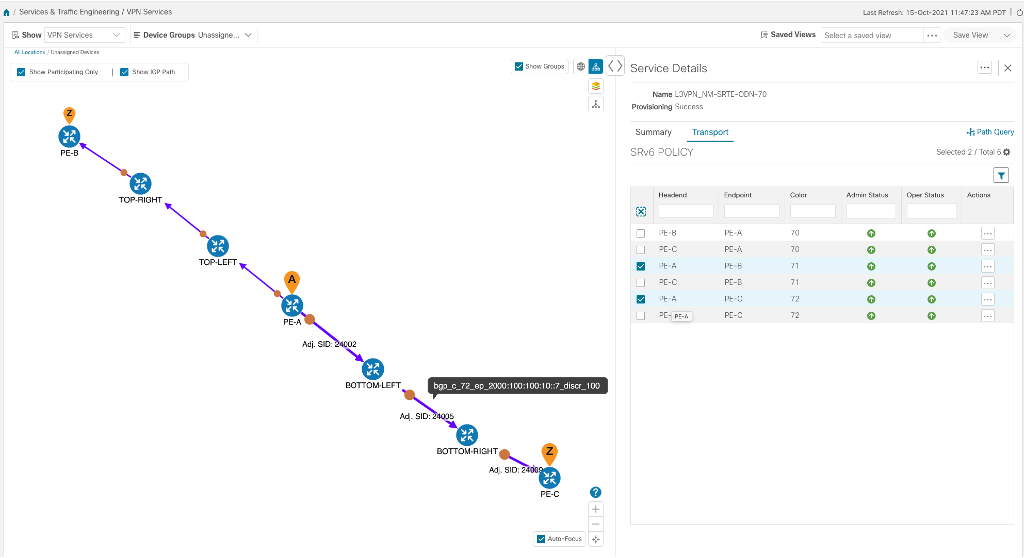
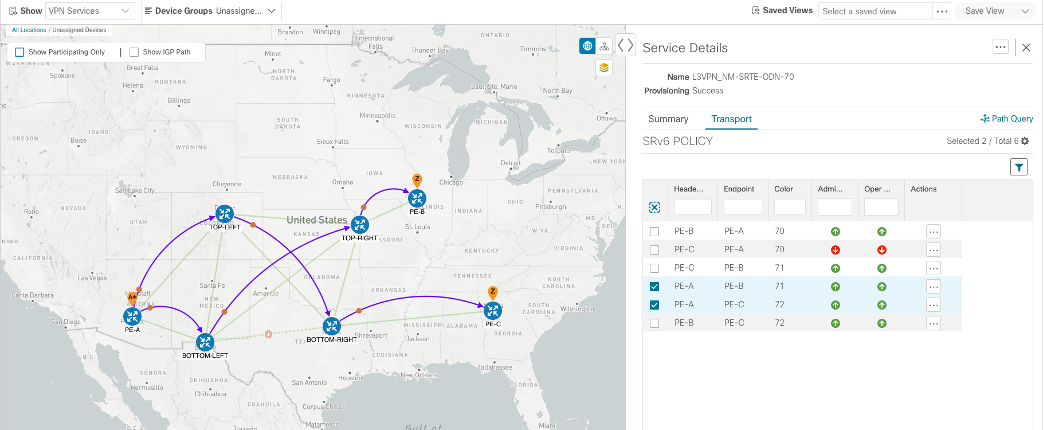
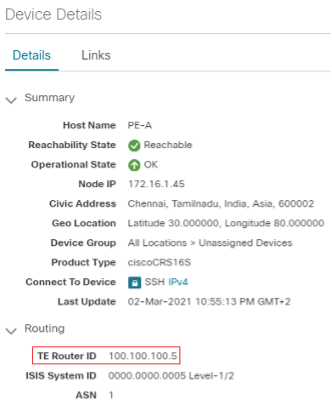
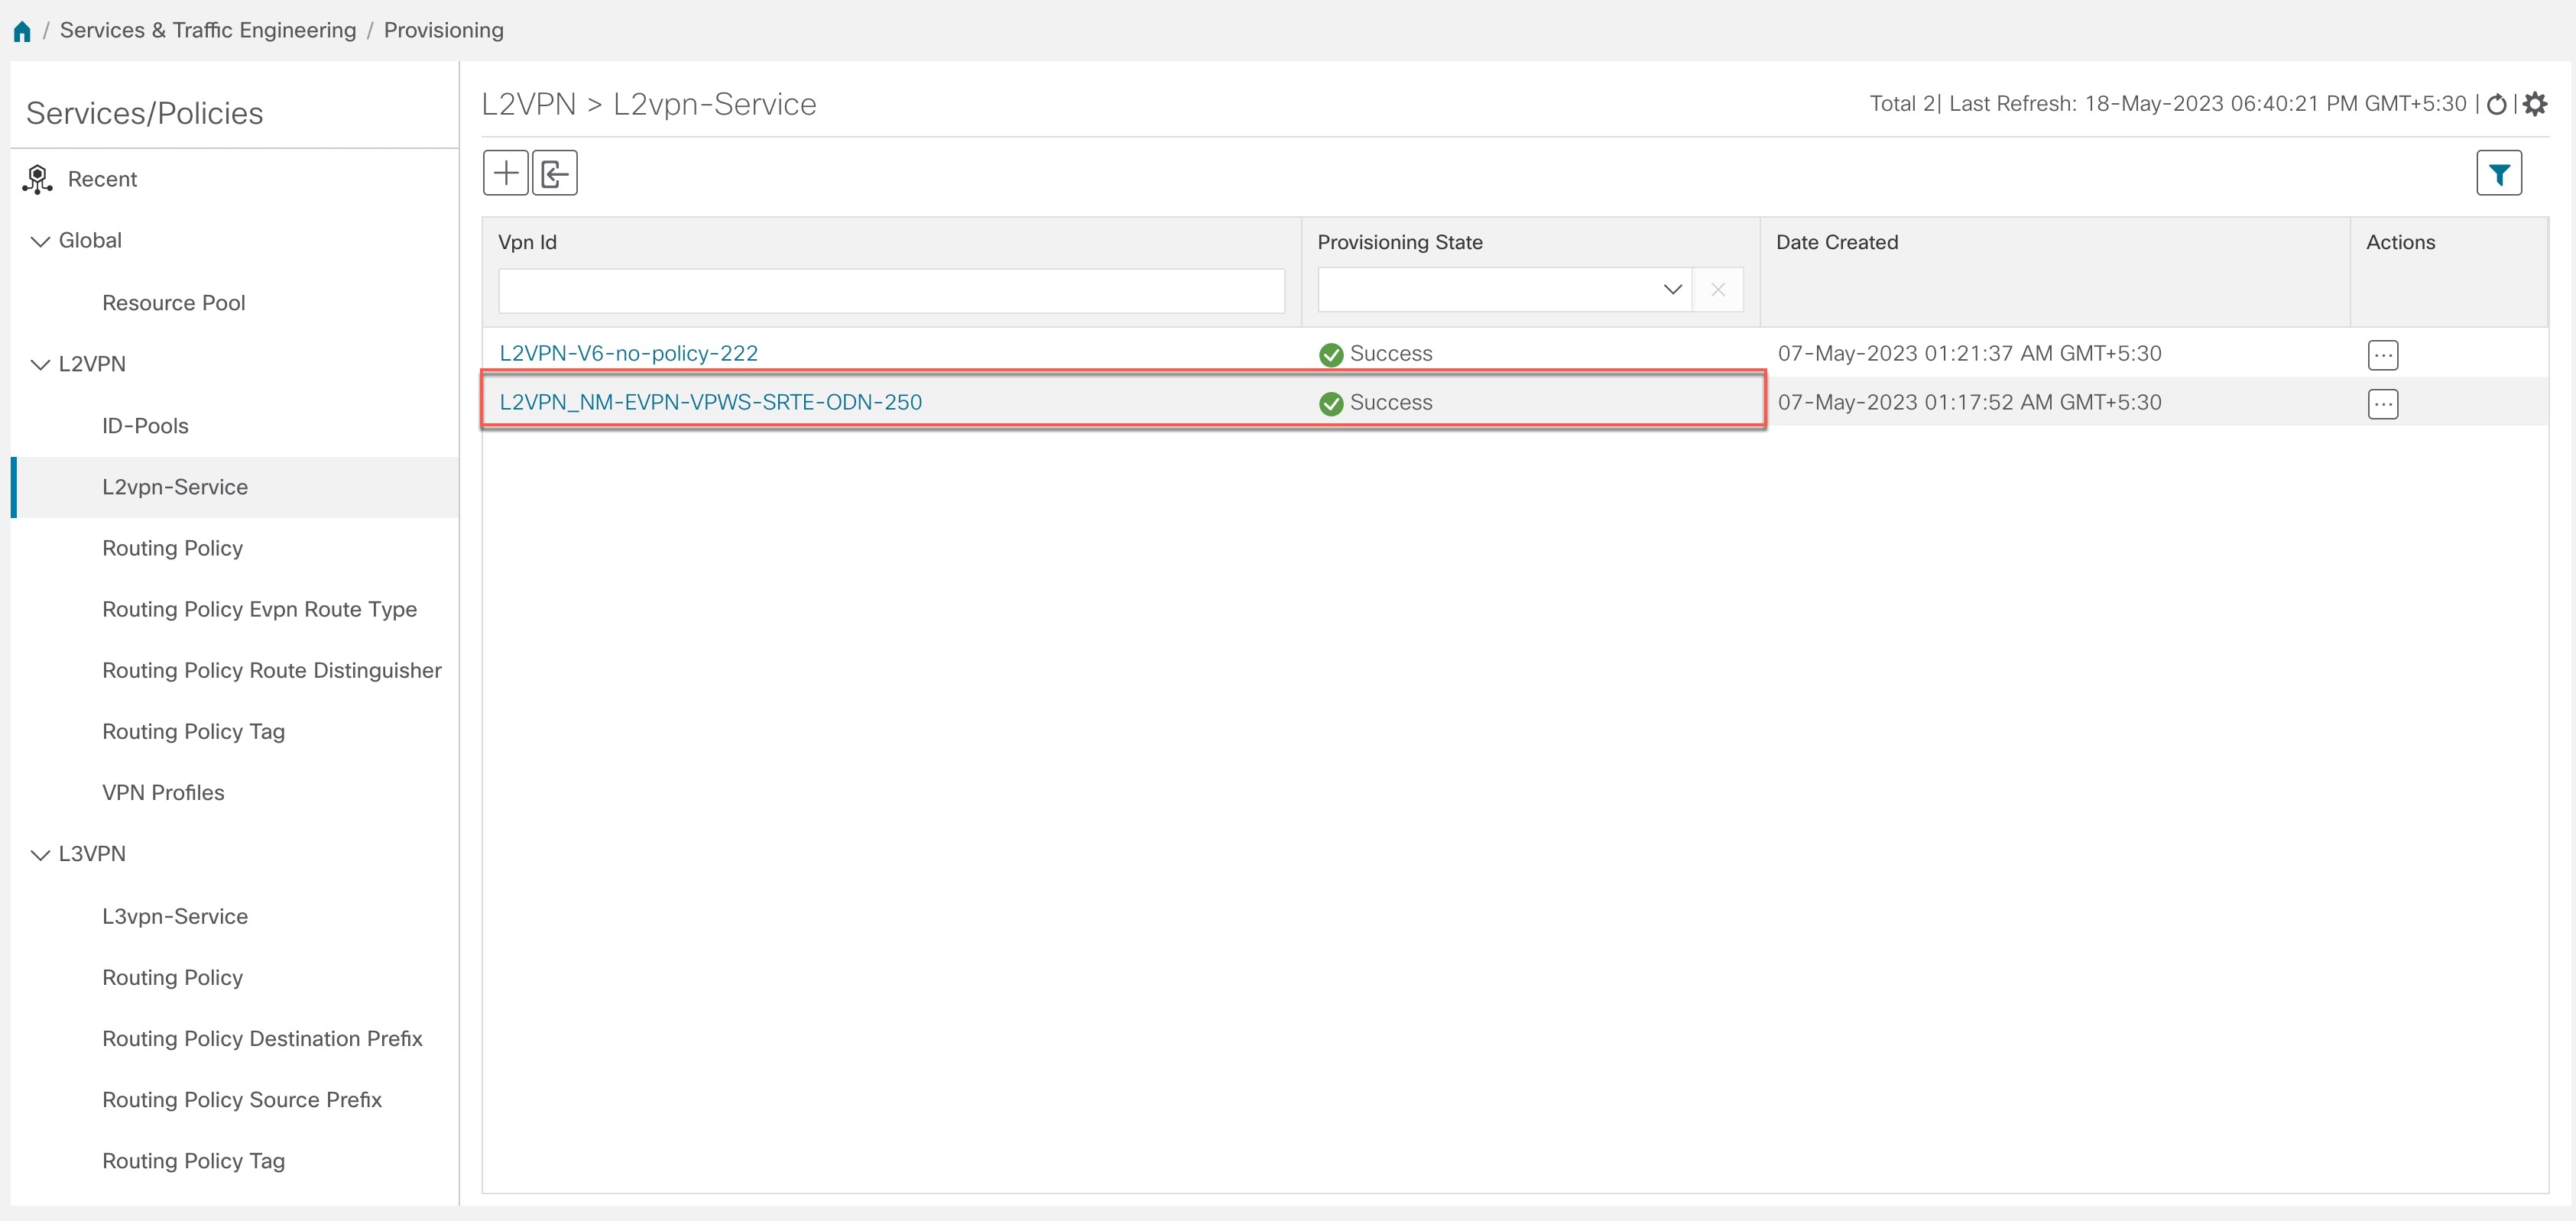
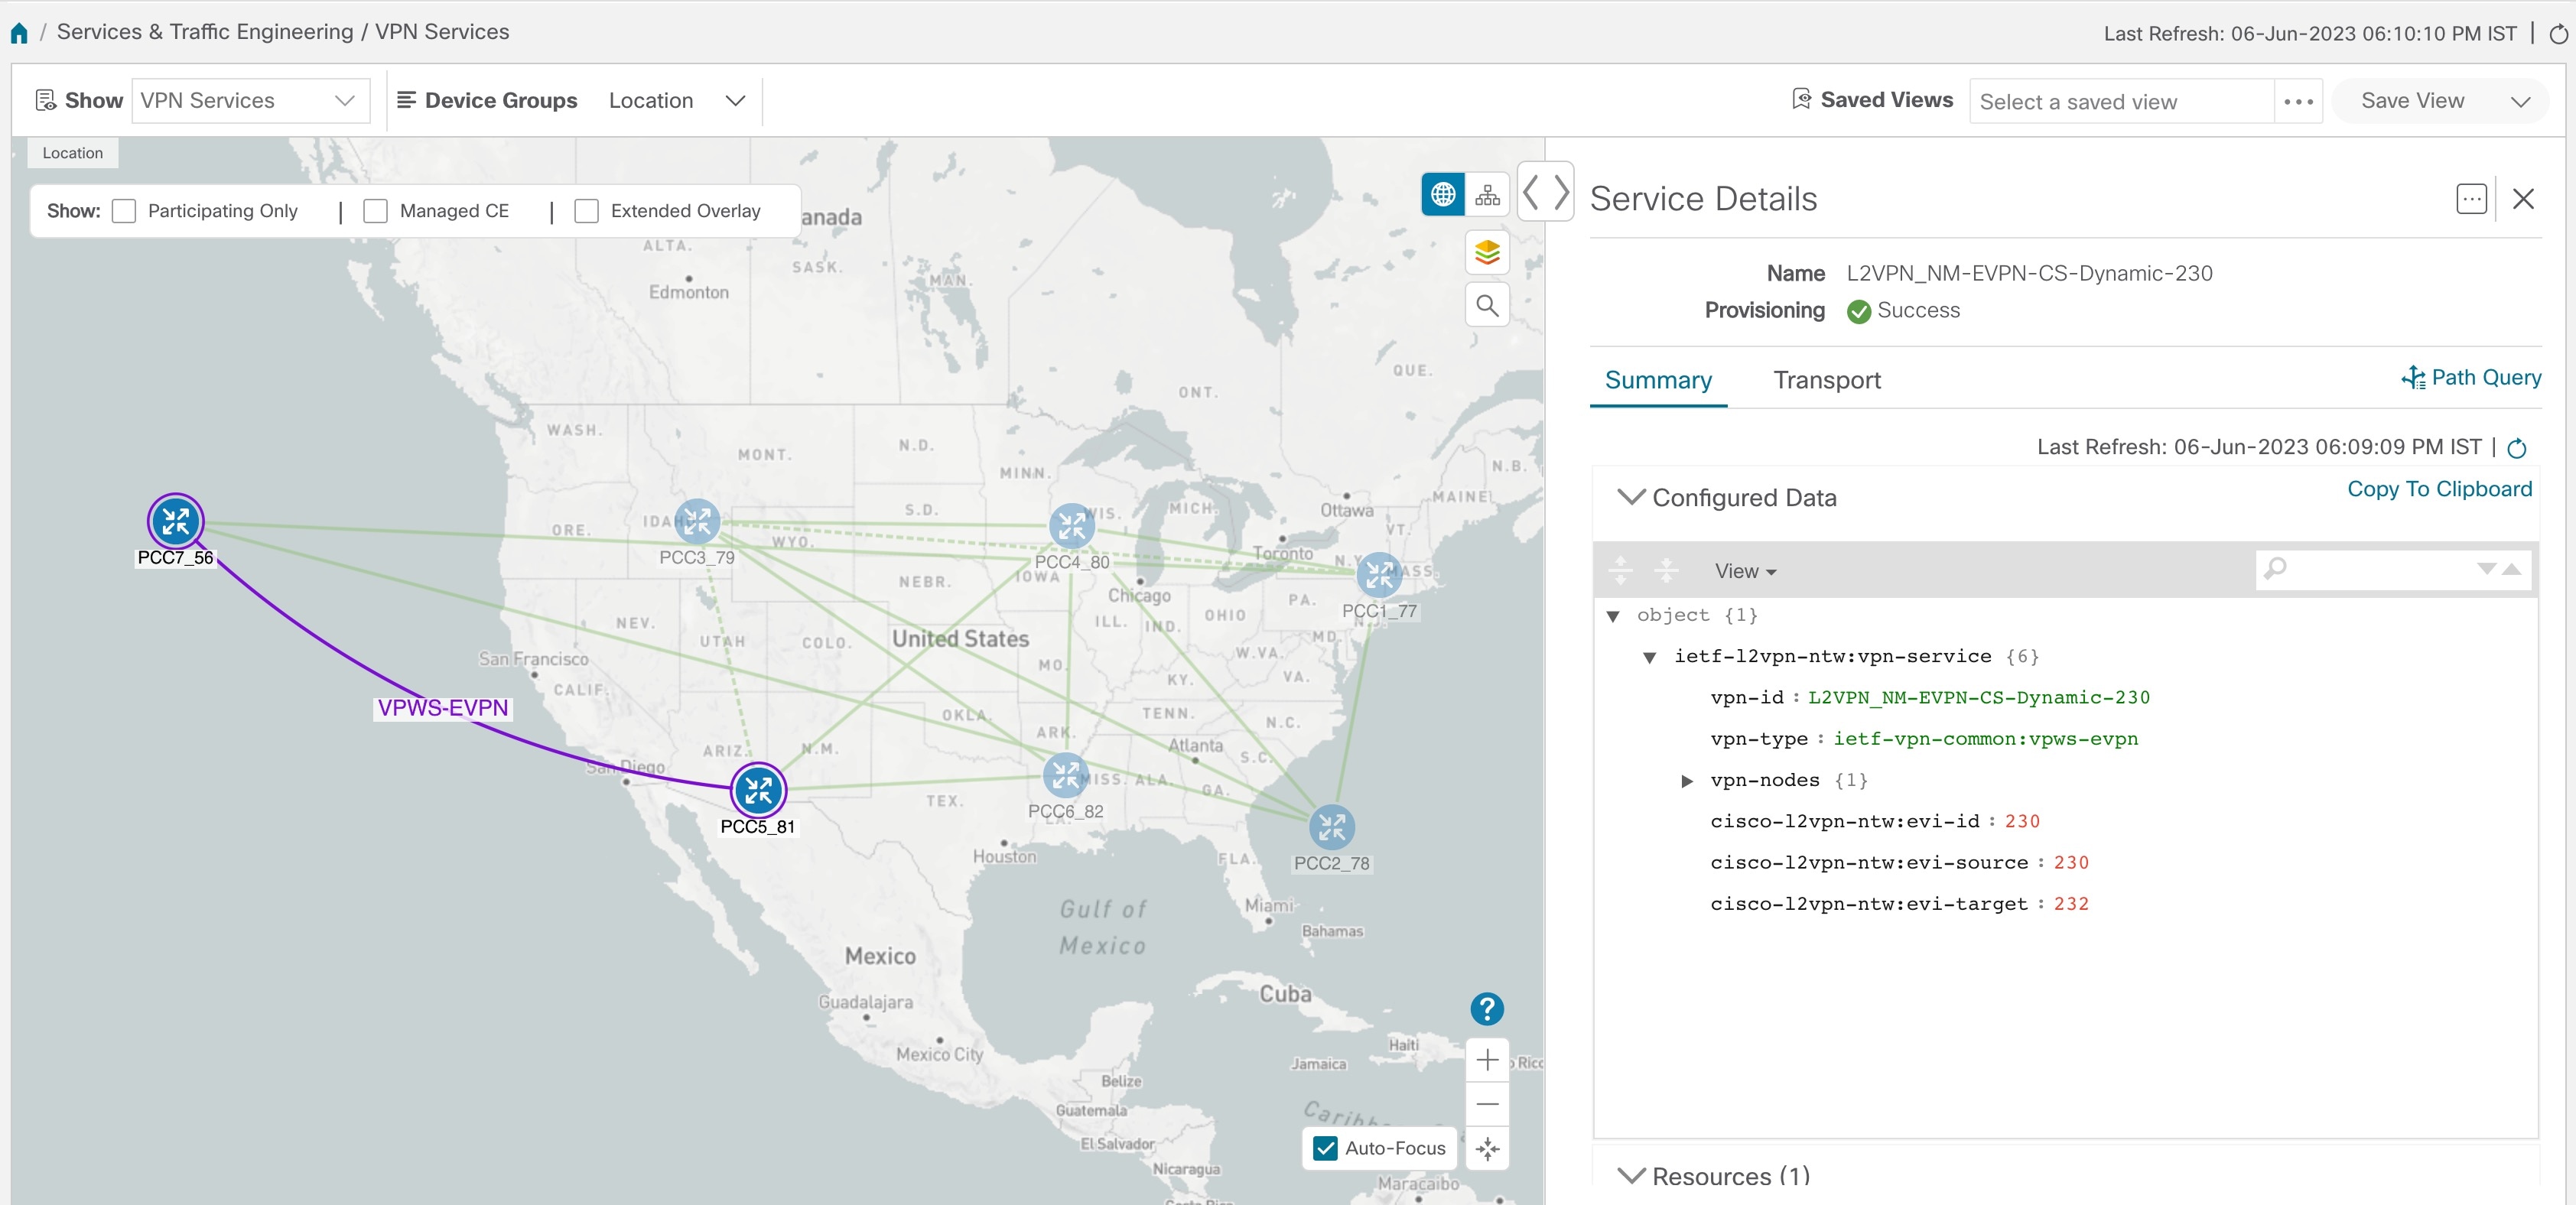
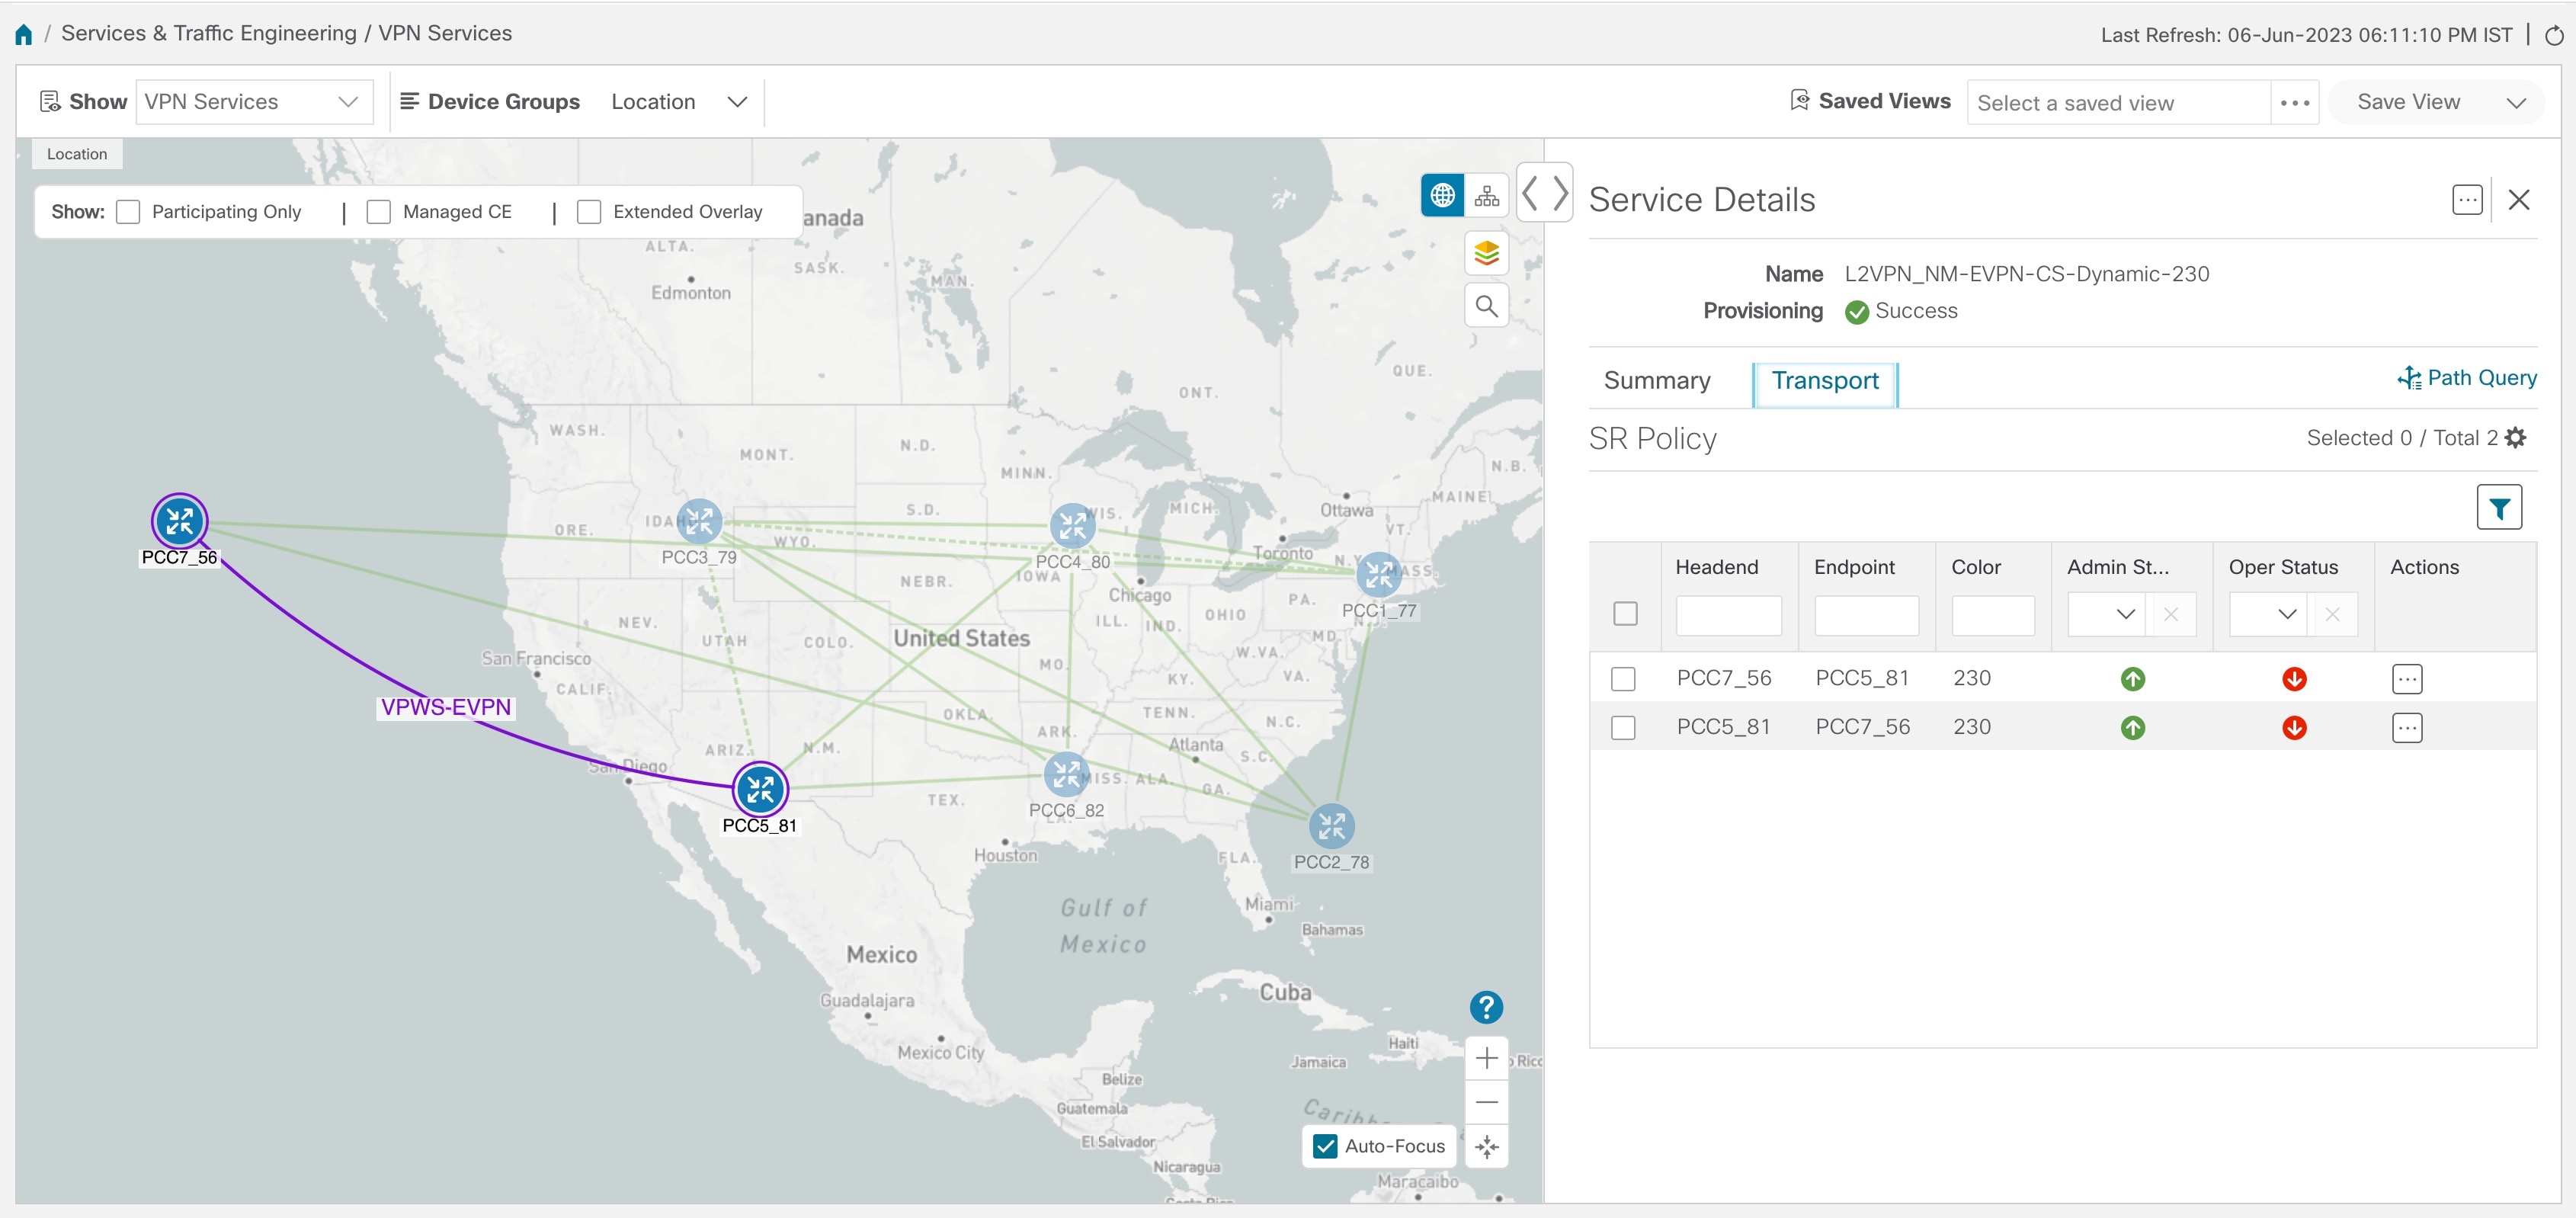
 Services & Traffic Engineering > VPN Services.
 Feedback