Set Up and Use Your Topology Map for Network Visualization

Overview of the Topology Map

You can view the network devices and their connections in different ways on the topology map.

You can choose between a logical map or a geographical map, depending on your preference. The logical map arranges the devices and links based on an algorithm that you can modify, without considering their physical location. The geographical map places the devices, clusters, links, and tunnels on a world map, using the GPS coordinates of each device from the device inventory.

To use the topology map, you have to onboard the devices on the system first, for more information refer to Add Devices to the Inventory.

You can also filter your topology view by creating device groups. For more information, refer to Use Device Groups to Filter your Topology Map.

For information on managing your devices and inventory, viewing interface details, and performing actions such as inventory synchronization, refer to the Cisco Crosswork Network Controller 7.0 Device Lifecycle Management guide.

Figure 1. Topology Home page
Callout No. Description

1

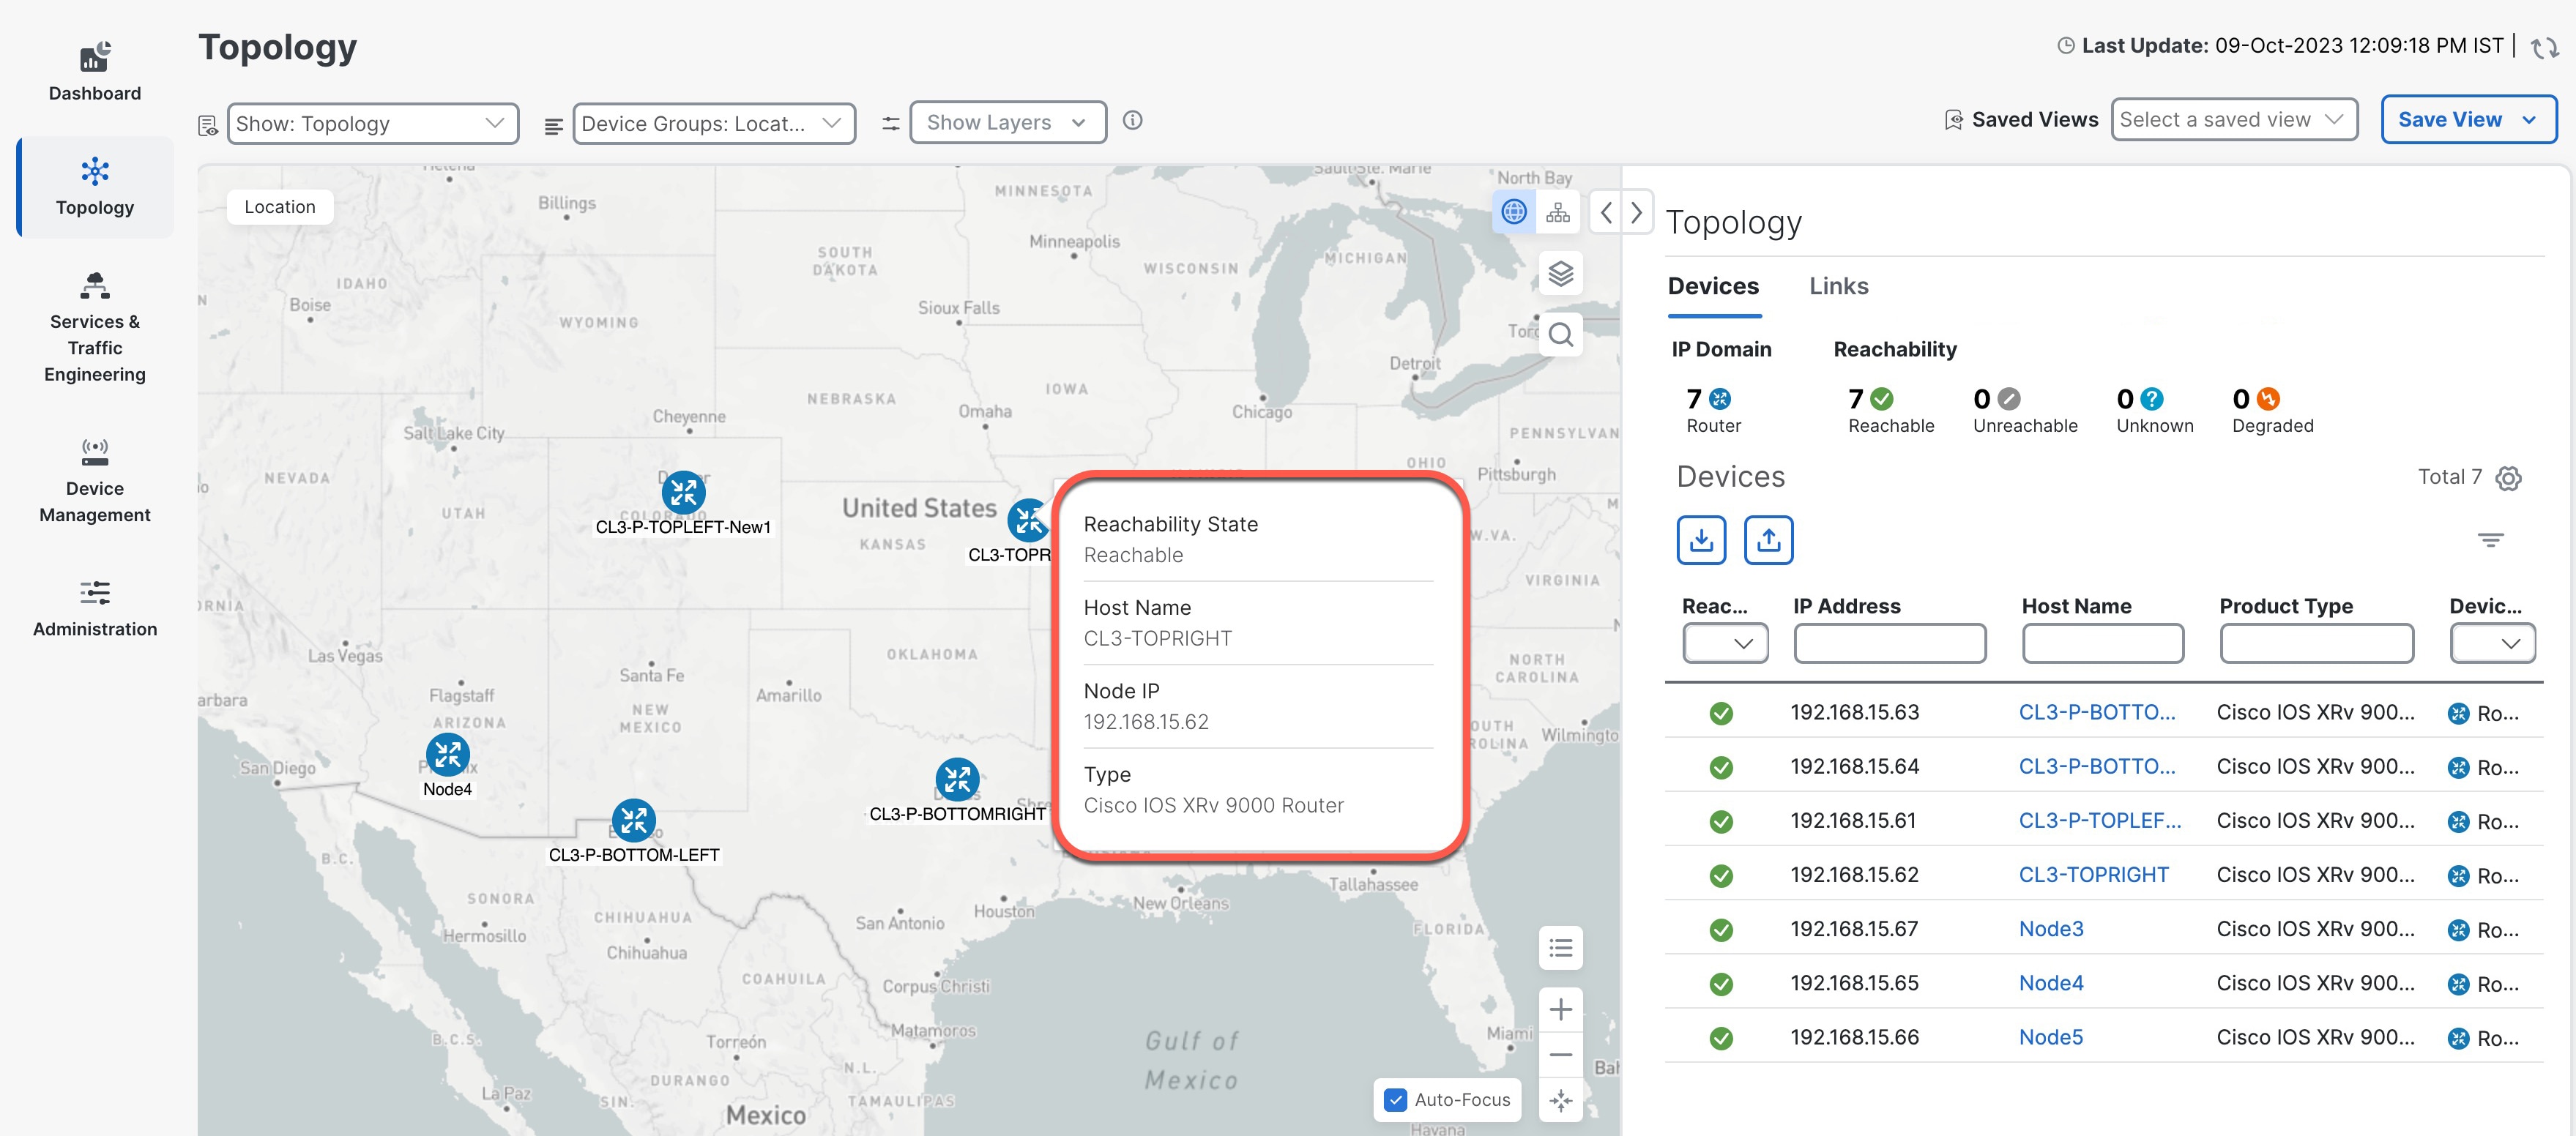
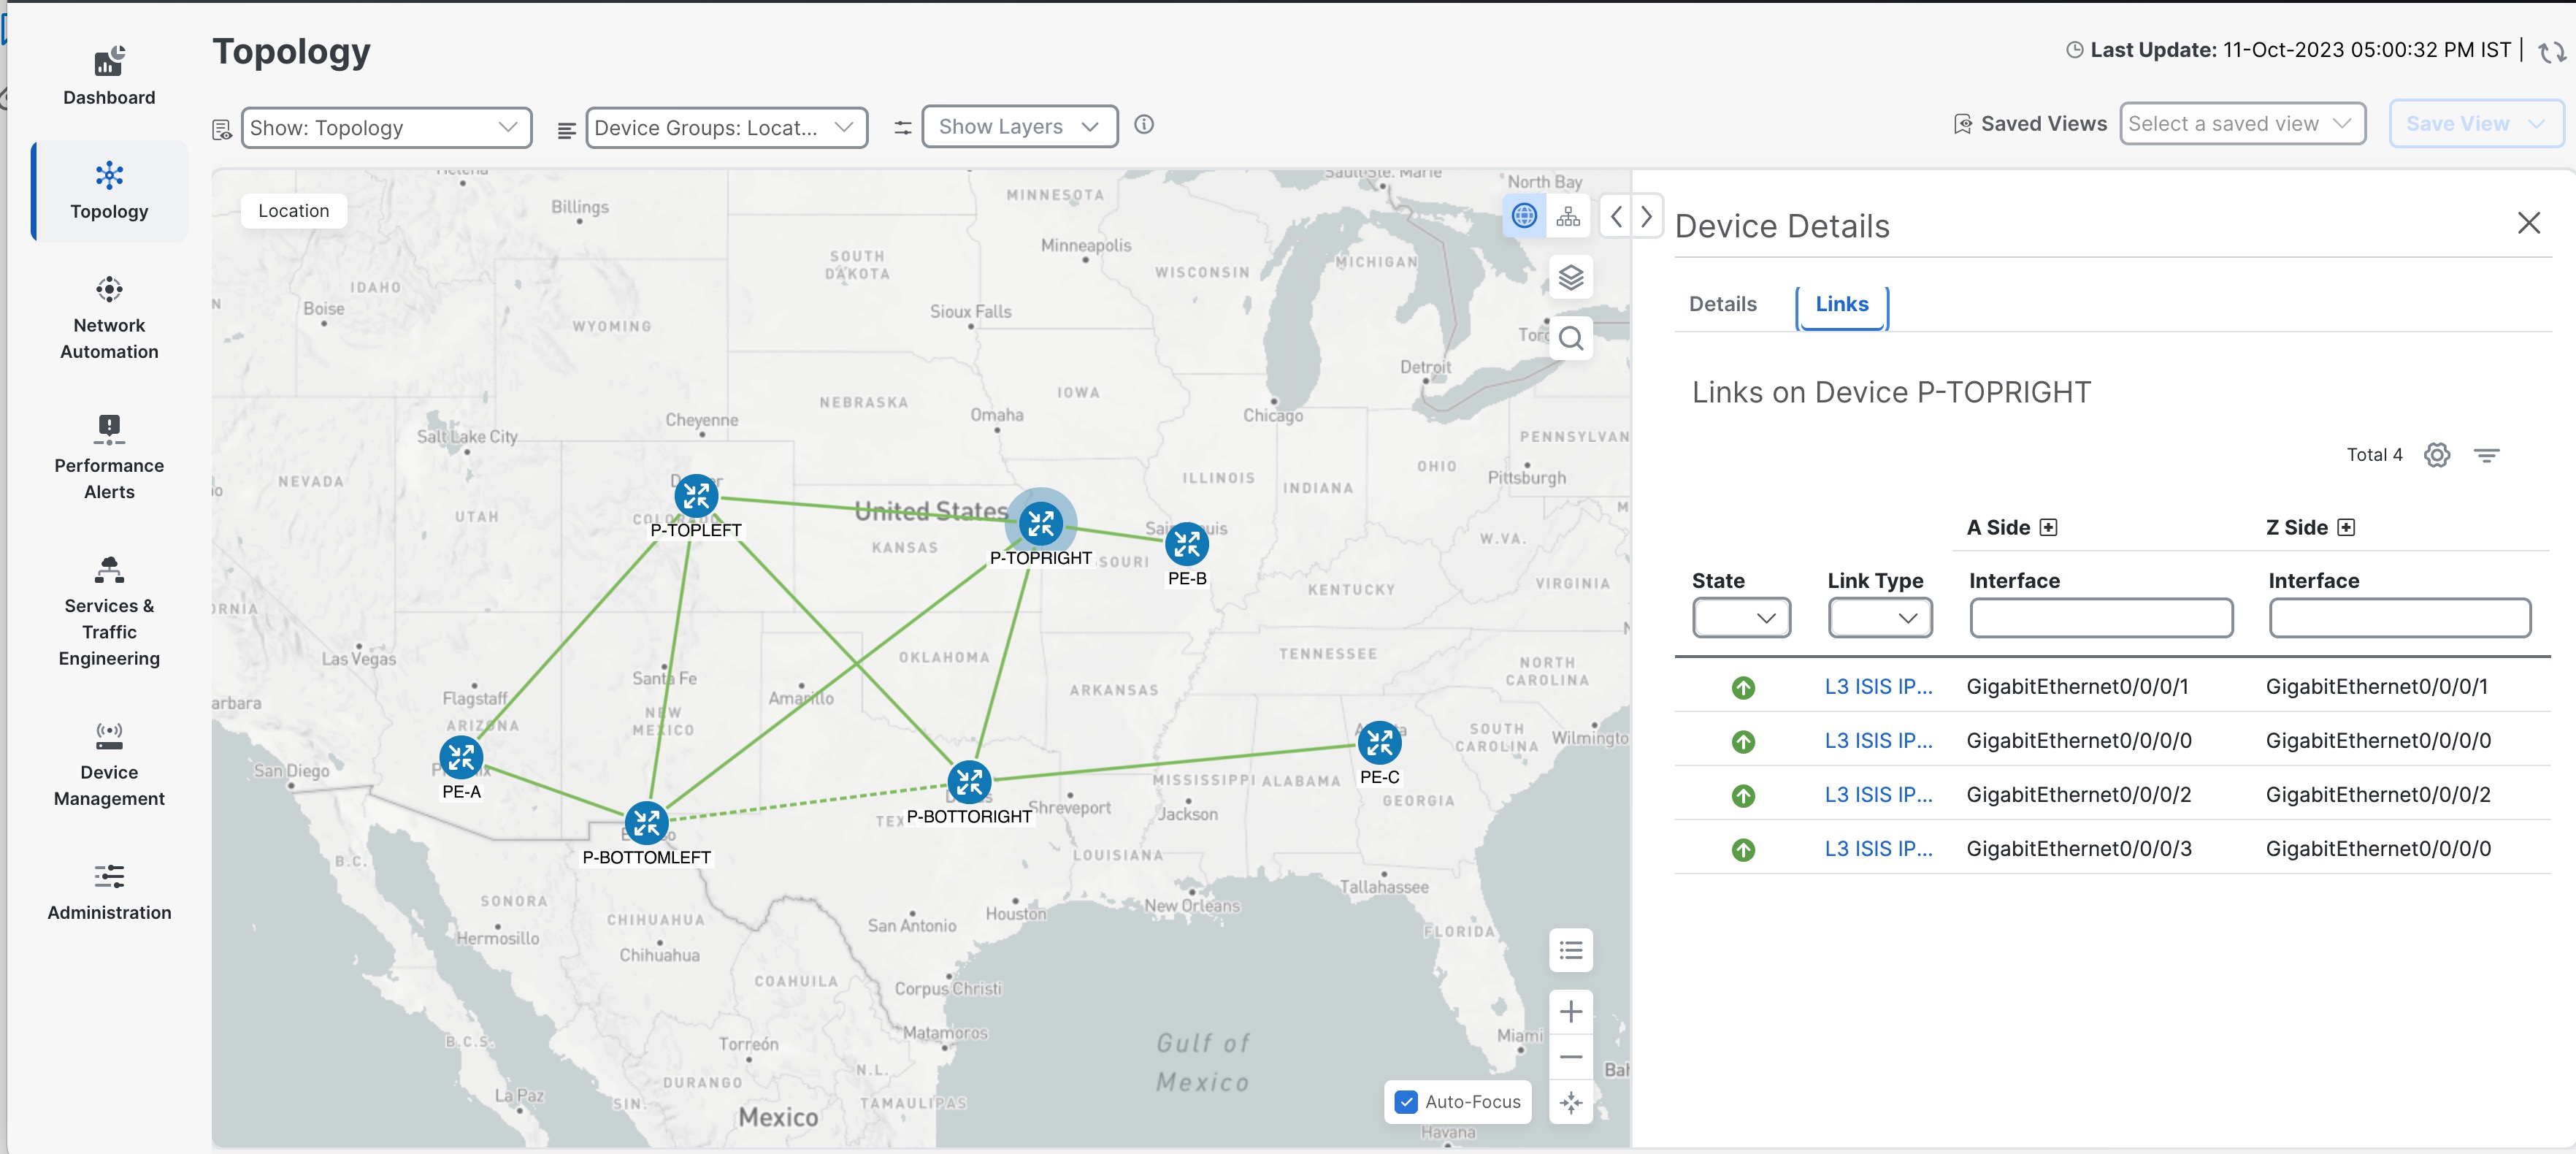
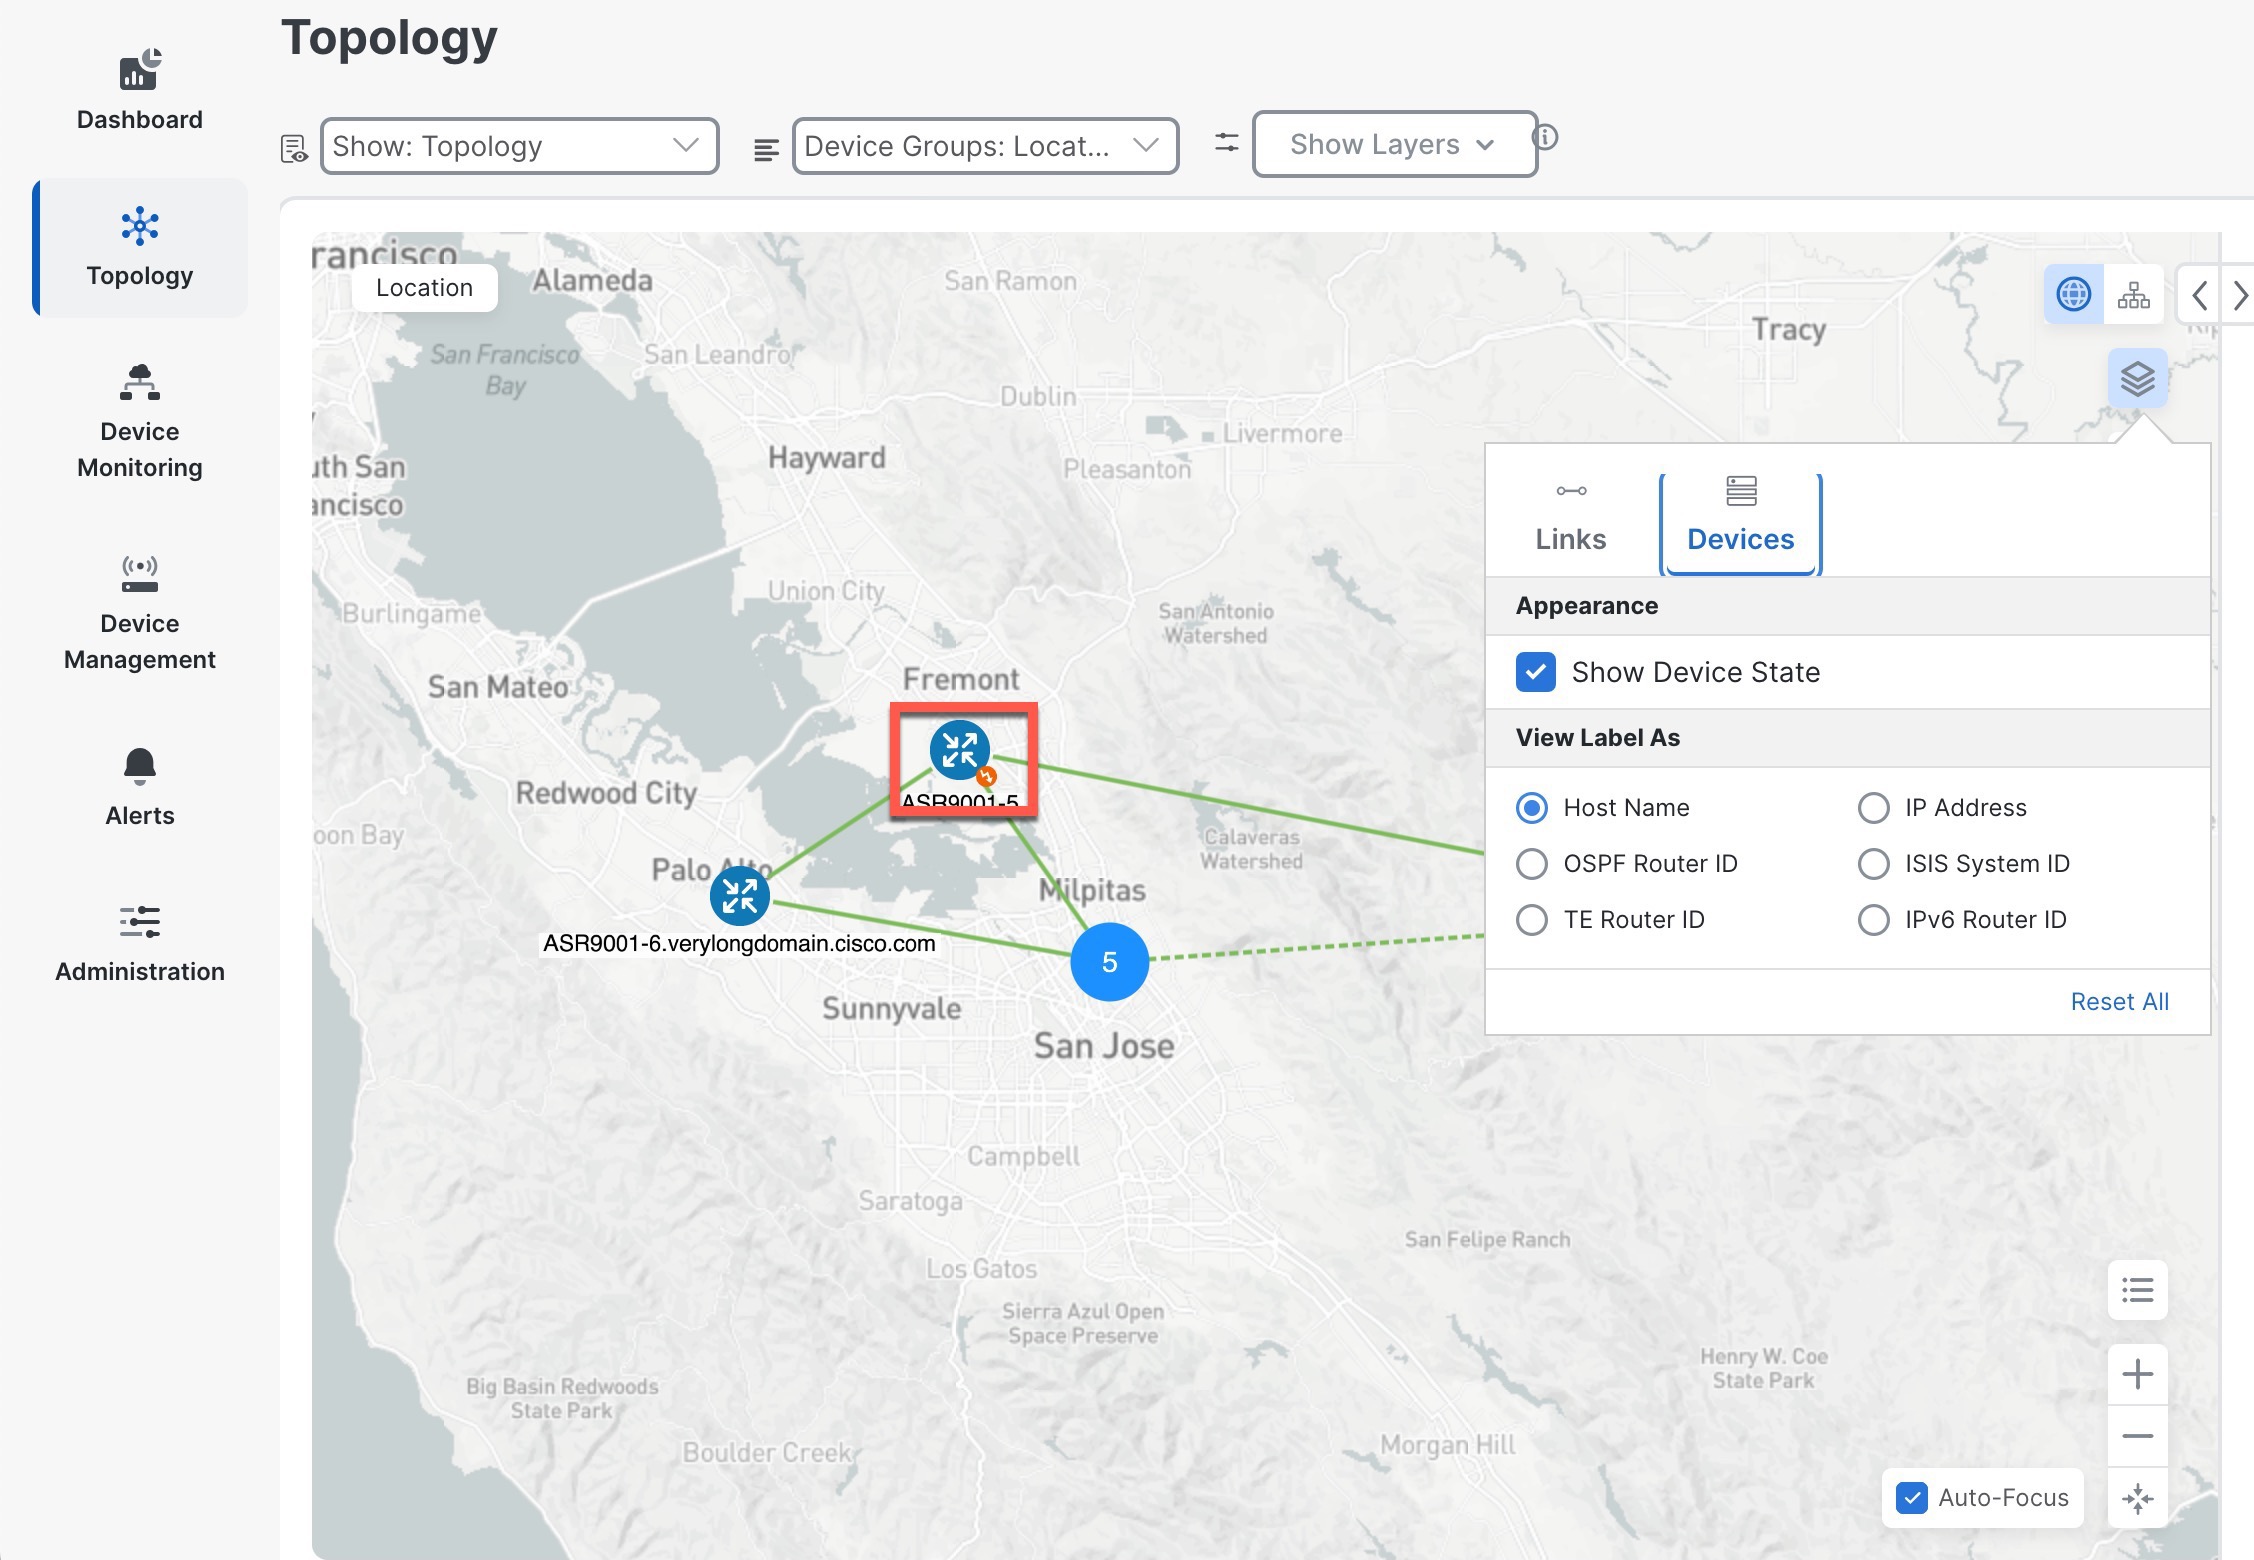
Topology Map View: From the Show drop-down list, click the option that displays the data that you would like to see on the map.

You can view the following options.

  • Topology

  • Traffic Engineering

  • VPN Services

  • Transport Slicing

2

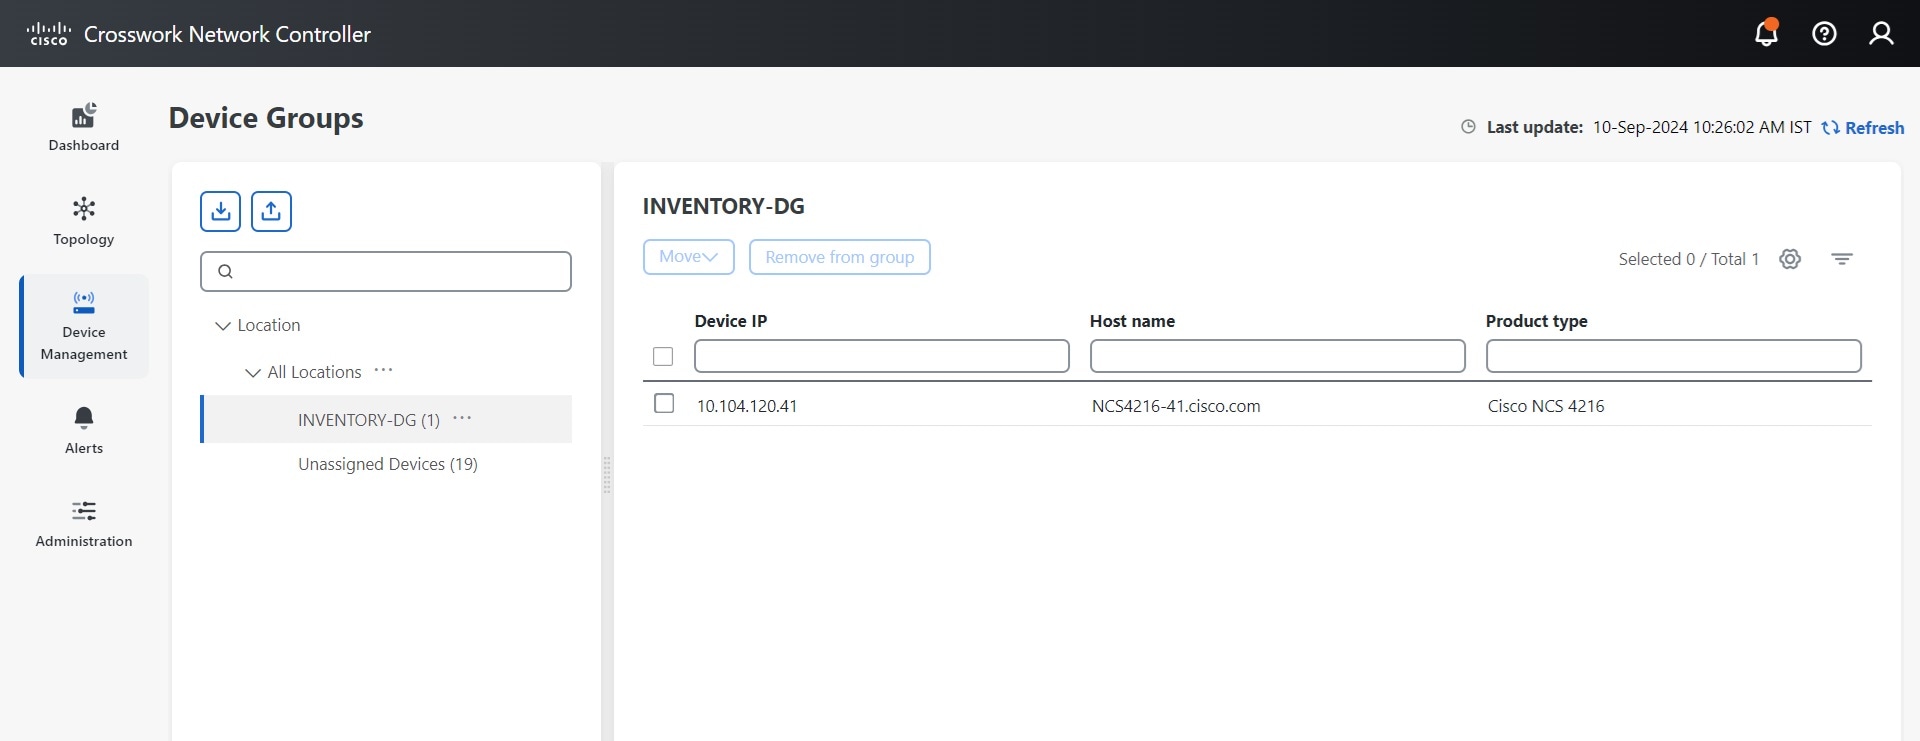
Device Groups: From the drop-down list, click the group of devices you want to display on the map. All other devices will be hidden.

3

Show Layers: From the drop-down list, click the network layers you want displayed on the map. All devices and links that belong to the selected layers are then displayed. By default, all layers are displayed.

4

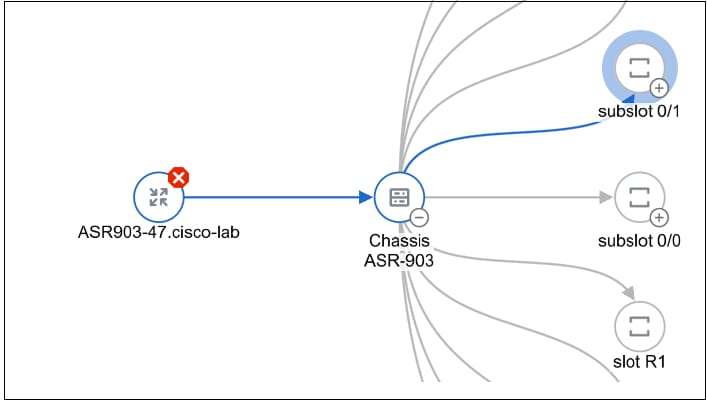
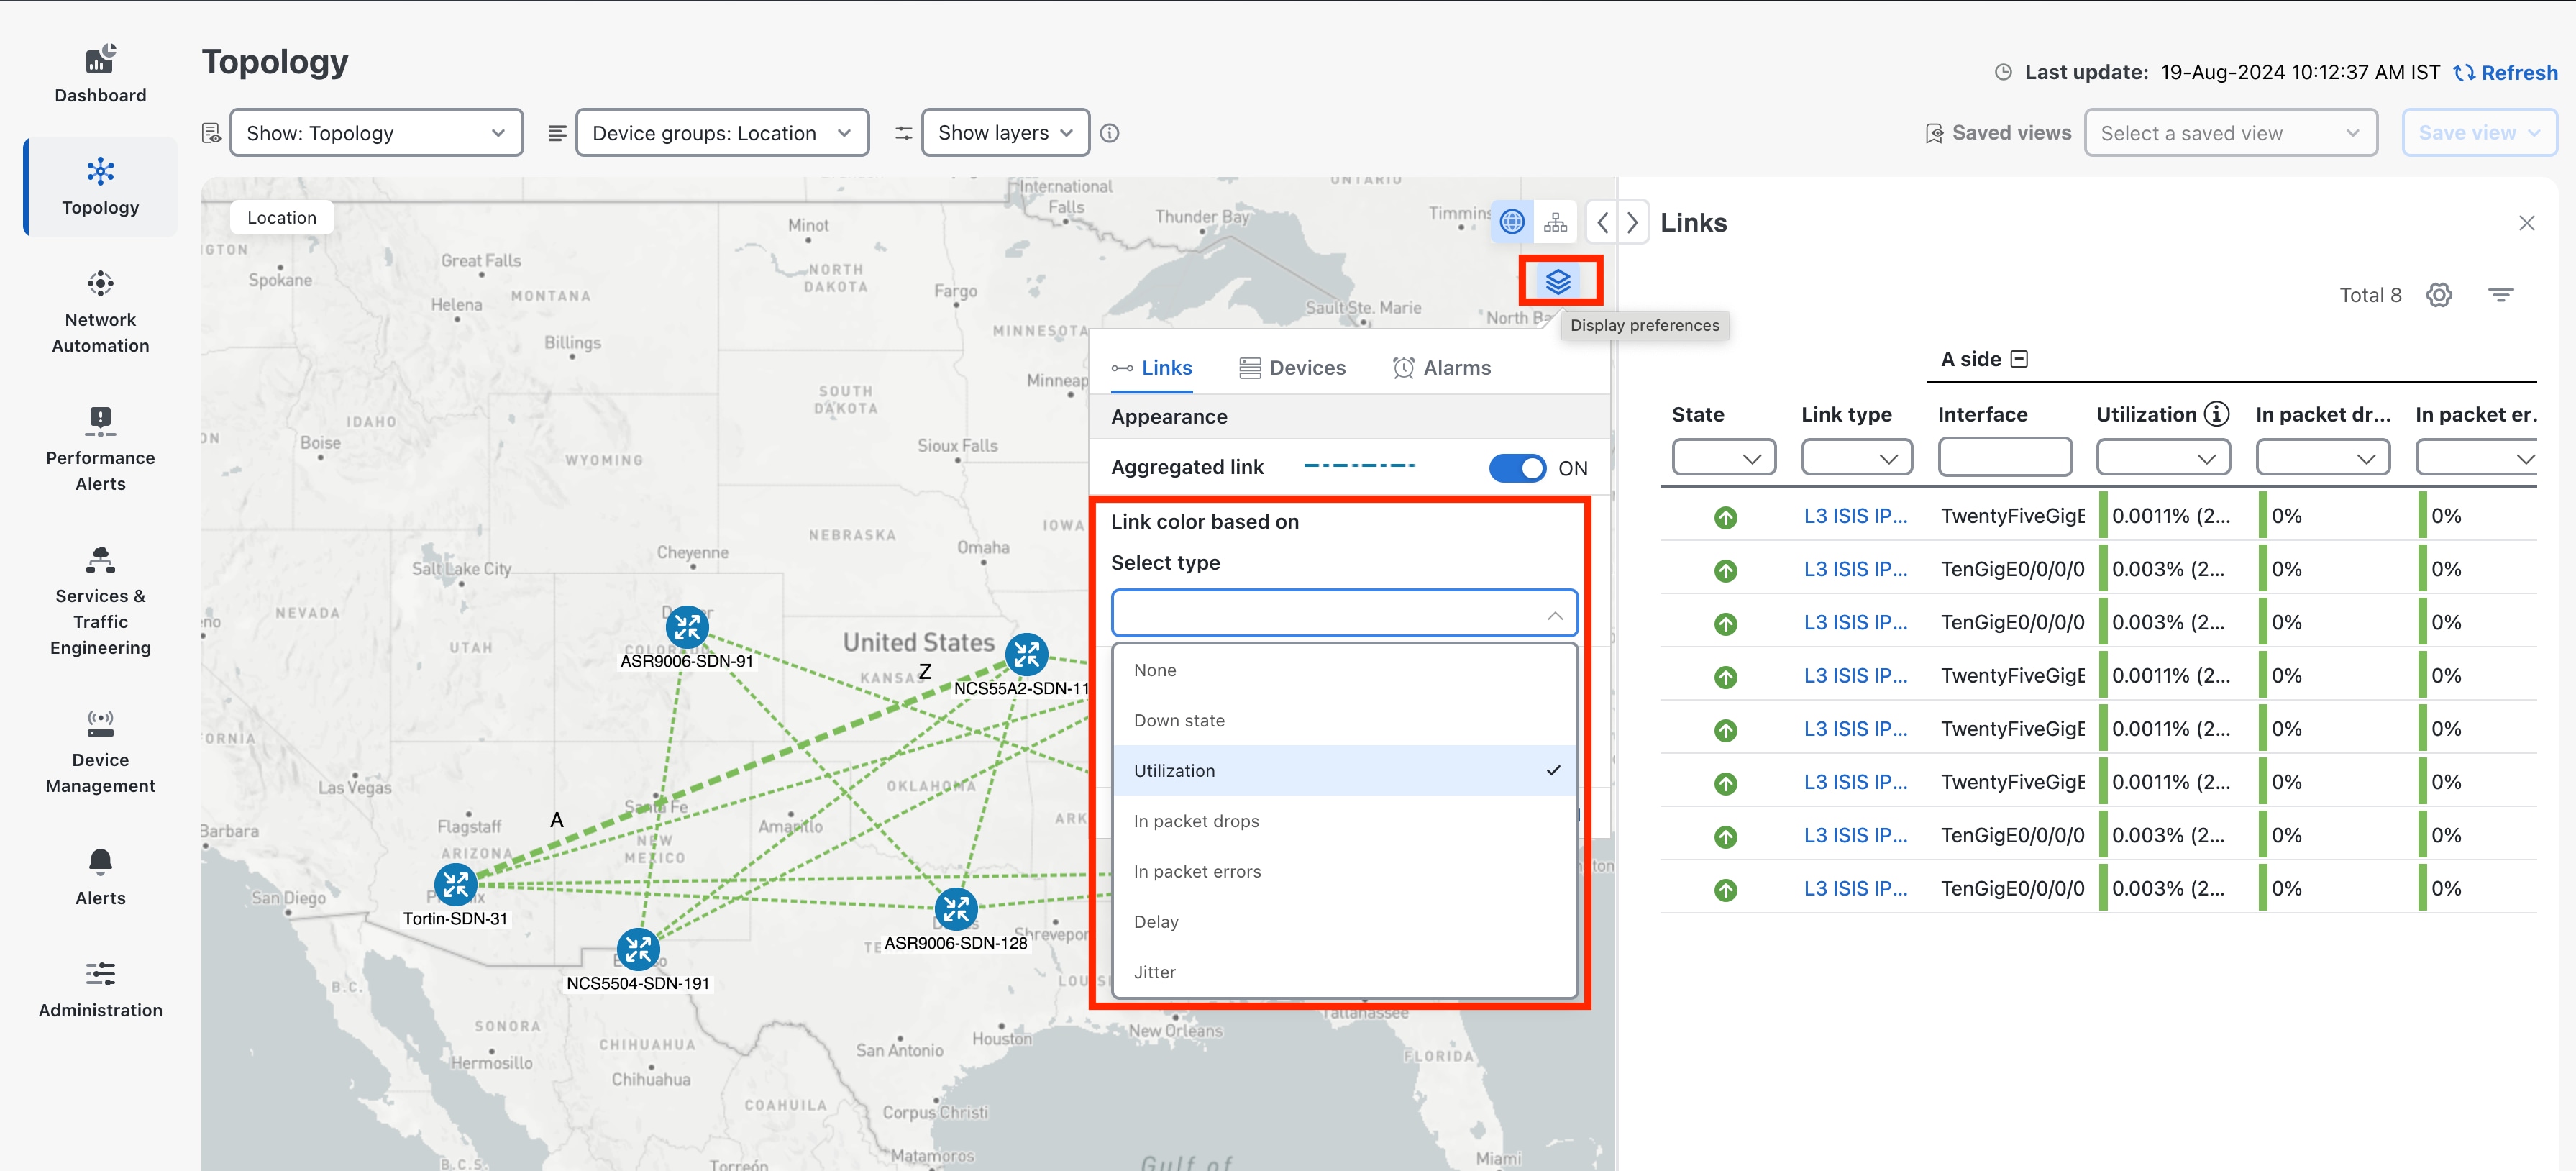
Topology Map: The topology map can be displayed on a logical map or a geographical map, where the devices and links are shown in their geographic context. From the map, you can drill down to get detailed information about devices and links.

Devices:

  • To view basic device information, hover the mouse pointer over the device icon. A pop up window displaying the host name, state, node IP, and device type appears.

  • To view device details, click on the device icon. For more information see, View Basic Device Details

If you have installed Element Management Functions:
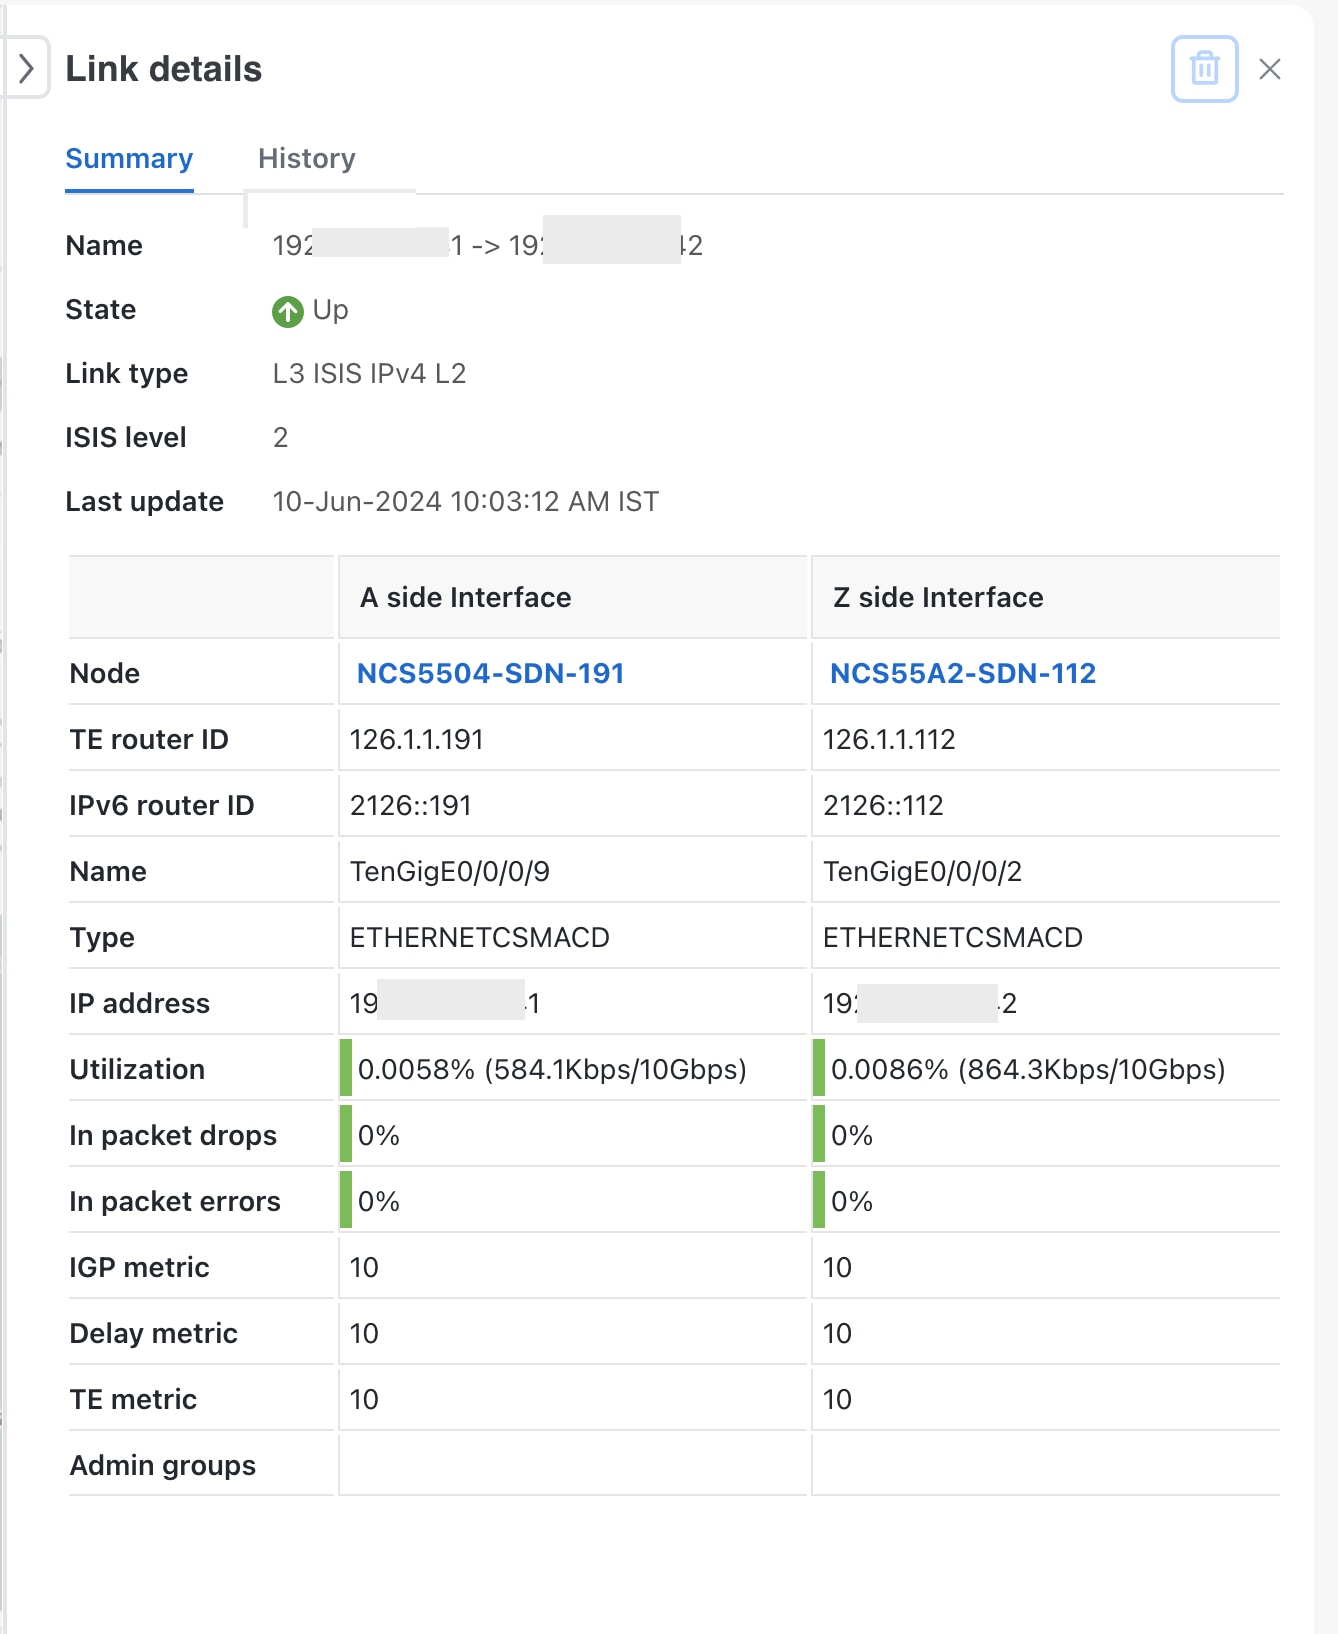
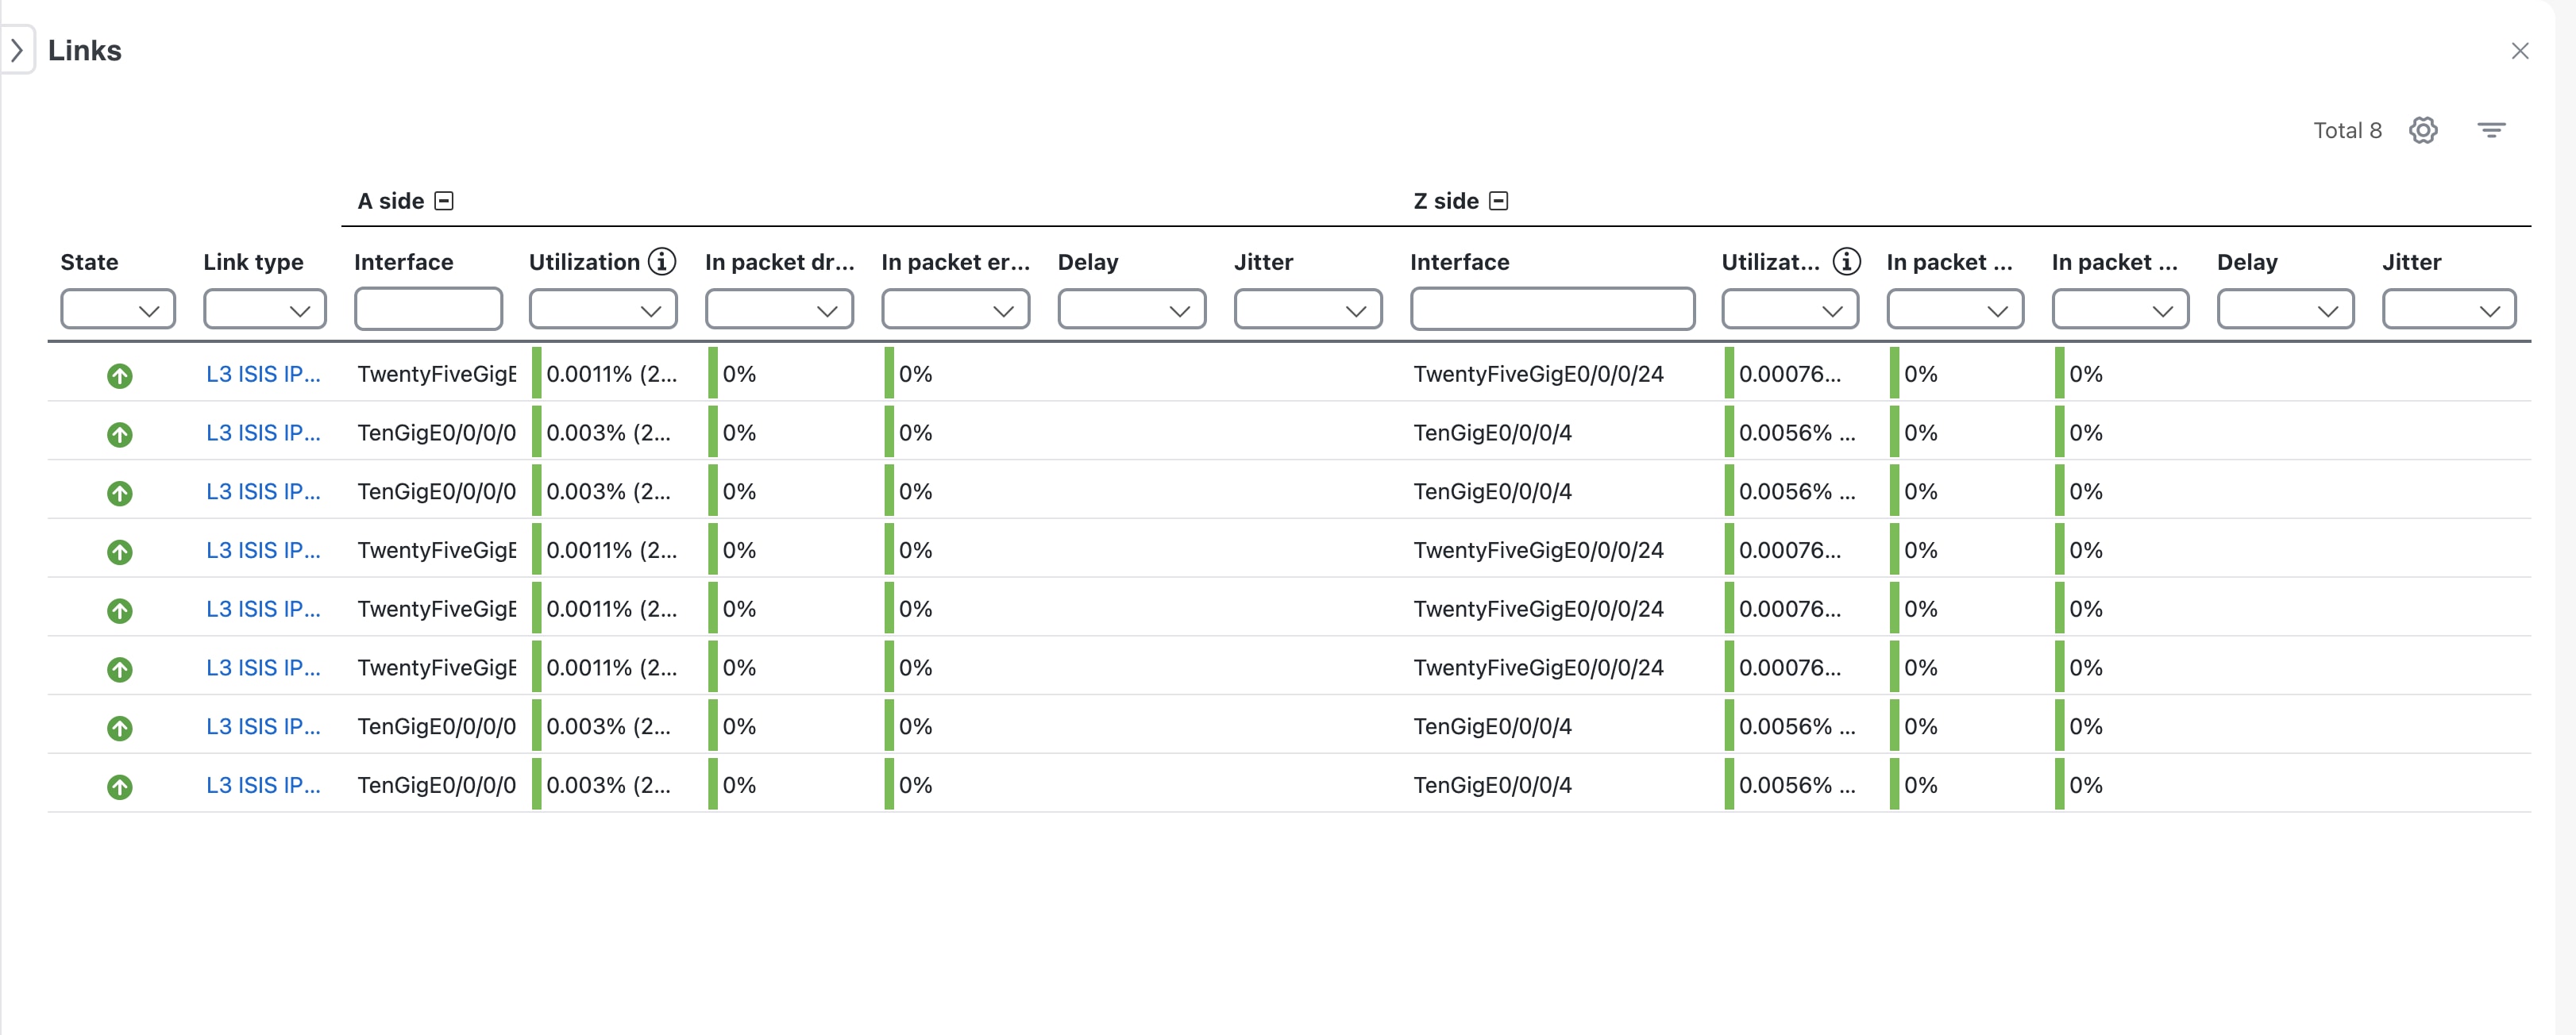
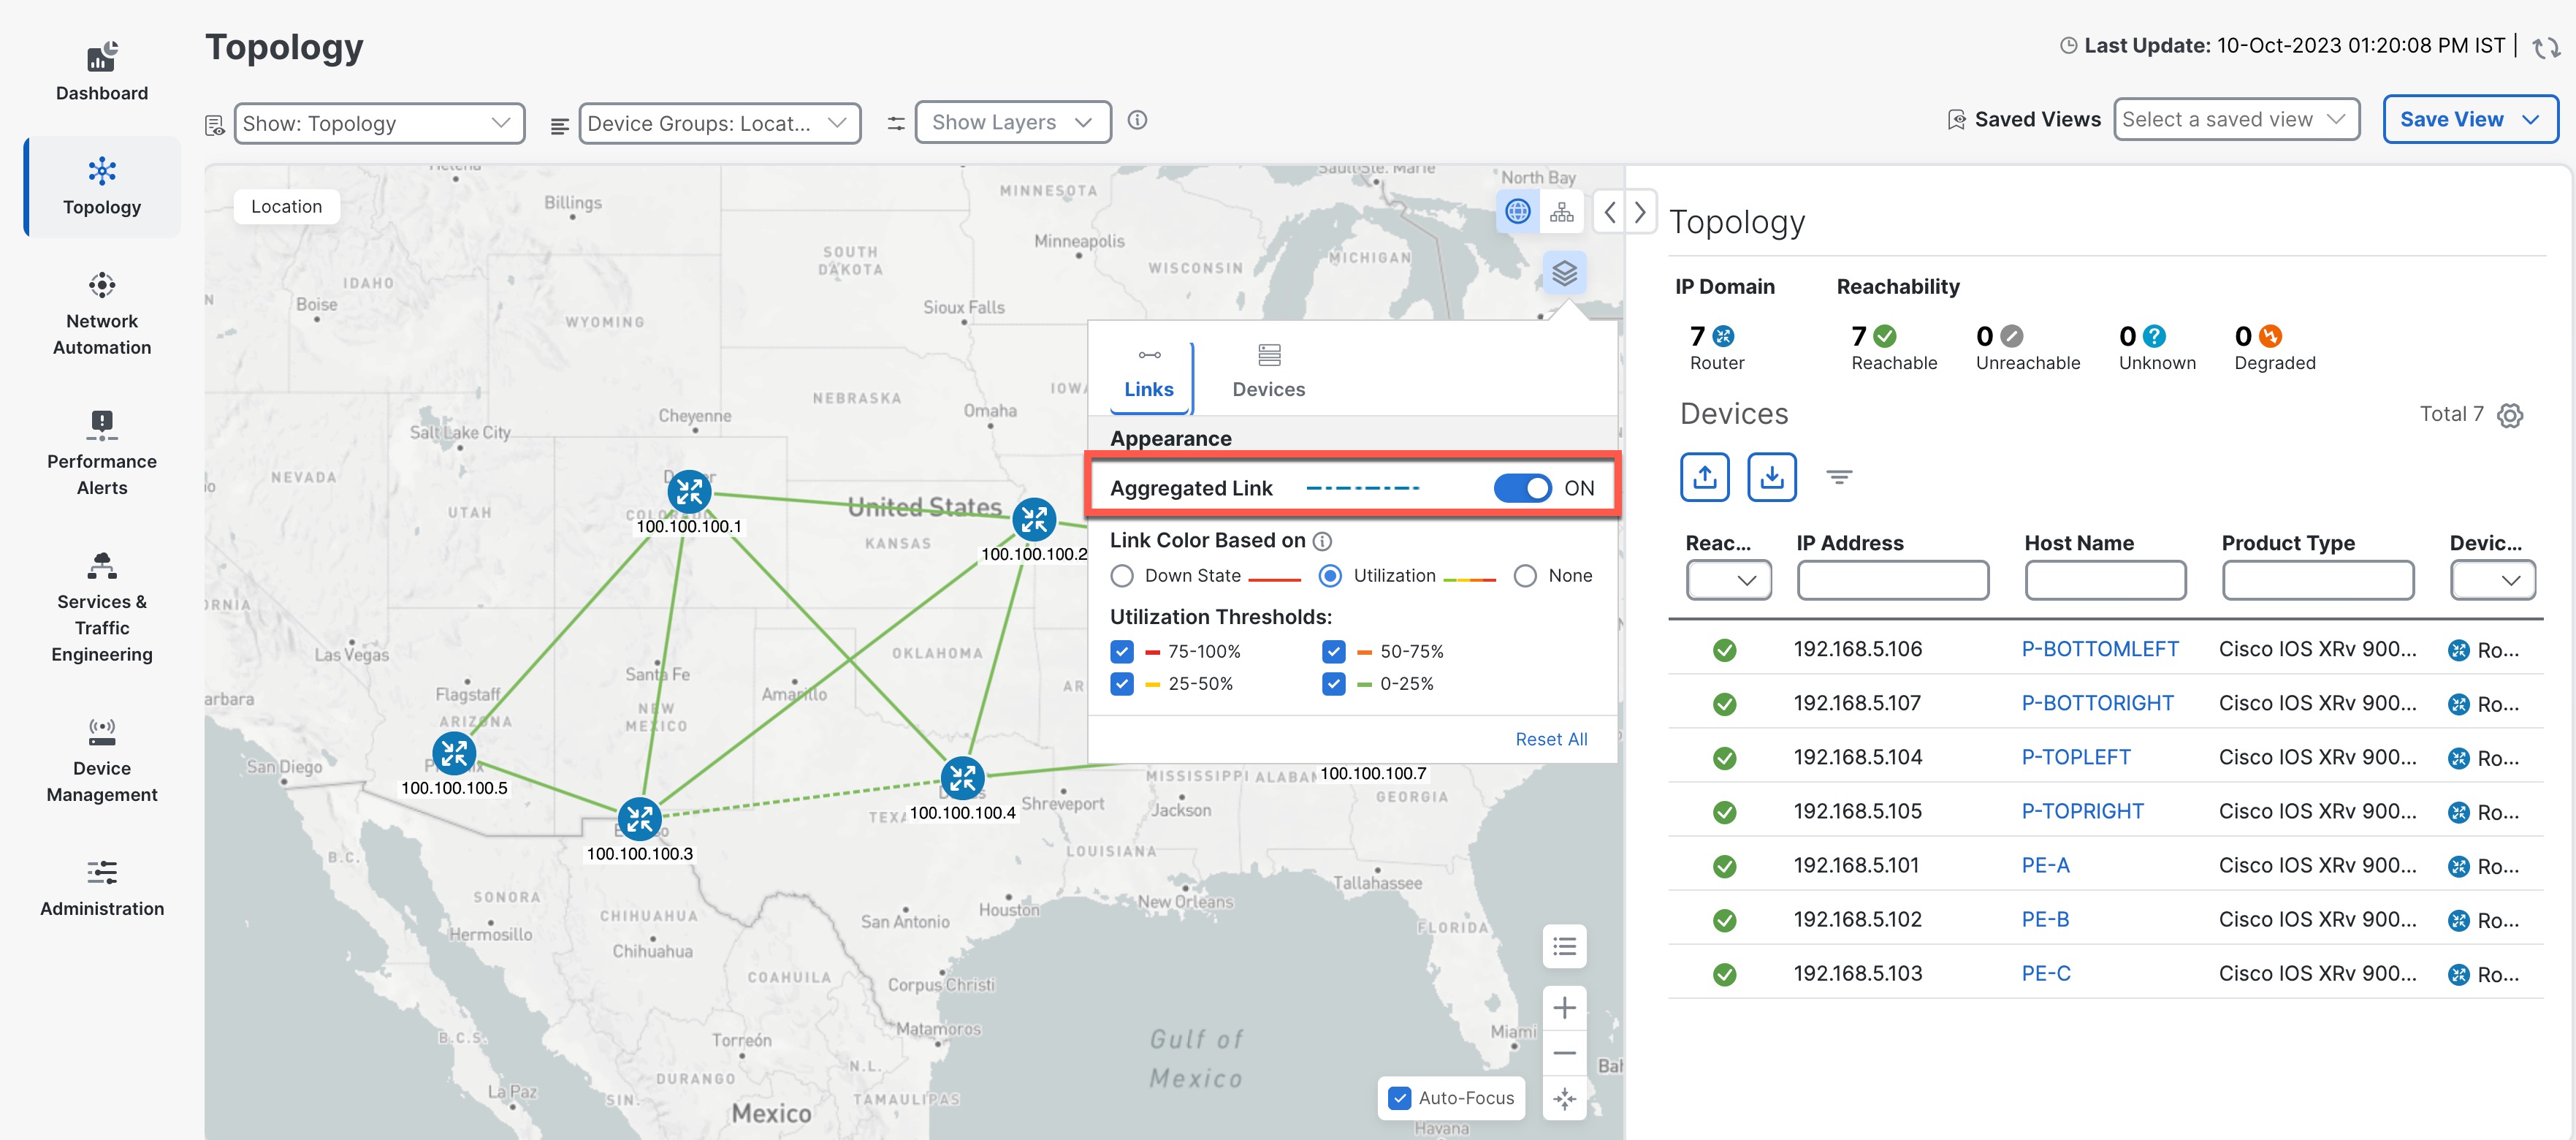
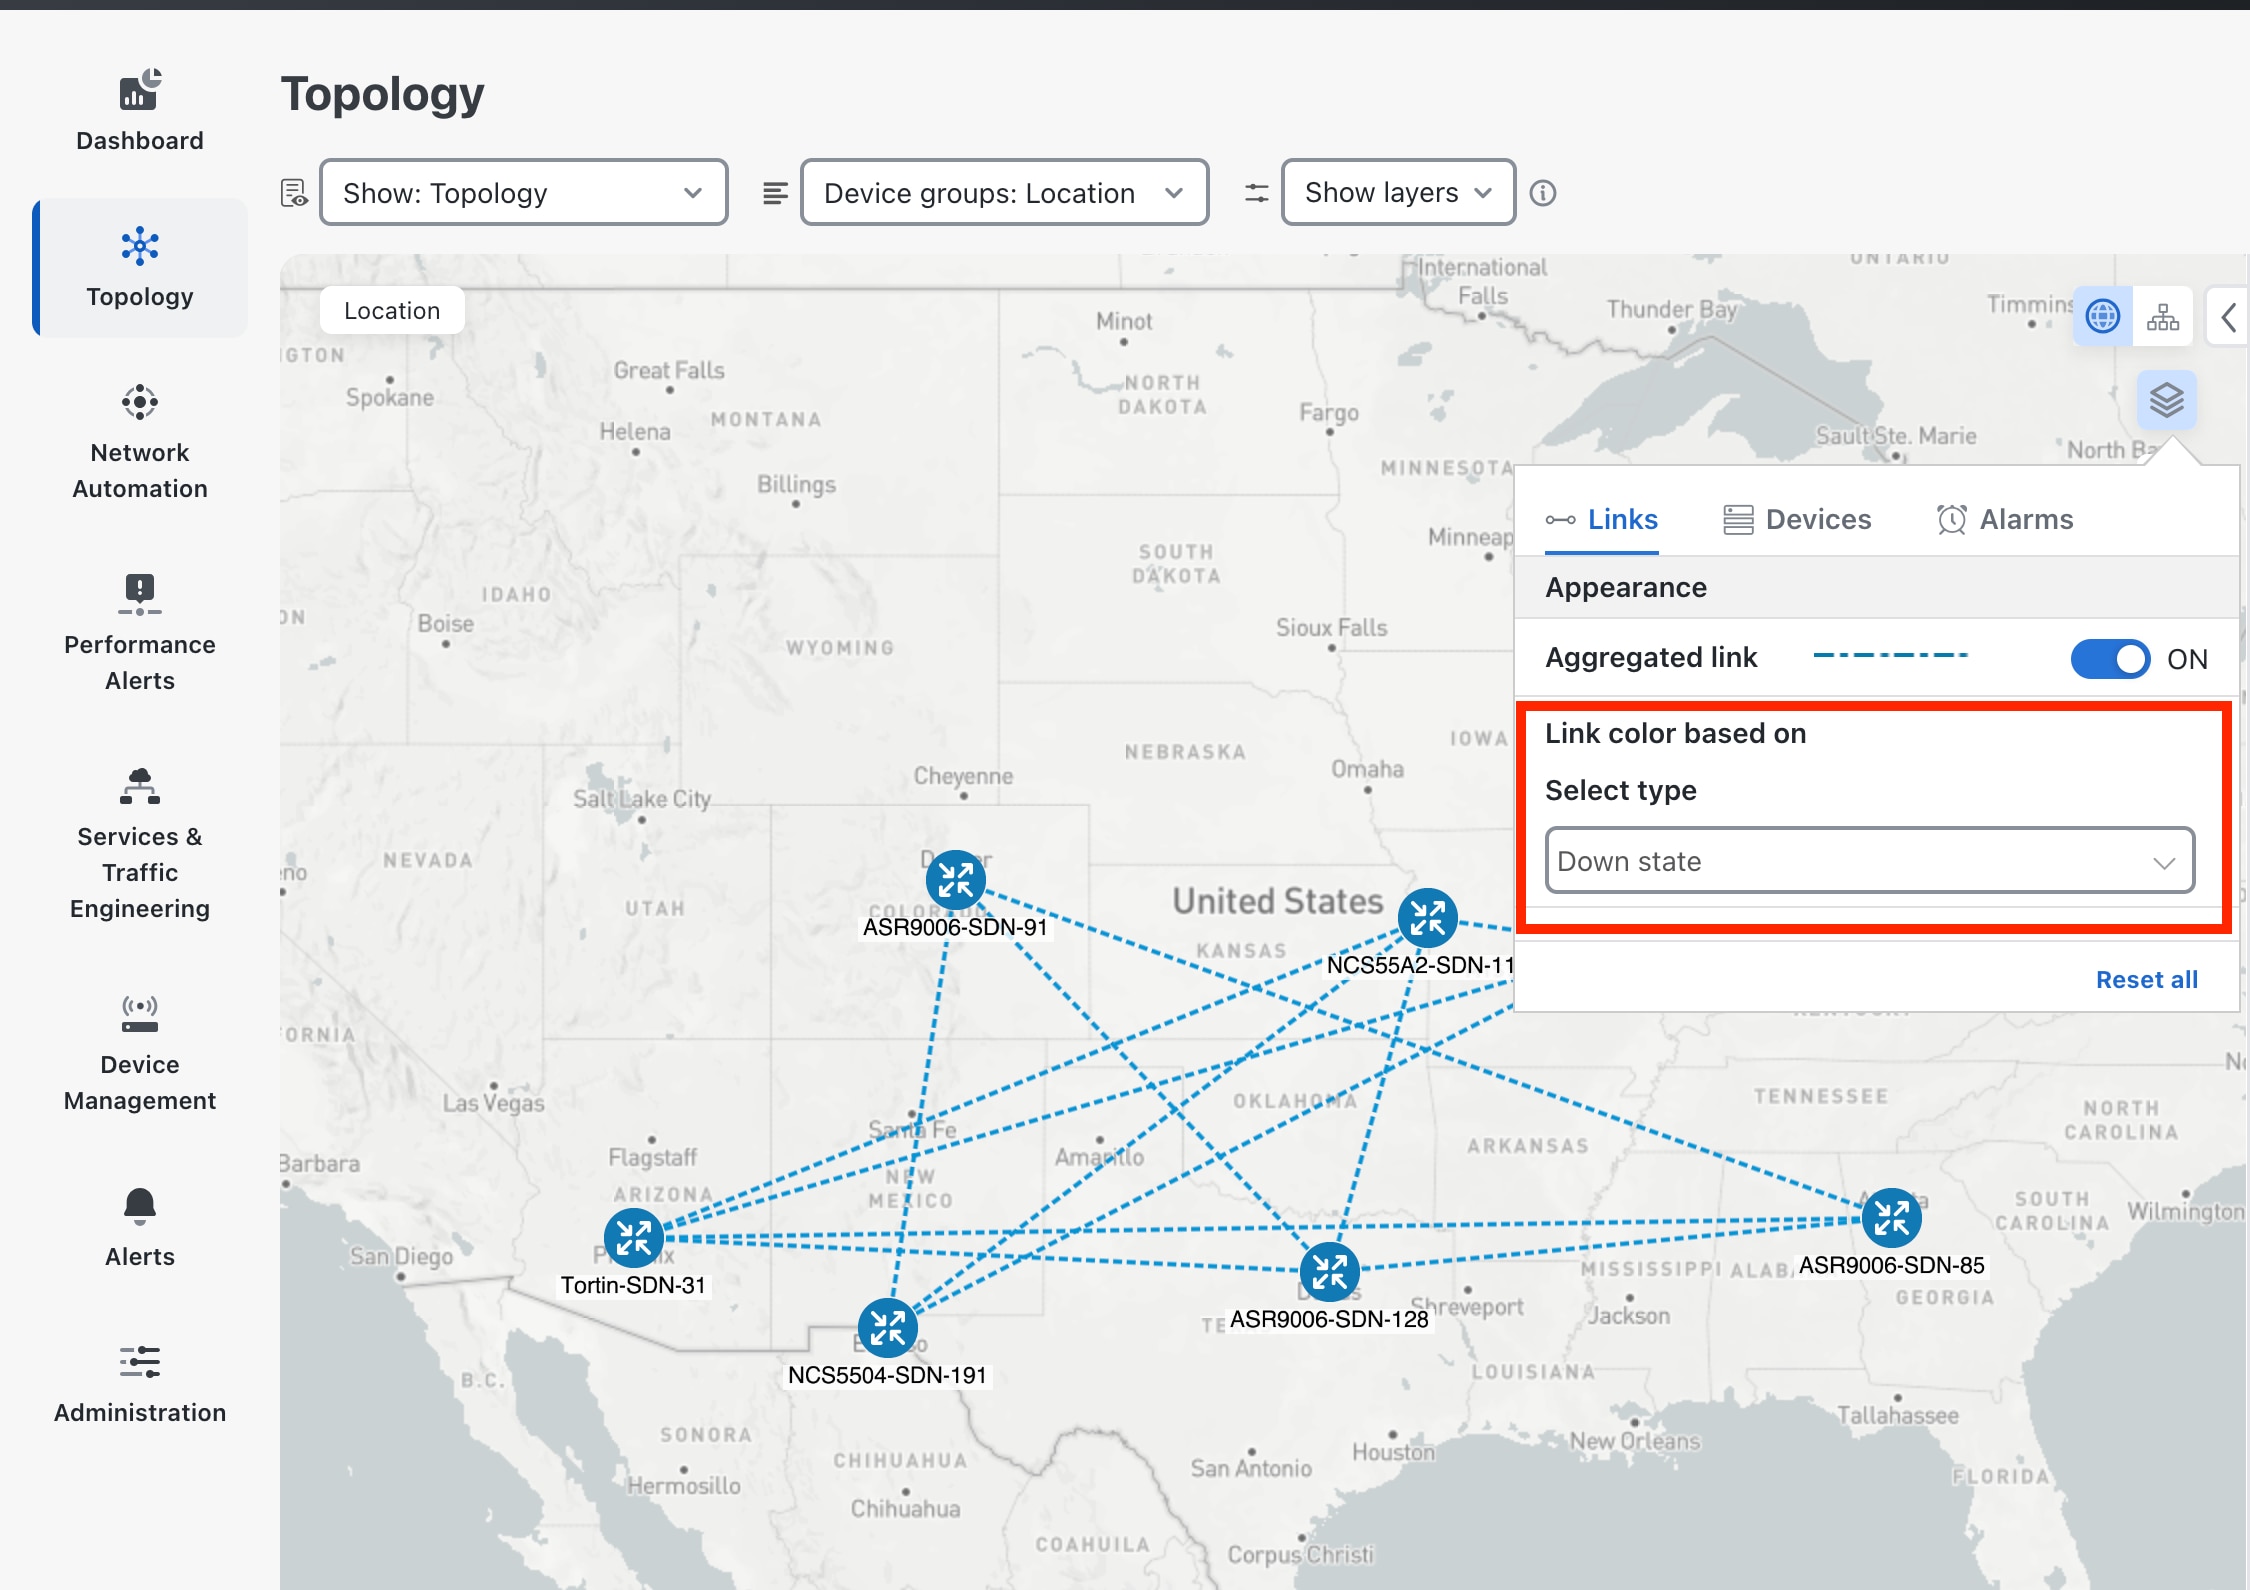
  • The following additional information will be displayed in the Device Details screen.

    • Alarm information under Summary in the Details tab.

    • Interface tab with name, and operational and admin status for each associated interface.

    • An Alarms tab displaying information such as severity, source, category, and condition of the alarms. The columns can be customized based on your preferences.

    • An Inventory tab displaying the product name, product id, admin status, oper status, and serial number. The columns can be customized based on your preferences.

    • A History tab with detailed information about device performance, including various performance metrics.

      Note


      Relevant performance policies should be created to see the history for a specific device or link.

Links:

  • A solid line represents a single link between two devices. A dashed line represents an aggregated link, which could indicate multiple links, such as several Layer 2 links (two Ethernet links for example) or several Layer 3 links (2 ISIS links) on the same physical link. To configure the dashed link, refer to Differentiate Aggregated Links from Single Links.

    For easy identification, you can color links on the map based on criteria such as link down and utilization. For more information, refer to Differentiate all Down Links and Show Link Health by Color.

  • A and Z indicates connecting interfaces.

  • To view link information details, click on the link, and the Links panel is displayed on the right-hand side with information.

5

: The logical map shows devices and their links, positioned according to an automatic layout algorithm, ignoring their geographical location. You can change the layout algorithm.

: The geographical map shows single devices, device clusters, and links, superimposed on a map of the world. Each device location on the map reflects the device's GPS coordinates (longitude and latitude) as defined in the device inventory.

: The Display Preferences window allows you to change display settings for devices, links. You can also change the display preferences for the alarms by enabling alarm visualization using the Show Alarms option in the Alarms tab and set a severity filter to show only the alarms of the selected severity or higher. Once enabled, the alarm notification icon will be displayed on the devices in the topology map in case of an alarm.

Note


Settings changes only apply to the current session and will revert to the defaults when you log out and log in again. To retain your changes for future use, save your view before logging out.

: The global search allows you to search the topology using device names, location or the device civic location.

6

Expand/Collapse/Hide Side Panel: Expand or collapse the contents of the side panel. Close the side panel to get a larger view of the topology map.

7

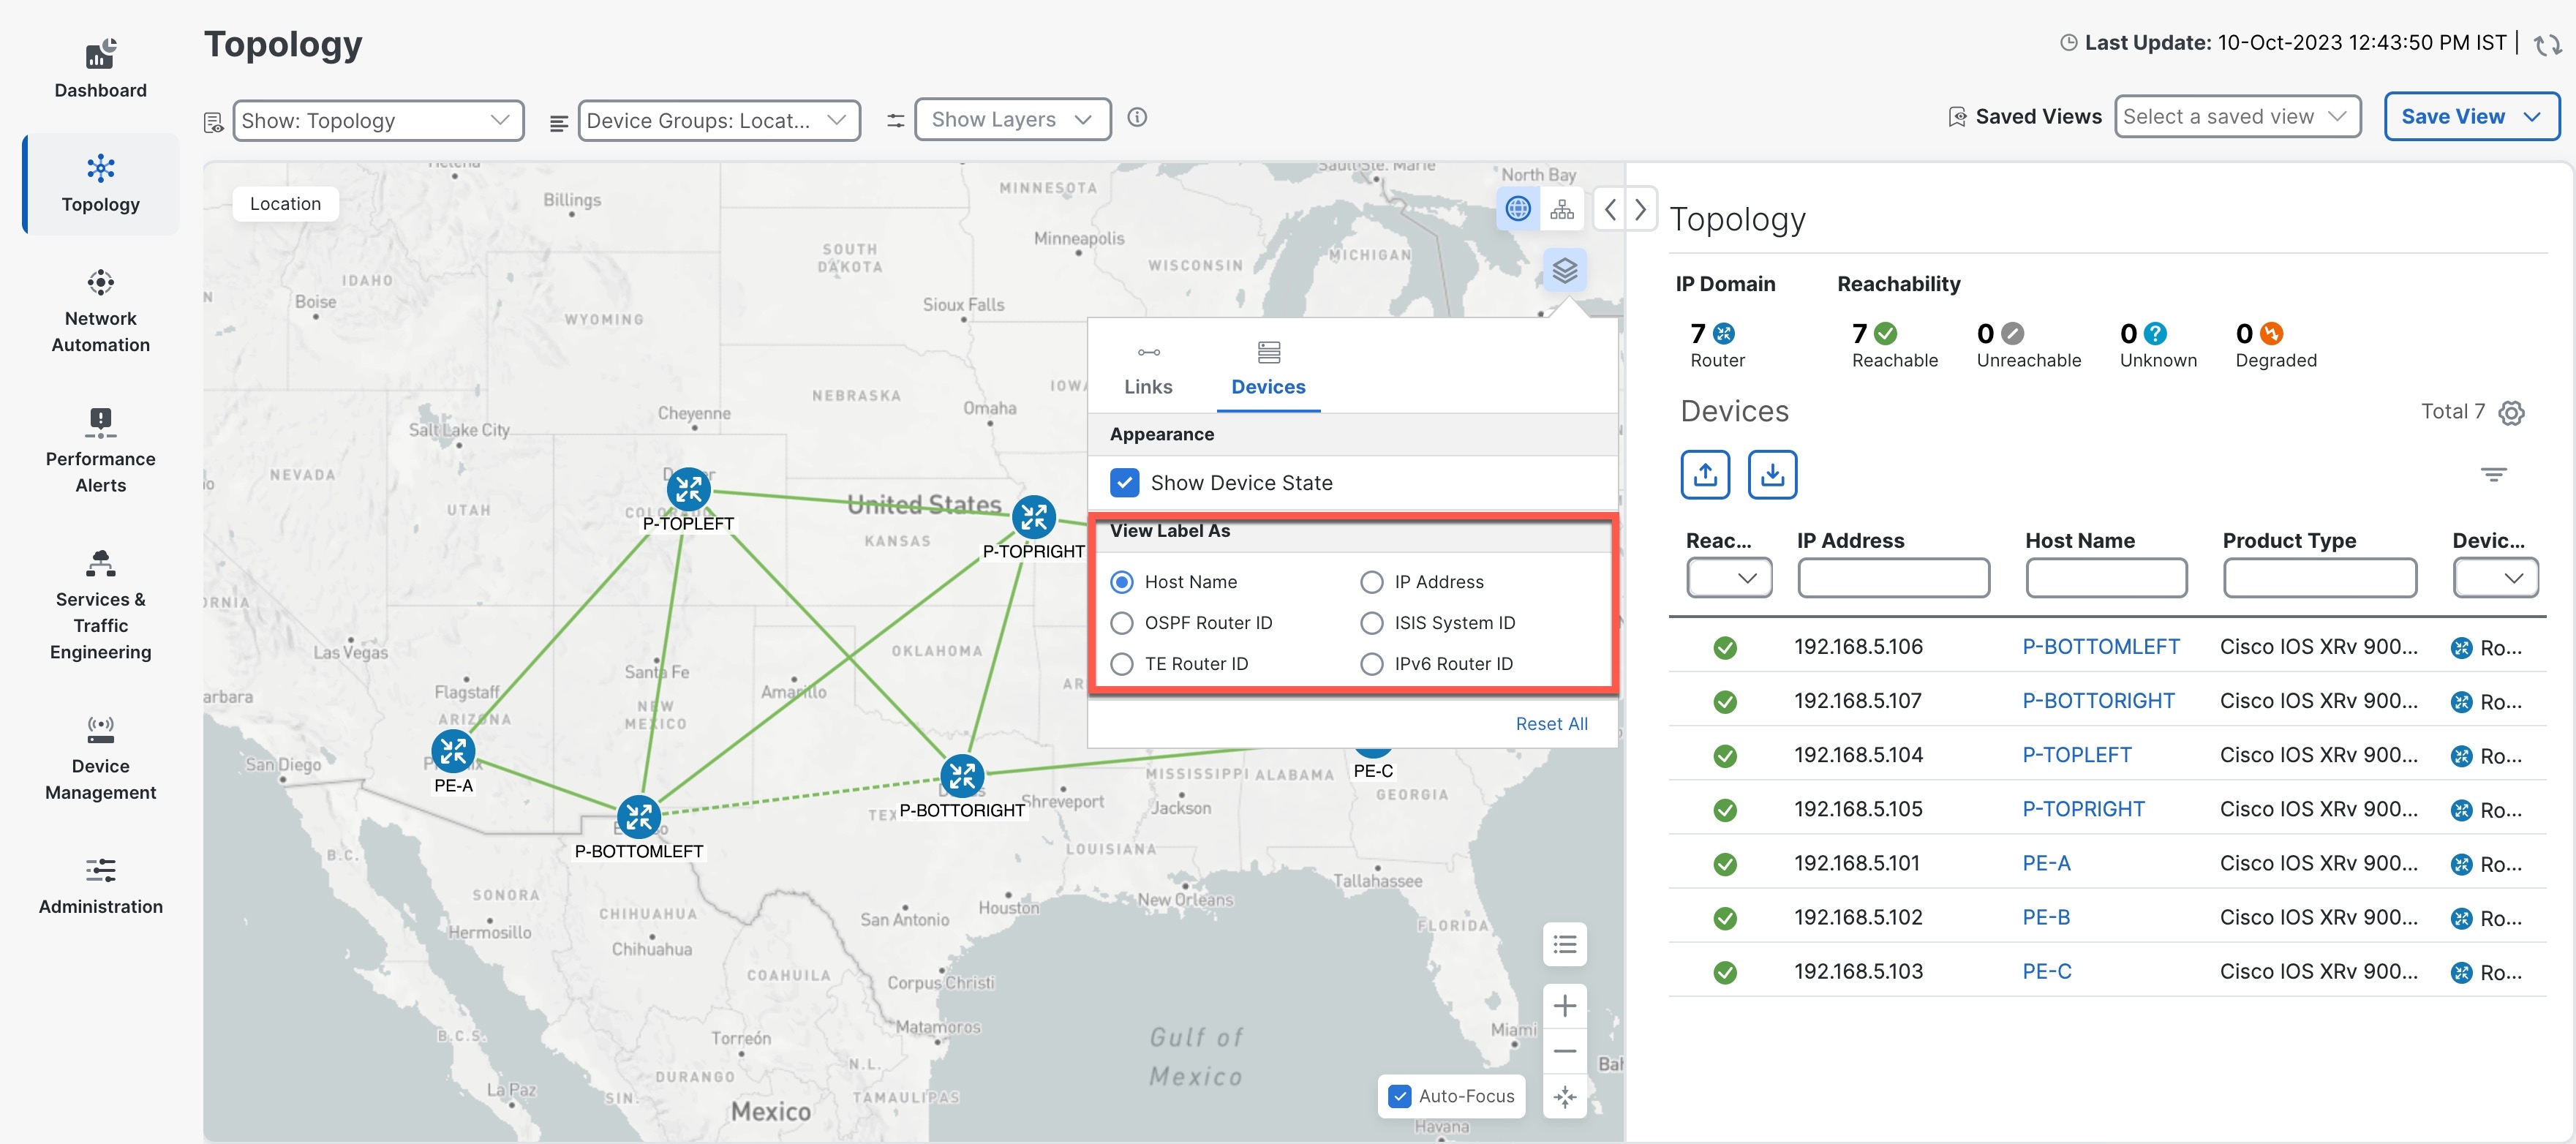
The Mini Dashboard provides a summary of the IP Domain and device reachability status. If filters are applied, the Mini Dashboard is updated to reflect what is displayed in the Devices table.

Note


If you have installed Element Management Functions, the Alarm Severity information is displayed in the Mini Dashboard and a Severity column is added to the Devices table. You can refine the table based on the severity value.

8

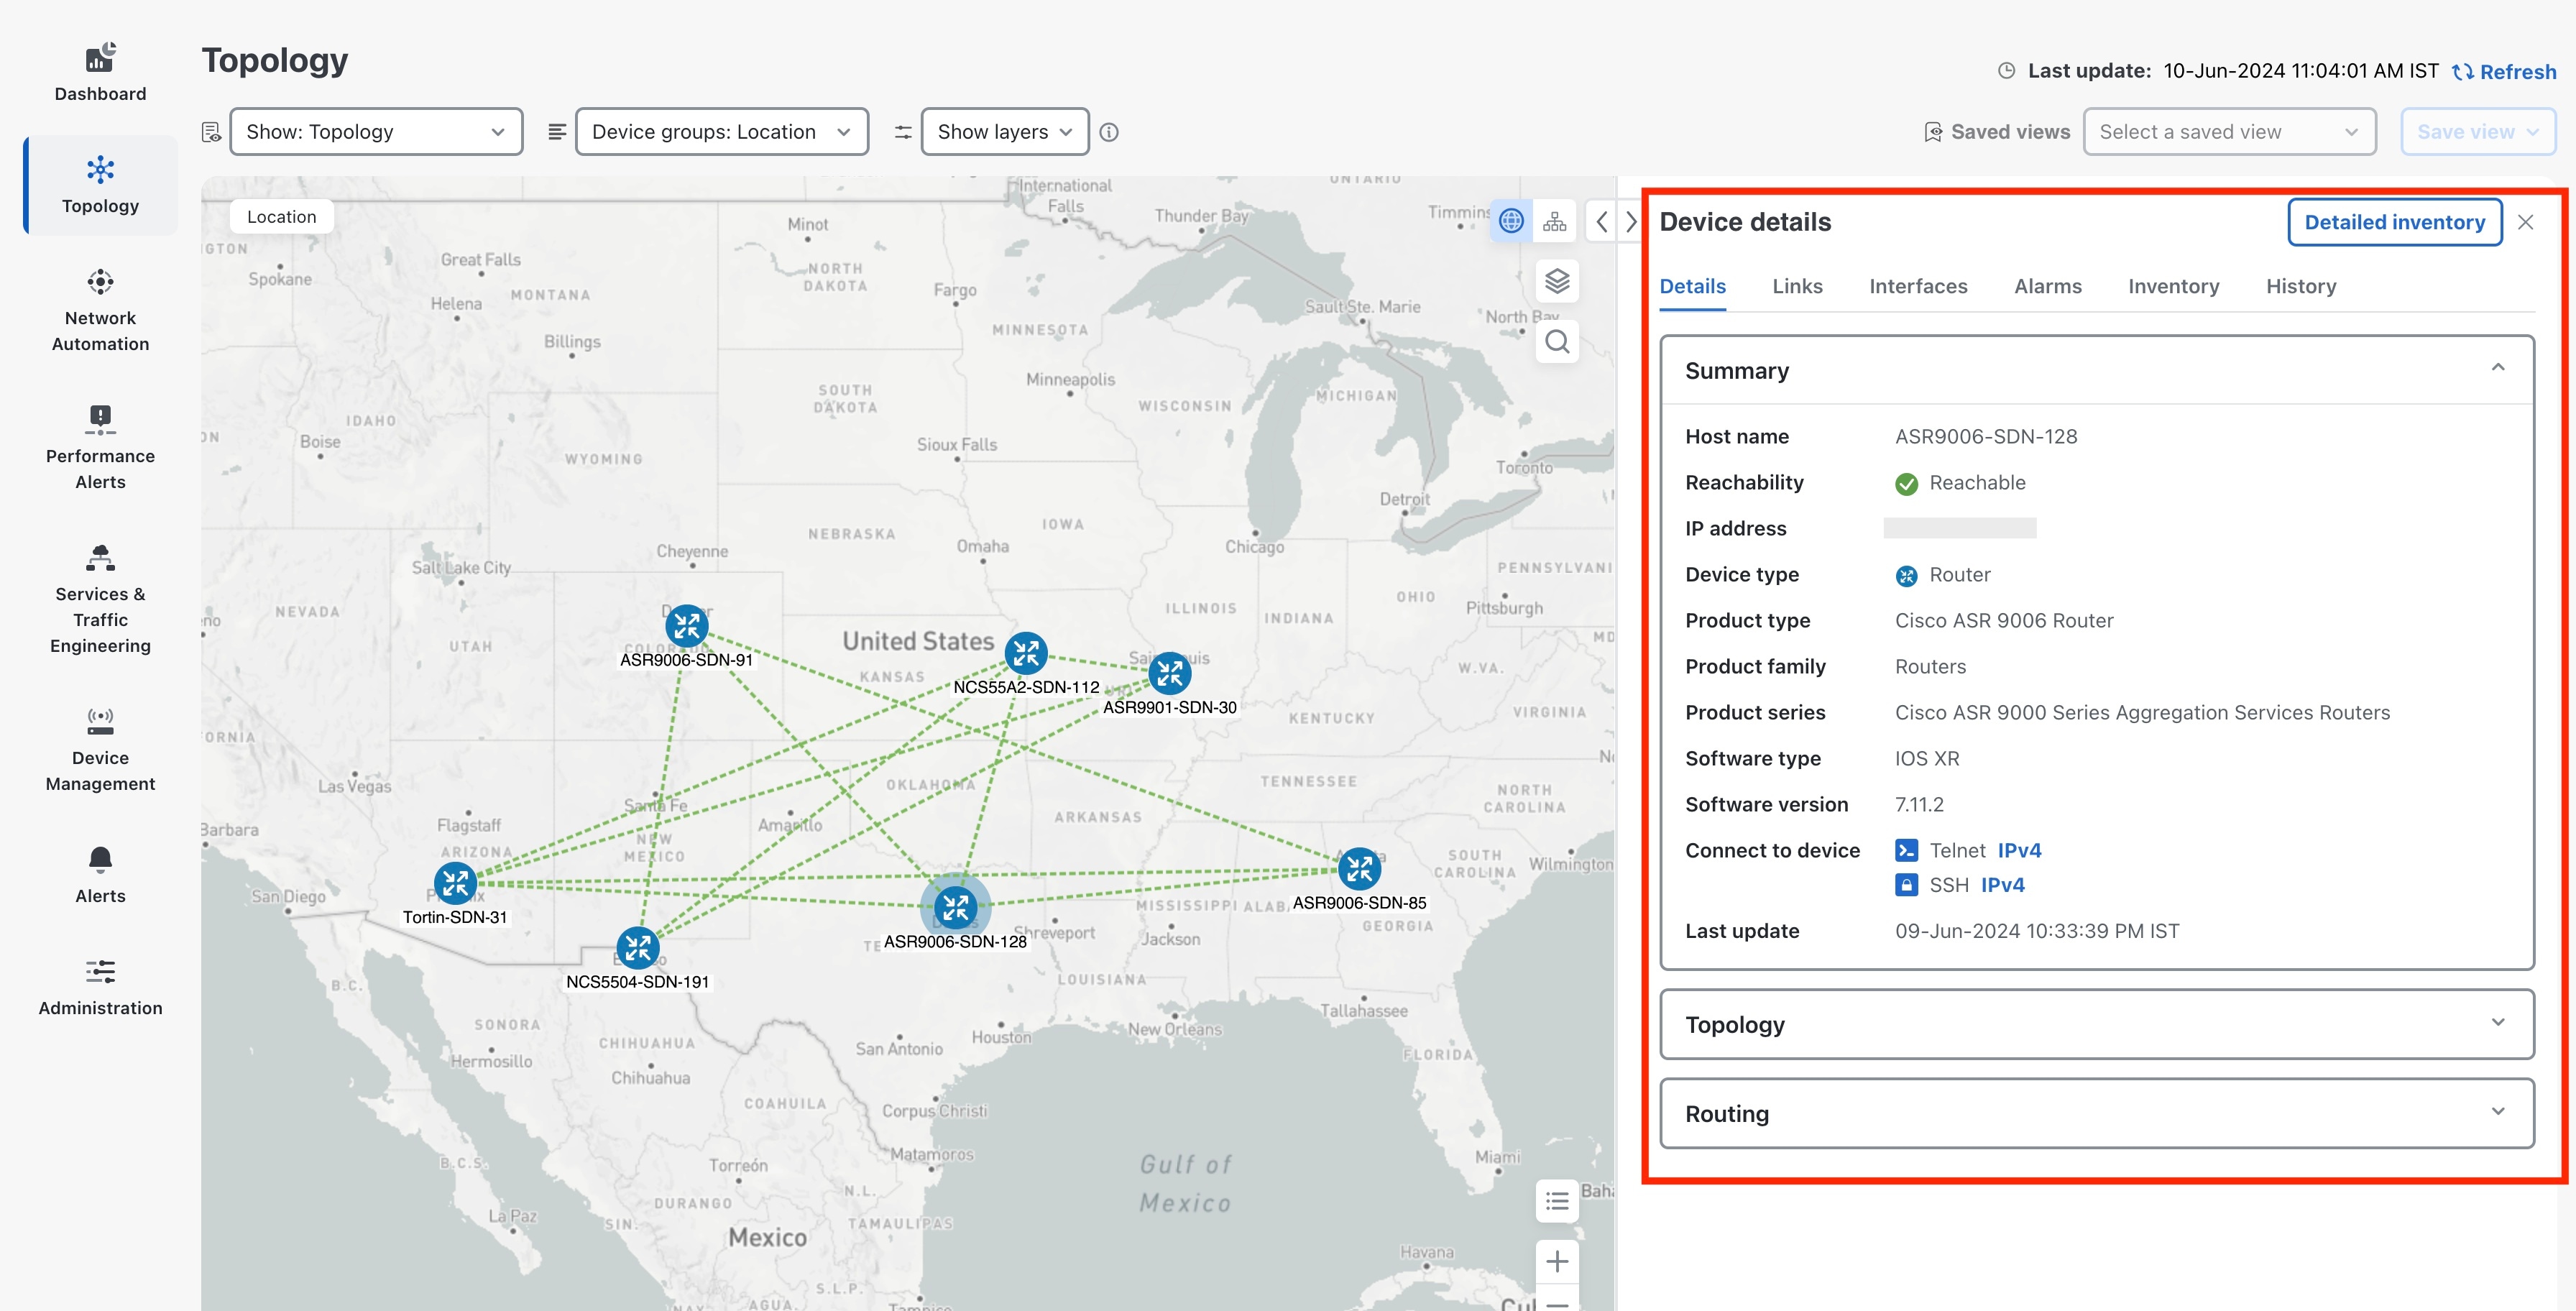
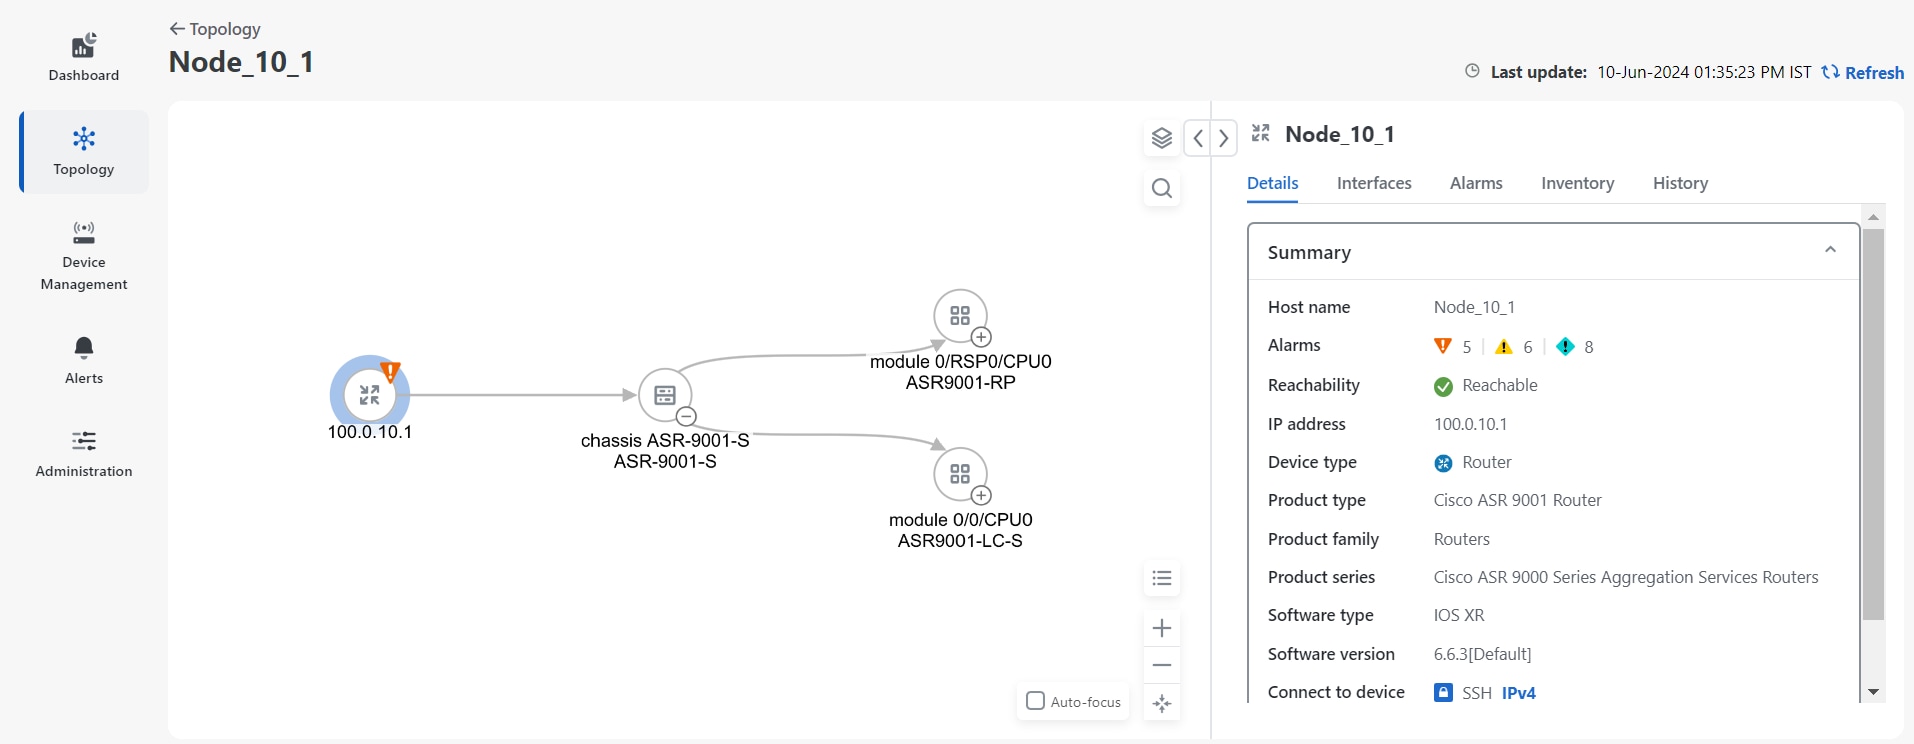
The content of this window changes depending on what applications you have installed, what Show is set to for the topology map and if you have selected to view more information on the device.

9

Saved Views: Lets you create a named custom view using the settings and layout for your current map, settings of the tables saved in the saved views, or display a custom view you have created previously.

Use Internal Maps Offline for Geographical Map Display

The system is set up by default to get the geo map tiles from a specific Mapbox URL through a direct Internet connection. If you do not have an Internet connection and therefore the system cannot access an external map provider to retrieve geographical map tiles, you can upload internal map files to represent the areas of the world you require for your network. These map files must be downloaded from Cisco.com and then uploaded into the system. The name of the map file indicates the area of the world it contains, for example, africa-geomaps-1.0.0-for-Crosswork-x.x-signed.tar.gz. If you will be managing a network in a specific part of the world, upload only the relevant map files. You do not need to upload all available map files.


Note


If you choose to work offline with internal maps and you do not upload map files, your geographical map will display as a generic world map without details of cities, streets, and so on.

To use internal maps to display the geographical map:

Before you begin

Download the necessary map files from Cisco.com and upload them to a server that supports SCP protocol for file transfer.

Procedure


Step 1

Download the map file.

  1. Navigate to cisco.com and download the signed map file that you require to a directory in your machine.

    For the purpose of these instructions, we will use the map file name as signed-us-geomaps-1.0.0-for-Crosswork-7.0.0.tar.gz

  2. Decompress the signed map file.

    tar -xvf <signature file>

    Example:

    cd <folder where tar was downloaded>
    tar -xvf a signed-us-geomaps-1.0.0-for-Crosswork-7.0.0.tar.gz
    
    README
    us-geomaps-1.0.0-for-Crosswork-7.0.0-signed.tar.gz
    us-geomaps-1.0.0-for-Crosswork-7.0.0-signed.tar.gz.signature
    cisco_x509_verify_release.py
    cisco_x509_verify_release.py3
    CW-CCO_RELEASE.cer

Step 2

Add the downloaded map file in Crosswork Network Controller.

  1. From the main menu, choose Administration > Settings > System Settings.

  2. Under Topology, click the Map option.

  3. Select the Work offline with internal maps radio button and click Manage.

  4. In the Manage Internal Maps dialog, click to upload a new map file. Note that you can upload one file at a time.

  5. In the Upload Map File dialog, browse to the location of the map file you downloaded so that the system can access the file. Select the file with the .signed.tar.gz extension.

    Example: us-geomaps-1.0.0-for-Crosswork-7.0.0-signed.tar.gz

  6. Click Upload.

    The system uploads the map from the specified location. Do not close the browser or click Cancel during the upload process, as it might take some time. After the upload is complete, the new map appears under Uploaded Maps in the Manage Internal Maps dialog.


What to do next

Repeat this procedure for any additional maps, as needed.

Use Device Groups to Filter your Topology Map

Device groups let you organize and manage your devices according to your needs. You can use device groups to filter and display data from specific devices on your dashboard. Device groups also allow you to visualize and zoom in on data specific to a particular group of devices. It reduces the clutter on your screen and allows you to focus on data that is most important to you.

Create Device Groups

You can create device groups and add devices to the groups either manually (as described in this section) or automatically, as described in Create Rules for Dynamic Device Grouping. A device can belong to only one device group.

Figure 2. Device Groups

Procedure


Step 1

From the main menu choose Device Management > Device Groups. We see that a device group has been selected. Also note that only the devices belonging to that device group are listed in the devices table in the right pane.

Step 2

To add a new sub-group, click the three dots next to any group and then click Add a Sub-group.

Step 3

Fill in the details and click Create.

A new sub-group is added under the selected parent group.

Create Rules for Dynamic Device Grouping

You can create a rule to dynamically create device groups and automatically add unassigned devices to these groups using a Regular Expression (regex) on the device host name or IP address. Any newly added or discovered devices that match the rule will be placed in the appropriate group.

Dynamic rules do not apply to devices that already belong to groups. You must move them to Unassigned Devices if you want them to be considered by the rule.

Before you begin

While you can follow examples given in the Dynamic Groups dialog, it is helpful to be familiar with Regular Expressions.

Procedure


Step 1

From the main menu choose Device Management > Device Groups.

Step 2

Click next to All Locations > Manage Location Dynamic Groups.

Step 3

Click Show more details and examples to help you fill out the required host name or IP address.

Step 4

If there are any existing devices in the Unassigned Devices group, click Test Rule to view a sampling of what type of group names will be created.

Step 5

Turn the Enable Rule toggle ON to enable the rule. After the rule is enabled, the system checks for unassigned devices every minute and will assign them to the appropriate group based on the rule.

Step 6

Click Save.

Step 7

Groups that are created this way initially appear under Unassigned Groups (created when a rule is enabled for the first time). Move newly created groups to the desired group hierarchy.


Modify Device Groups

You can modify device groups to add or edit the device group details. You can change the group name, or assign a different parent group.

Procedure


Step 1

From the main menu choose Device Management > Device Groups.

Step 2

To edit the group details, click the three dots next to the group name and then click Edit Group Properties. You can update the parent group, group name and the description.

Step 3

Click Save.


Delete Device Groups

You can delete a device groups from the system. This will unassign all the devices that belong to that group and make them available for other groups.

Procedure


Step 1

From the main menu choose Device Management > Device Groups.

Step 2

To delete the device group, click the three dots next to the group name and then click Delete Group.

Step 3

On the Delete Group pop-up, click Delete to confirm your deletion.


Move Devices from One Group to Another

If you need to reorganize your devices, you can move them from one group to another.

Procedure


Step 1

From the main menu choose Device Management > Device Groups.

Step 2

Select the group from which you wish to move the devices.

Step 3

Select the devices from the right pane.

Step 4

From the Move drop-down, select the appropriate group and click Move. You can also create a new group to which you can move your selected devices. For more information refer to Create Device Groups


Import Multiple Device Groups

When you import device groups from a CSV file, the import process creates new device groups that does not exist in the database, and updates the existing device groups that have the same data as the imported ones. This means that you might lose some of your original data if you import device groups without backing them up first. Therefore, we recommend that you export a copy of all your current device groups before you perform an import.

Procedure


Step 1

From the main menu, choose Device Management > Device Groups.

Step 2

Click to open the Import Groups dialog box.

Step 3

If you have not already created a device groups CSV file to import:

  1. Click the Download device groups (*.csv)' template link and save the CSV file template to a local storage resource.

  2. Open the template using your preferred tool. Begin adding rows to the file, one row for each device group.

    Use a semicolon to separate multiple entries in the same field. Use two semicolons with no space between them to indicate that you are leaving the field blank.

    Be sure to delete the sample data rows before saving the file, or they will be imported along with the data you want. The column header row can stay, as it is ignored during import.

  3. When you are finished, save the new CSV file.

Step 4

Click Browse to navigate to the CSV file you just created and then click Open to select it.

Step 5

With the CSV file selected, click Import.

Note

 
  • While importing device groups using a CSV file, you should wait for the operation to complete. Clicking the Import button while the operation is in progress will lead to duplicate entries.


Export Multiple Device Groups

You can export the device groups details to a CSV file. This is useful for creating a record of all the device groups in the system at a given time. You can also modify the CSV file as you wish, and import it back to update the existing data.

Procedure


Step 1

From the main menu, choose Device Management > Device Groups.

Step 2

Click to export the device groups in CSV format. The CSV file is then downloaded in your systems download folder.


View Device Details from the Topology Map

The topology map lets you view the information of any device in your network. You can see various details, such as device specifications, routing configurations, and device links. The topology map enables you to monitor and manage your network devices with ease and efficiency.


Note


For information on managing your devices and inventory, viewing interface details, and performing actions such as inventory synchronization, refer to the Cisco Crosswork Network Controller 7.0 Device Lifecycle Management guide.

View Basic Device Details

You can view the basic device details and its connections in a graphical way. The map also allows you to adjust the view of the device by zooming in and out, panning, and rotating.


Note


If you are viewing the HTML version of this guide, click on the images to view them in full-size.


Procedure


Step 1

From the main menu choose Topology.

Step 2

Hover the mouse over the device icon, to quickly view the host name, reachability state, IP address and type of device.

Figure 3. Basic Device Details

View All Device Details

The device icon on your topology map lets you view more details about your device, such as where it is located, what kind of device it is, when it was last updated and more.

Procedure


Step 1

From the main menu choose Topology.

Step 2

To view device details, click on the device icon. The following details are displayed.

Figure 4. Device Details

If you have installed Element Management Functions, the following additional information will be displayed in the Device Details screen.

  • Alarm information under Summary in the Details tab.

  • An Interfaces tab with name, and operational and admin status for each associated interface.

  • A Links tab with the details of the links on the selected device.

  • An Alarms tab displaying information such as severity, source, category, and condition of the alarms. The columns can be customized based on your preferences.

  • An Inventory tab displaying the product name, product ID, admin status, operational status, and serial number. The columns can be customized based on your preferences.

  • A History tab with detailed information about device performance, including various performance metrics for CPU utilization, device memory utilization, device availability and environmental temperature. For each trend, you can choose the required time frame and dates using the Zoom and Date options on the graph. You also have the option to download the details in a PNG or CSV file.


View Detailed Device Inventory

You can get a simplified, consolidated view of detailed inventory data for the devices in your network. This includes details of modules, chassis, cards and interfaces.

Procedure


Step 1

From the main menu, choose Topology.

Step 2

Click the device icon to view the Device details pane for the device.

Step 3

Click the Detailed inventory button on the Device details pane to open the detailed inventory window for the chosen device. You can see the Topology tree view on the left.

Figure 5. Topology Tree View

Step 4

Zoom in to view the different modules and click one for which you need detailed information.

Figure 6. Zoomed modules on the Topology Map

You can view detailed information on the Details, Interface, Alarms, Inventory and History tabs for the chosen module.


Identify Device Routing Details

Device routing determines how data packets are transmitted from one device to another in the network and ensures that data packets reach their intended destination, avoiding congestion or loops in the network.

Note


If you are viewing the HTML version of this guide, click on the images to view them in full-size.


Procedure


Step 1

From the main menu choose Topology.

Step 2

To view the device routing details, on the topology map, click the device icon. You can view the routing details in the right pane.

Figure 7. Device Routing Details


Identify the Links on a Device

You can see which links are connected to the device in the Links tab in the Device Details pane.

Procedure


Step 1

From the main menu choose Topology.

Step 2

To view links on the device, click on the device icon.

Step 3

In the right pane, click the Links tab and expand the right panel to view all the link details.

Figure 8. Links on a Device


Get Details About Topology Links

You can view detailed information about any link on the topology map, such as the link name, source and destination devices, link status, bandwidth, latency, and link details. You can also view link utilization to see how much bandwidth the link is using, as well as packet drops and traffic volume.

View Link Details

You can view the link details such as name, state, type, and endpoint interface information for each link. For more information on the link state, refer to Link States and Discovery Methods

Procedure


Step 1

From the main menu choose Topology.

Step 2

Select a link to view details in any of the following ways:

  • By clicking a link on the topology map

  • By clicking a link from the Links tab in the topology map

  • By clicking a link from the Links tab in the Device Details page.

Figure 9. Link Details

The History tab provides useful insights into the performance and trends of the network. You can select the time interval to analyze the data.

Note


Delay and jitter metrics are available only when Segment Routing Performance Monitoring (SR-PM) is enabled. This requires installing Service Health, which comes with the Crosswork Network Controller Advantage package. For details on enabling SR-PM for links, refer to the Enable SR-PM Monitoring for Links and TE Policies section in the Cisco Crosswork Network Controller 7.0 Service Health Monitoring guide.

Step 3

View aggregate link details.

Click on a dashed line in the topology map. A dashed line indicates an aggregated link that represents more than one link.

Step 4

View IPv4 unnumbered interface information (if available).

IPv4 unnumbered interfaces information is displayed as a combination of the TE Router ID and the index.


View Link Interface Metrics

Link interface metrics are a set of indicators that measure the performance and quality of the communication between two or more network devices. They include parameters such as bandwidth, delay, jitter, packet loss.

Note


Delay and jitter metrics are available only when Segment Routing Performance Monitoring (SR-PM) is enabled. This requires installing Service Health, which comes with the Crosswork Network Controller Advantage package. For details on enabling SR-PM for links, refer to the Enable SR-PM Monitoring for Links and TE Policies section in the Cisco Crosswork Network Controller 7.0 Service Health Monitoring guide.


Link interface metrics can help network administrators to monitor and troubleshoot network issues, optimize network resources, and plan for future network expansion or upgrade.

Procedure


Step 1

From the main menu choose Topology.

Step 2

Click a link on the topology map.

Step 3

To view interface metrics, expand A side or Z side.

The utilization shown on IPv4 and IPv6 links represents the aggregate traffic and packet drops on the interface, not specific to each address family. Sub-interfaces will not show a utilization since they do not have a bandwidth like a physical interface. Traffic measurements will still be collected and displayed.

Figure 10. Link Interface Metrics

Protocols Used for Topology Services

The following table lists the protocols and methods used for obtaining the topology information.

Protocol/Method Provides Use Cases

IGP/ BGP-LS (via SR-PCE)

Real time topology (nodes, links, link metrics, and so on.)

L3 topology visualization

PCEP (via SR-PCE)

Real time LSP status and CRUD of SR-PCE initiated LSPs

  • SR/SRv6, RSVP-TE LSP visualization

  • SR-PCE initiated LSP create/update/delete

SNMP (SNMPv2-MIB, IP-MIB, IF-MIB, LLDP-MIB, (CISCO CDP-MIB) (via CDG)

System info, interface table (interface and SR-TE/RSVP-TE traffic Utilization) IP address table, L2 adjacency information

Device management and details and Crosswork Optimization Engine model building:

  • L2/L3 topology

  • Interface name, admin/oper status

  • Interface and SR policy and RSVP-TE tunnel utilization

CLI (via CDG) - show mpls

TE router ID and so on.

To match the DLM node with the same TE router ID that is learned from the SR-PCE

Enable or Disable Topology Link Discovery

To control the visibility of L2 topology links on the maps, you can change the system settings for the discovery of LLDP, CDP and LAG protocols. These protocols are used to identify the neighboring devices and their connections. The discovery option is disabled by default, which means the links of these protocols, including the ones that were already discovered, will not show up on the maps. You can enable the discovery option to see the links of the selected protocols on the maps.

To enable topology discovery:

Before you begin

  • Make sure all pods are healthy before changing the settings.

Procedure


Step 1

From the main menu, choose Administration > Settings > System Settings.

Step 2

Under Topology, click the Discovery option.

Step 3

Select the checkbox of the protocols for which you want to enable discovery.

Step 4

Click Save to save your changes.


When you enable discovery, the collection jobs will be created. The table below lists the collections jobs created for each protocol setting along with the sensor paths.

Table 2. Collection Jobs for each setting

L2 Configuration Setting

Helios collection Jobs ID

Context ID

MIBs collected

Sensor paths

None (default)

cw.topo_svc

cw.toposvc.snmp

cw. toposvc.snmptraps

IF-MIB, IP-MIB, LAG-MIB

IF-MIB:notification

Note


IF-MIB is required, but it is collected in the ICON jobs.

IP - MIB : IP-MIB / ipAddressTable / ipAddressEntry

IF-MIB:notifications

CDP

cw.topo_svc

cw.toposvc.cdp

IF-MIB, CDP-MIB, LAG-MIB

CISCO - CDP - MIB : CISCO - CDP - MIB

/ cdpCacheTable / cdpCacheEntry

CISCO - CDP - MIB : CISCO - CDP - MIB / cdpInterfaceTable / cdpInterfaceEntry

LLDP

cw.topo_svc

cw.toposvc.lldp

IF-MIB, LLDP-MIB, LAG-MIB

LLDP - MIB : LLDP - MIB / lldpLocPortTable / lldpLocPortEntry

LLDP - MIB : LLDP - MIB / lldpRemTable / lldpRemEntry

LAG

cw.topo_svc

cw.toposvc.lag

IF-MIB, LAG-MIB

IEEE8023 - LAG - MIB : IEEE8023 - LAG - MIB / dot3adAggTable / dot3adAggEntry
IEEE8023 - LAG - MIB : IEEE8023 - LAG - MIB / dot3adAggPortTable / dot3adAggPortEntry

The table below lists the common errors when enabling or disabling topology discovery:

Table 3. Common error scenarios:

Possible Error Scenario

Cause

Cause Recommended Action

After disabling, some of the disabled links are displayed in the maps.

A protocol that is disabled soon after being enabled may cause a problem. The system may stop the collection job for the previous enabled job before it finishes processing the SNMP data. This may lead to a mismatch between the actual and the displayed status of the links. The links that are disabled may still appear as enabled.

Enable and disable the protocol again with sufficient wait time in between, or restart robot-topo-svc.

To restart the robot-topo-svc, refer to Monitor Platform Infrastructure and Application Health.

When you try to enable discovery, the helios job fails and settings are disabled from further editing.

A possible cause of the collection job being stuck in an unsuccessful state is that the helios pod is unhealthy. Crosswork prevents users from modifying the L2 discovery settings while the collection job is in progress. This means that the collection job cannot be canceled or restarted until the helios pod is healthy again.

Ensure that the pods are healthy, and then enable and disable the protocol with sufficient wait time in between,or restart robot-topo-svc.

To restart the robot-topo-svc, refer to Monitor Platform Infrastructure and Application Health.

When you change the discovery settings, the topology UI or topology service crashes resulting in an unpredictable status.

The mechanism to disable users from further editing while the collection job is being created or deleted, relies on pods communicating via Postgres flag. If any pod crashes during this time, the Postgres flag key is not set correctly.

Import and Export Geographical Data

Using Keyhole Markup Language (KML) files, you can import and export the geographic location identifiers for your devices. KML is a format that encodes and stores geographic information for display on a map.

Import Geographical Data to Keynote Markup Language (KML) Format

You can import a KML file containing geographic location identifiers for multiple devices so that they can be displayed on within their geographic context on the topology map. To import a KML file into your application, follow these steps:

Procedure


Step 1

From the main menu, choose Topology.

Step 2

Click to open the Import KML File dialog box.

Step 3

If you have not already created a device KML file to import:

  1. Click the Download KML file (*.kml)' template link and save the KML file template to a local storage resource.

  2. Open the template using your preferred tool. Begin adding rows to the file, one row for each device.

  3. When you are finished, save the new KML file.

Step 4

Click Browse to navigate to the file you just created and then click Open to select it.

Step 5

With the KML file selected, click Import.

Note


While importing the details via UI using a KML file, you should wait for the operation to complete. Clicking the Import button while the operation is in progress will lead to duplicate entries for each device or provider.


Export Geographical Data to Keyhole Markup Language (KML) Format

You can export geographic location identifiers for your devices to a KML file. You can use the exported data in other contexts, if required. To export a KML file, follow these steps:

Procedure


Step 1

From the main menu, choose Topology.

Step 2

In the right pane, click the to export the geographical data to a KML file. The KML file is downloaded to your system's download folder.


Customize your Map for your Needs

You can configure various visual settings in order to customize the map display for your requirements.

Show or Hide Device State

This option allows you to decide whether or not to show the device state on the topology map. You can choose to show or hide the device state according to your preference.

Procedure


Step 1

From the main menu click Topology.

Step 2

Click on the topology map to open the Display Preference dialog box.

Step 3

Click the Devices tab and check the Show Device State checkbox. By default the Device State is enabled and is shown on the map.

Figure 11. Show or Hide Device State

Define the Device Label Type

You can customize how you want to identify the devices on your Network Topology. You can use different label types to identify the devices, such as IP Address, OSPF Router ID, or the default option of device host name.

Procedure


Step 1

From the main menu click Topology.

Step 2

Click on the topology map to open the Display Preference dialog box.

Step 3

Click Devices tab and under View Label As select the desired option from the list of labels. You can select only one label for your devices.

Figure 12. Define the Device Label Type

Differentiate Aggregated Links from Single Links

An aggregated link is a type of link that combines multiple physical links or multiple protocols, such as IPv4 and IPv6, into one logical link. This allows for better bandwidth utilization and redundancy. On the topology map, an aggregated link is shown as a dashed line, while a single link is shown as a solid line. This helps to simplify the network topology and show the logical connections between devices.


Note


Although aggregated, dual stack links show as one single line.


Procedure


Step 1

From the main menu click Topology.

Step 2

Click on the topology map to open the Display Preference dialog box.

Step 3

Click Links tab, toggle to enable the Aggregated Link option.

Figure 13. Aggregated Link

Differentiate all Down Links

To make it easier to identify the links that are not working, you can set your display preferences to view only links that are down.

Procedure


Step 1

From the main menu click Topology.

Step 2

Click on the topology map to open the Display Preference dialog box.

Step 3

Click the Links tab and under Link color based on select the Down state option. All the links that are down will appear in red.

Figure 14. Link color based on Down state

Show Link Health by Color

Link health can be visualized and monitored in the logical and geographical maps. You can assign link colors based on metrics like delay, jitter, packet errors and packet drops.

Note


Delay and jitter metrics are available only when Segment Routing Performance Monitoring (SR-PM) is enabled. This requires installing Service Health, which comes with the Crosswork Network Controller Advantage package. For details on enabling SR-PM for links, refer to the Enable SR-PM Monitoring for Links and TE Policies section in the Cisco Crosswork Network Controller 7.0 Service Health Monitoring guide.


The color thresholds can be customized by administrators. Up to three thresholds can be defined for each metric.

To set color thresholds for a metric:

Procedure


Step 1

From the main menu, choose Administration > Settings > System Settings.

Step 2

Under Topology, click the Metric Thresholds option.

Step 3

For a metric, define the criteria for coloring the links. Each row defines a color and the percentage range that the color will represent.

  • You can enter values in the To fields only. Each row begins automatically from the end of the previous row's range.

  • The thresholds must be sequential, meaning that each row's range must follow on from the previous row's range. For example, for bandwidth utilization, if the range in the first row is 0-25%, the second row's range must end with a value greater than 25.

  • You cannot use the same color for multiple thresholds. For example, you cannot choose Green for both the first and second rows.

Figure 15. Metric thresholds for Bandwidth Utilization

Step 4

Click Save.


Troubleshoot your Topology Map

To resolve any problems with your topology map, you need to check the network connectivity and configuration of your devices. Ensure that they are online and have the correct IP addresses, subnet masks, gateways, and DNS settings. You also need to make sure that your topology map matches the actual physical layout of your network. This will help you to optimize the performance and accuracy of your topology map.

Rebuild the Topology

Rebuilding the topology is a process of creating a new topology for our system. This is useful when the topology becomes inconsistent because of network problems or other unforeseen events. You should only rebuild the topology as a last resort.

The topology rebuild will refresh the topology and update the links and devices. The topology pages will not display links and devices when a rebuild is in progress. They will reappear after the rebuild is complete.

Before you begin

To start the topology rebuild, the system must be in maintenance mode.

Procedure


Step 1

From the main menu, choose Administration > Settings > System Settings.

Step 2

Under Topology, click the Maintenance option.

Step 3

In the Rebuild Topology section, click Rebuild Topology.

Figure 16. Rebuild the Topology

Step 4

To confirm your Topology rebuild, in the Confirm Topology Rebuild pop-up, click Rebuild Topology again.


Find Missing L2 Links

If L2 links are missing, it is important to check the protocol settings and ensure that they are enabled. By default, L2 link discovery is not enabled, so you may need to manually enable it in order to discover L2 links. Once the protocol settings are correctly configured, you should be able to discover and view L2 links in your network. For more information refer to Enable or Disable Topology Link Discovery.

Procedure


Step 1

From the main menu, click Administration > Settings > System Settings.

Step 2

Under Topology, click the Discovery option.

Figure 17. L2 Link Discovery

Step 3

Select the desired option and click Save.

Step 4

If the L2 links are not visible, ensure that the following configurations are checked:

  1. PCE Configuration

    • Configuring the PCE IP Address. Ensure the IP `198.19.1.201` is assigned to one of the loopback interfaces on the device.

      pce
       address ipv4 198.19.1.201
      
    • Configure the API user with the following credentials:

       api
        user cisco
         password encrypted 121A0C041104
      
    • Configure PCE sibling.

      Ensure the sibling PCE is correctly configured and visible.

      sibling ipv4 11.1.201.202
  2. Verify the Sibling PCE Connectivity.

    Ensure that the sibling PCE is connected

    RP/0/RP0/CPU0:pce-1#show pce api sibling connection

    Result:

    Address:                   11.1.201.202
    Connected:                        Yes
    Input buffer size:                  0
    Packets in output buffer:           0
    
  3. PCC Configuration for PCEP Peering

    For the head-end node to become a PCEP peer, the following configurations are necessary:

    segment-routing
     traffic-eng
      pcc
       source-address ipv4 198.19.1.4
       pce address ipv4 198.19.1.201
       precedence 100
       pce address ipv4 198.19.1.202
       precedence 100
       report-all
    
  4. Verify PCEP Session

    Ensure the PCEP session is up and running

    • On PCE

      RP/0/RP0/CPU0:pce-1#show pce ipv4 peer 198.19.1.4
    • On PCC

    Node-4#show segment-routing traffic-eng pcc ipv4 pee

    Result:

    Peer address: 198.19.1.201,
      Precedence: 100, (best PCE)
      State up
      Capabilities: Stateful, Update, Segment-Routing, Instantiation, SRv6
    
    Peer address: 198.19.1.202,
      Precedence: 100
      State up
      Capabilities: Stateful, Update, Segment-Routing, Instantiation, SRv6
    
In case the L2 links are still missing, consider rebuilding your topology. Refer to Rebuild the Topology

Missing L3 Links

One of the possible reasons for missing L3 links is a device level issue. This means the SR-PCE cannot learn the IGP information for that device. Some of the factors that can cause a device level issue are hardware failure, software bugs, misconfiguration, or interference. To troubleshoot this problem, you should first check the device status and logs for any errors or warnings. Then check the IGP configurations for that device and check if the SR-PCE has that device in its topology.

Procedure


Step 1

From the main menu, click Administration > Manage Provider Access.

Step 2

Under Reachability column, ensure that the providers are reachable.

Figure 18. Manage Provider Access

Step 3

If the L3 links are not visible, ensure that the following configurations are checked:

  • If a link is missing in the topology UI, ensure that the ISIS/OSPF neighbor relationship is up using the below configurations:

    RP/0/RP0/CPU0:Node-4#show isis neighbors
    Result:
    IS-IS 1 neighbors:
    System Id      Interface        SNPA           State Holdtime Type IETF-NSF
    Node-7         Gi0/0/0/0        *PtoP*         Up    23       L2   Capable
    
    RP/0/RP0/CPU0:Node-7#show isis neighbors

    Result:

    IS-IS 1 neighbors:
    System Id      Interface        SNPA           State Holdtime Type IETF-NSF
    Node-4         Gi0/0/0/1        *PtoP*         Up    22       L2   Capable
    
  • Ensure that the link is configured with point-to-point:

    router isis 1
    interface GigabitEthernet0/0/0/0
      point-to-point
    
  • Ensure that the link is visible in PCE:

    show pce ipv4 topology 198.19.1.4
    Result:
    Node 30
      Link[2]: local address 10.4.7.4, remote address 10.4.7.7
    

In case the L2 links are still missing, consider rebuilding your topology. Refer to Rebuild the Topology


Error Record in Alarm/Events Report of Topology Services

The topology service may encounter errors during its operation, such as missing or incorrect data, communication failures, or configuration issues. These errors are recorded in the alarms/events report, which can help you to diagnose and resolve the problems.

Procedure


Step 1

From the main menu, click Administration > Alarms.

Step 2

Enter "topo" in the Source filter. This will display only the alarms and events related to the Topology.

Figure 19. Alarm Events Report of Topology Service