Configure Debug Collection for CUBE and TDM Gateways
Available Languages
Contents
Introduction
This document describes some of the best practices to collect Voice Debugs in Cisco IOS®/IOS XE® Voice Router.
Prerequisites
Requirements
- Privileged Access to execute commands in the ISR Routers.
- Prior experience with Voice-over-IP (VoIP) protocols is desired.
- For VoIP Trace, a minimum of Cisco IOS XE 17.4.1 or 17.3.2 is required.
- Basic knowledge in Cisco IOS/IOS XE inside Integrated Services Routers (ISR).
Components Used
For the purpose of this document, the components used are:
- PuTTY
- Cisco ISR 3925
- Cisco ISR 4451
The information in this document was created from the devices in a specific lab environment. All of the devices used in this document started with a cleared (default) configuration. If your network is live, ensure that you understand the potential impact of any command.
Background Information
The process of debug collection in these platforms has challenges and can potentially impact the performance of the device. The challenges and risks increase when there are multiple active calls established in a voice router. In some scenarios, if the debugs are not collected correctly, it can lead to high CPU that can cause damage to the capacity of the router and even trigger a software crash. This document discusses the differences between a Cisco Unified Border Element (CUBE) and a Time-Division Multiplexing (TDM)/Analog Gateway.
TDM Voice Gateways versus CUBE
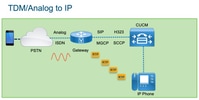
TDM voice gateways are mainly used to interconnect an internal phone system with another Private Branch Exchange (PBX) or the Public Switched Telephony Network (PSTN). The type of connections that are used in TDM gateways are T1/E1 Controllers (ISDN or CAS) and Analog circuits such as FXS and FXO ports. A Digital Signal Processor (DSP) converts the audio from its raw form into RTP packets. In a similar way, RTP packets are converted to raw audio after DSP has processed the RTP packets and sends the audio to the specific circuit. These gateways interoperate with H323, MGCP or Skinny Call Control Protocol (SCCP) on the VoIP side, and on the TDM side. Its either ISDN PRI circuits or Analog as the most common connections to the PSTN or endpoints.
As shown in the image, the TDM Gateways provide a bridge between your internal VoIP infrastructure and the Analog or ISDN Service Providers:
With the introduction of VoIP, customers rapidly changed their legacy systems to a modern VoIP infrastructure. The same occurred on the Service Provider side, where they now use connections to interconnect On-Premises Telephony services with the Service Provider VoIP infrastructure and expand their capabilities to provide better services. The most common VoIP protocol used today is the Session Initiation Protocol (SIP), and is currently widely used by customers and Internet Telephony Service Providers (ITSP) across the world.
CUBE was introduced to provide a way to interconnect those internal VoIP systems with the external world through the ITSPs with SIP as the primary VoIP Protocol. CUBE is simply an IP-IP Gateway where it no longer requires any TDM type of connection like T1/E1 Controllers or analog ports. CUBE runs on the same platforms as TDM Gateways.
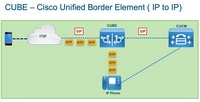
Most common VoIP Protocol used is SIP, for call establishment and teardown of the calls, and RTP for media transport. In CUBE there is no need of a DSP unless a transcoder is required. The RTP traffic flows end to end from the ITSP to the endpoint, and CUBE acts as the middle-man with address hiding as one of the many features it offers.
As shown in the image, CUBE provides a division between your internal VoIP infrastructure and the SIP ITSP:
Collection of Cisco IOS/IOS XE Voice Debugs
Voice features run on a different list of platforms, like ISR, ASRs, CAT8Ks, amongst others; however, they use a common software which is either Cisco IOS or Cisco IOS XE (the differences between Cisco IOS and Cisco IOS XE are not covered in this article). These are the basics on how to access the Cisco IOS Router.
How to Access a Cisco IOS/IOS XE Router via Command Line Interface (CLI)
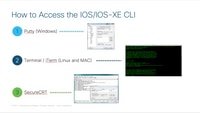
Routers, like any other CLI based devices, require a terminal monitor to gain access to run the commands through Secure Shell (SSH) or Telnet. SSH is the most common protocol used nowadays to access the devices given. It provides a secure and encrypted connection to the device. Some of the common terminal monitors used to access the CLI of the routers are:
How to Set the Terminal Monitor to Collect Show Commands or Debugs
There are different ways to collect the output from the CLI. The recommendation is to export the information from the CLI off the Router to a separate file. This makes it easier in order to share the information to external parties.
A couple of ways to collect the outputs from the device are:
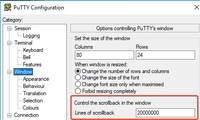
- Dump all the output in the terminal. You need to ensure there are enough lines of scrollback, otherwise, the scrollback misses the first sections of the output and the data can be incomplete. In order to increase the scrollback lines in Putty, navigate to Putty Configuration > Window > Lines of Scrollback. Normally, this is set to a very high value in order to have enough scrollback output:
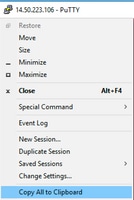
Later, you can collect the information from the terminal monitor with the Copy All to Clipboard option and paste the output into a text file:
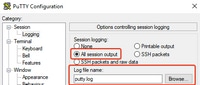
- Another option is to log the entire session output to a .txt file. With this option, all commands entered, and outputs collected, are immediately logged to the text file. This is a common practice in order to log all output in a session. In order to log all session output to a file in Putty, navigate to Putty Configuration > Session > Logging and then select All Session Output as follows:
Collect Basic Show Command Output from the CLI
Show commands are required to collect basic information from the router before any debug collection occurs. Show commands are quick to collect, and for the most part, do not have any impact in performance on the router. Isolation of the problem can start immediately by running a show command.
Once connected to the router, the terminal length can be set to 0. This allows for quicker collection to display all output at once, and avoid the use of the space bar. One command that collects detailed information on the router is show tech, and alternatively, you can collect show tech voice, which shows more specific data to voice features enabled on the router:
Router# terminal length 0
Router# show tech
!or
Router# show tech voice
Router# terminal default length !This cmd restores the terminal length to default
Collect Debug Output from the CLI
Debug output collection in Cisco IOS/IOS XE can sometimes be a challenge as there is risk of a router crash. Some best practices are explained in the next sections to avoid some of these issues.
Memory Check
Before enabling any debugs, you must ensure there is enough memory to store the output in the buffer.
Run the show process memory command to determine how much memory you can allocate to log all output in the buffer:

Tip: Use the command terminal length default or terminal length to go back to a limited amount of lines displayed in the terminal.
Router# show process memory
Processor Pool Total: 8122836952 Used: 456568400 Free: 7666268552
lsmpi_io Pool Total: 6295128 Used: 6294296 Free: 832
In this example, there is 7666268552 bytes (7.6 GB) available to be used by the router. This memory is shared by the router amongst all system processes. This means you cannot use all the available free memory to log the output in the buffer, however, you can use a good amount of system memory as needed.
Most of the scenarios require at least 10 MB to collect enough debug output before the output is lost or overwritten. In rare occasions, a larger amount of data is required for collection. In those scenarios, you can receive 50 MB to 100 MB worth of output in the buffer, or you can go higher if there is available memory.
If free memory is low, there potentially is a memory leak issue. If this is the case, engage the Architecture TAC team to revise what the cause of the low memory can be.
Central Processing Unit (CPU) Check
The CPU is affected by the amount of processes, features, and calls active in the system. The more features or calls active in the system, the busier the CPU.
A good benchmark is to ensure the router has the CPU at 30% or less, which means you can safely enable debugs from basic to advanced (always keep an eye on the CPU when advanced debugs are used.) If the router CPU is around 50%, basic debugs can be run, however, always monitor the CPU. If the CPU reaches higher than 80%, immediately stop debugs (shown later in this article) and engage TAC for assistance.
Run the show process cpu sorted | exclude 0.00 command to review the last 5s, 60s, and 5 mins CPU values along with the top processes.
Router# show processes cpu sorted | exclude 0.00
CPU utilization for five seconds: 1%/0%; one minute: 0%; five minutes: 0%
PID Runtime(ms) Invoked uSecs 5Sec 1Min 5Min TTY Process
211 4852758 228862580 21 0.15% 0.06% 0.07% 0 IPAM Manager
84 3410372 32046994 106 0.07% 0.04% 0.05% 0 IOSD ipc task
202 3856334 114790390 33 0.07% 0.05% 0.05% 0 VRRS Main thread
In the output, the router does not have much activity, CPU is low, and debugs can safely be enabled.

Caution: Pay close attention to the top CPU processes that are active. If the CPU is at 50% or higher, and the top process is a Voice process only, basic debugs can be enabled. Continuously monitor the CPU with the command to ensure the overall performance of the router is not affected.
Current Active Calls Check
Each router has different capacity thresholds. It is important to check how many calls are active in the router to ensure it is not close to maximum capacity. The Cisco Unified Border Element Version 12 Data Sheet provides information on the capacity of each platform for reference.
Run the show call active total-calls command to have an idea on how many calls are active in the system:
Router# show call active total-calls
Total Number of Active Calls : 0
Run the show call active voice summary command to receive more detailed information of the call types that are active:
Router# show call active voice summary
Telephony call-legs: 0
SIP call-legs: 0
H323 call-legs: 0
Call agent controlled call-legs: 0
SCCP call-legs: 0
STCAPP call-legs: 0
Multicast call-legs: 0
Total call-legs: 0
Some common values are:
- Telephony Call-Legs: TDM Gateway calls, this includes Analog and PRI/ISDN calls.
- SIP Call-Legs: Total SIP Calls; if this is a CUBE Router, this shows two call legs per call. Divide the total calls by two to receive an accurate number.
- H323 Call-Legs: Total H323 calls.
- SCCP Call-Legs: Cisco Unified Communications Manager (CUCM) Controlled Media Resources used in the router such as Transcoder and MTPs.
Logging Buffer Settings
To configure the router to store debug output in the buffer, the configure terminal mode is entered to manually tweak the settings in the CLI. This configuration has no impact to the router, however, as shown in previous sections, show tech or show running-config commands from the router is required if the event in the configuration must be rolled back.
This is a configuration example, which is a common baseline used by TAC Engineers. This allocates 10 MB of buffer memory but it can be increased as needed:
# configure terminal
service timestamps debug datetime msec localtime show-timezone year
service timestamps log datetime msec localtime show-timezone year
service sequence-numbers
logging buffered 10000000
no logging console
no logging monitor
logging queue-limit 10000
logging rate-limit 10000
voice iec syslog
These commands accomplish such tasks:
- service timestamps debug or log: Ensures local router times are written on every logged message with millisecond accuracy. This is useful to find calls based on time. millisecond timestamps, which allows you to group debug lines into logical related events when two lines occur within the same millisecond.
- service sequence-numbers: Writes the sequence number of the debug in the line. This is useful (required) when logs are forwarded to a syslog server. This very useful to identify if any debug message to the syslog server has been dropped in the network. The sequence number is the first item in the debug before the timestamp and log message. This is different from the timestamp/sequence number syslog servers can write locally in their files.
- logging buffer: Tells the router to send debugs to the local buffer memory. The buffer size is set in bytes. In the configuration, the buffer size was set to 10 MB.
- no logging console and no logging monitor: No log messages are printed in the console or terminal monitor. If these commands are not configured, they can be detrimental to the performance of the router and debug output accuracy.
- voice iec syslog: Enables Voice Internal Error Code messages to determine disconnect reasons.
Configure Syslog Settings
Sometimes issues can be random and require a way to continuously collect debugs until the event happens. When you store debugs in the buffer, it collects them continuously. It is limited to the amount of memory you can allocate and once it reaches that amount of memory, the buffer circles and drops the oldest messages, which leads to incomplete valuable information required to isolate the issue.
With syslog, the router can send all debug messages out to an external server where the syslog server software stores it in text files. Although, this is a good way to collect the debug output, it is not the preferred method for log collection. Syslog servers tend to skip or drop lines from the received output due to congestion in the server. Since debug outputs can overwhelm the server or packets can drop due to network conditions. However, in some scenarios, syslogs are the only way to make progress on an issue.
If possible, use a reliable transport method such as TCP to avoid any loss of information and as a suggestion, connect the syslog server to the same switch where the router is connected, or as close as you can to the router. This does not guarantee all data is stored in the files, but reduces the chance of data loss.
By default, syslog servers use UDP as the transport protocol on port 514:
#configure terminal
service timestamps debug datetime msec localtime show-timezone year
service timestamps log datetime msec localtime show-timezone year
service sequence-numbers

!Optional in case you still want to store debug output in the buffer.
logging buffered 10000000

no logging console
no logging monitor

logging trap debugging

!Replace the 192.168.1.2 with the actual Syslog Server IP Address
logging host 192.168.1.2 transport [tcp|udp] port <port>
Once the commands are configured, the router immediately forwards messages to the syslog server IP address.
Debug Collection
Once debugs are enabled, the buffer must be cleared before the issue is reproduced. This is done to ensure output is as clean as possible and to avoid extra data that is not required for analysis. Run the clear log command, as this ensures the buffer is cleared. If there are other calls active in the router and the debugs are enabled, the output immediately prints in the buffer:
Router# clear log
Clear logging buffer [confirm]
Router#
After the issue is reproduced, disable the debugs immediately to stop additional output in the buffer, then, collect the logs. You can dump all output in the terminal with these commands:
Router# undebug all
Router# terminal length 0
Router# show log
Sometimes PuTTY closes as it does not handle all outputs at once. This is normal and it does not mean a failure has transpired. If this happens, reopen the session again, and continue normally. In scenarios where the logging buffer is too large or the terminal monitor crashes due to the amount of data that must be printed, copy the buffer output to an external device directly with the show log | redirect command:
Router# show log | redirect ftp://username:password@192.168.1.2/debugs.txt
This command copies the entire buffer output to an FTP IP Address of: 192.168.1.2 with the file name debug.txt. The file name must always be specified. Other destinations available to export data are:
Router# sh log | redirect ?
bootflash: Uniform Resource Locator
flash: Uniform Resource Locator
ftp: Uniform Resource Locator
harddisk: Uniform Resource Locator
http: Uniform Resource Locator
https: Uniform Resource Locator
nvram: Uniform Resource Locator
tftp: Uniform Resource Locator
Which Debugs can be Enabled in Voice Routers
Each call flow and type of features (TDM, CUBE or SCCP Media Resources) are different and there are specific debugs to enable. All debugs required must be enabled concurrently. When only one debug is captured at a time, it is ineffective and provides more confusion when the data is analyzed.
Debugs are enabled inside the CLI executive prompt level Router#, which requires you to have privileged execution mode permissions.
There are basic and advanced debugs and basic debugs are used to gather signaling information either in SIP, H323, or MGCP. This shows the conversations the router has with its peer devices.
Advanced debugs are quite detailed and are used to gather additional information if the internal stack errors cannot show basic debugs. These debugs are normally CPU-intensive.
Internal Call Control API (CCAPI) Debug
Inside each Cisco IOS/IOS XE Router, there is a call control API which is in charge of the communication between different VoIP applications or protocols. The Data Plane components such as RTP, DSP, Voice Cards, amongst others capture data from this layer. There is one specific debug that can be used:
debug voip ccapi inout
There are other options for this debug; however, running the debug voip ccapi inout command covers all basic dial-plan and call establishment information that is normally more than enough to understand what are the states of this layer.
Tip: debug voip ccapi inout usually has minimal impact to the CPU of the router and it is recommended to enable along with any signaling debugs in order to provide a complete set of logs with information of the call(s) and its different states.
SIP Call Flows
These debugs are commonly used for SIP call flows and can be enabled inside CUBE and TDM Gateways with a SIP Leg between the router and CUCM or any other SIP server or proxy.
Basic SIP Debugs
debug ccsip messages
debug ccsip error
debug ccsip non-call !Optional, applies for SIP OPTIONS and SIP REGISTER Messages.
Advanced SIP Debugs
debug ccsip all
debug ccsip verbose
debug voice ccapi inout
Digital (PRI, BRI) Call Flows
These debugs apply for Primary Rate Interfances (PRI) T1/E1 or Basic Rate Interfaces (BRI):
Basic Digital Debug
debug isdn q931
Advanced Digital Debug
debug isdn q921
Analog Call Flows
These debugs are used when Analog circuits involve Foreign eXchange Subscriber (FXS) or Foreign eXchange Office (FXO) ports:
debug vpm signal
debug voip vtsp all
MGCP Call Flows
These debugs are used when MGCP is used as the Voice Protocol between a Voice Gateway and CUCM.
Basic Debugs
debug mgcp packets
debug mgcp errors
CCM-Manager Debugs
The ccm-manager debugs are used to track the configuration download, and MoH and PRI/BRI backhaul messages between CUCM and the Voice Gateway. These debugs are used on as needed basis and are dependent on the failure scenario:
debug ccm-manager backhaul !For PRI and BRI Deployments
debug ccm-manager errors
debug ccm-manager events
debug ccm-manager config-download !Troubleshoot Configuration download issues from CUCM TFTP
debug ccm-mananger music-on-hold !Troubleshoot internal MoH Process
Advanced MGCP Debugs
debug mgcp all
H323 Call Flows
Although H323 is not widely used, there are still some deployments with H323 configured:
Basic H323 Debugs
debug h225 asn1
debug h245 asn1
debug h225 events
debug h245 events
Advanced H323 Debugs
debug cch323 h225
debug cch323 h245
debug cch323 all
SCCP Media Resources
These debugs are used to troubleshoot SCCP Media Resources issues which involve Media Termination Point (MTP) or Transcoders registered to a CUCM server:
Basic SCCP Debugs
debug sccp messages
debug sccp events
debug sccp errors
Advanced SCCP Debug
debug sccp all
VoIP Trace
With the introduction of Cisco IOS XE 17.4.1 and 17.3.2, there is a new option to capture Voice logs inside the Cisco Unified Border Element (CUBE). This new feature is called VoIP Trace. This is a new serviceability framework created to log SIP signaling and events without the need to enable any debugs.
VoIP Trace is enabled by default and can be disabled at any time as needed. VoIP Trace captures specific information for SIP Calls only:
- SIP Errors
- Dial Peer matched
- RTP ports Allocated
- IEC errors correlation with SIP Signaling
- SIP Messages for SIP Trunk to Trunk calls
- Finite State Machines (FSM) states and events
- Events and API calls from SIP Layer to other layers in CUBE
- Call Control (Unified Communication call flows processed by CUBE)
Restrictions
VoIP Trace does not log information related to out-of-dialog SIP messages:
- REGISTER
- OPTIONS
- SUBSCRIBE/NOTIFY
- INFO
VoIP Trace in HA is supported, however, these caveats apply:
- Standby router has VoIP Trace enabled by default. Only applicable traces for Standby process are presented until it becomes active.
- Once Standby is Active, it does NOT contain full traces from checkpointed calls, and only new calls.
- show voip trace <key> still works on the Standby Router and displays cover buffer and media stream data for calls.
How to Enable VoIP Trace
As mentioned, this feature is enabled by default. To enable this feature, run these commands:
Router# configuration terminal
Router(config)# voice service voip
Router(conf-voi-serv)# trace
Router(conf-serv-trace)#
How to Disable VoIP Trace
To disable this feature, run these commands:
Router(conf-serv-trace)# no trace
!or
Router(conf-serv-trace)# shutdown
Caution: After VoIP Trace is disabled, all memory is cleared and information is lost.
The commands available inside the trace configuration mode are:
Router(conf-serv-trace)# ?
default       Set a command to its defaults
  exit          Exit from voice service voip trace mode
  memory-limit  Set limit based on memory used
  no            Negate a command or set its defaults
  shutdown      Shut Voip Trace debugging
Configure Memory Limit
The memory-limit determines how much memory is used by VoIP Trace to store data. By default, it is 10% of the available memory in the platform, however, this can be adjusted to a max of 1 GB and a min of 10 MB. The memory is allocated dynamically, as the feature only uses memory as needed and is dependent on call volume. Once it reaches the maximum memory available, it circles around and deletes older entries.
When the memory limit is modified to be greater than the 10% available memory, a message is displayed on the CLI:
Router(conf-serv-trace)# memory-limit 1000
Warning: Setting memory limit more than 10% of available platform memory (166 MB) will affect system performance.
To set the default to 10% memory usage, run the memory-limit platform command:
Router(conf-serv-trace)# memory-limit platform
 Reducing the memory-limit clears all VoIP Trace statistics and data.
 If you wish to copy this data first, enter 'no' to cancel,
 otherwise enter 'yes' to proceed. Continue? [no]:
How to Display VoIP Trace Data
To display the data from VoIP Trace, you must use specific show commands. The data can be displayed in the same terminal session or can be sent via syslog to an off-box syslog server.

Note: Traces are dumped after 32 seconds from the time a BYE is received for a call.
The SIP signaling is displayed per leg and is not combined like regular debugs. Regular debugs such as debug CCSIP messages, display the SIP signaling of a call in the exact order the events happened. In VoIP Trace, each leg is separate, to determine the right order, the timestamps are used.
To view the available data, run these commands:
Router# show voip trace ?
  all            Display all VoIP Traces
  call-id        Filter traces based on Internal Call Id
  correlator     Filter traces based on FPI Correlator
  cover-buffers  Display the summary of all cover buffers
  session-id     Filter traces based on SIP Session ID
  sip-call-id    Filter traces based on SIP Call Id
  statistics     Display statistics for VoIP Trace
Show VoIP Trace All
This command displays all VoIP Trace data available in the buffer. By using this command, it impacts the performance of the router. Once the command is entered, a warning message displays to alert on risks if you continue:
Router# show voip trace all
 Displaying 11858 cover buffers
 This may severely impact system performance.
 Continue? [yes/no] no
Show VoIP Trace Cover-Buffers
This command displays an overview of call details for all calls reported under VoIP Trace. Each call leg has a cover buffer created that contains a summary of the calls logged:
Router# show voip trace cover-buffers
------------------ Cover Buffer ---------------
Search-key = 8845:3002:659
Timestamp = *Sep 30 01:17:33.615
Buffer-Id = 1
CallID = 659
Peer-CallID = 661
Correlator = 4
Called-Number = 3002
Calling-Number = 8845
SIP CallID = 20857880-1ec12085-13b930-411b300a@10.48.27.65
SIP Session ID = 2b1289c400105000a0002c3ecf872659
GUID = 208578800000
-----------------------------------------------

------------------ Cover Buffer ---------------
Search-key = 8845:3002:661
Timestamp = *Sep 30 01:17:33.634
Buffer-Id = 2
CallID = 661
Peer-CallID = 659
Correlator = 4
Called-Number = 3002
Calling-Number = 8845
SIP CallID = 8D6DEC28-1F111EB-829FD797-1B22F6DB@10.48.55.11
SIP Session ID = 0927767800105000a0005006ab805584
GUID = 208578800000
-----------------------------------------------
For more information on each field, refer to the next table:
| Field |
Description |
| Search-Key |
Contains a combination of calling, called number, and call-id |
| Timestamp |
Creation time of cover buffer |
| Buffer-ID |
Buffer ID of the cover buffer |
| Call-ID |
Call-ID of the respective call leg to the cover buffer |
| Peer-Call-ID |
Call-ID of the peer leg |
| Correlator |
FPI correlator of the call |
| Called-Number |
Called number of the respective call-leg of the cover buffer |
| Calling-Number |
Calling number of the respective call-leg of the cover buffer |
| SIP Call-ID |
SIP call-ID of the respective call leg of the cover buffer |
| Sip Session ID |
SIP session ID of the respective call leg of the cover buffer |
| GUID |
GUID of the respective call of the cover buffer |
| Anchor Leg |
Anchor leg is set to 'Yes,' if the respective call-leg is an anchor leg in the call forking flow or media proxy deployment |
| Forked Leg |
Forked leg is set to 'Yes,' if the respective call-leg is an anchor leg in the call forking flow or media proxy deployment |
| Associated CalI-IDs |
Call-ID of the associated forked legs |
To filter the cover buffers, run the include and section commands:
Router# show voip trace cover-buffers | include Search-key | 8845 | 3002
Search-key = 8845:3002:661
!or
Router# show voip trace cover-buffers | section Search-key | 8845 | 3002
Search-key = 8845:3002:661
Show VoIP Trace Call-Id
In combination with the previous command, show voip trace call-id can be used to find calls. Once the call-id is identified, the next command can be run to display all information on the specific call leg:
Router# show voip trace cover-buffers | include Search-key | 8845 | 3002
Search-key = 8845:3002:661
Router# show voip trace call-id 661
Show VoIP Trace Statistics
This show command displays detailed output on status, memory consumption, errors/failure calls, successful calls, timestamps of newest and oldest entries and more:
Router# show voip trace statistics
VoIP Trace Statistics
Tracing status             : ENABLED at *Sep 12 06:44:02.349
Memory limit configured    : 803209216 bytes
Memory consumed            : 254550928 bytes (31%)
Total call legs dumped     : 2
Oldest trace dumped        : *Sep 12 07:29:21.077 Search-key: 9898:30000:64
Latest trace dumped        : *Sep 12 07:29:21.010 Search-key: 9898:30000:63
Total call legs captured   : 11858
Total call legs available  : 11858
Oldest trace available     : *Sep 12 06:57:23.923, Search-key: 5250001:4720001:11
Latest trace available     : *Sep 13 05:08:25.353, Search-key: 19074502232:30000:13177
Total traces missed        : 0
For more information on each field, reference the next table:
| Field |
Description |
| Tracing Status |
Displays tracing status, which includes the time and date VoIP trace was enabled. |
| Memory Limit Configured |
Displays the configured memory limit. This is 10% of the processor pool memory size. |
| Memory Consumed |
Displays amount of memory dynamically consumed for VoIP Trace. |
| Total Call Legs Dumped |
Displays the number of failed call legs dumped into the logging buffer. Dumped calls refers to call legs associated with IEC errors. |
| Oldest Trace Dumped |
Displays timestamps and search key of the oldest failed call since VoIP Trace was enabled. |
| Latest Trace Dumped |
Displays timestamps and search key of the latest failed call since VoIP Trace was enabled. |
| Total Call Legs Captured |
Displays total legs captured after VoIP Trace is enabled. |
| Total Call Legs Available |
Displays total call legs available in the history. This can be the same or different compared to the total call legs captured, this depends on the memory limit. |
| Oldest Trace Available |
Displays timestamp and search key of the oldest cover buffer available in the memory. |
| Latest Trace Available |
Displays timestamp and search key of the latest cover buffer available in the memory. |
| Total Traces Missed |
Displays number of call legs missed due to memory limit. |
Additional Show Commands
| Field |
Usage |
Description |
| show voip trace correlator <correlator> |
show voip trace correlator 4 |
Filters and displays VOIP Trace for a specific call-id starting from the cover buffer. |
| show voip trace session-id <session-id> |
show voip trace session-id 87003120822b5dbd8fd80f62d8e57c48 |
Filters and displays VOIP Trace for a call based on the SIP Session-ID. Either local or remote UUID from the session-ID header of the SIP message can be used to display both the legs of the call. |
| show voip trace sip-call-id <call-id> |
show voip trace sip-call-id 01e60dfa9d8442848336d79e3155a8a1 |
Filters and displays VOIP Trace based on the SIP Call-ID. |
Revision History
| Revision | Publish Date | Comments |
|---|---|---|
4.0 |
17-Aug-2026
|
Updated Introduction, spelling, grammar, inserted horizonal lines to separate sections for readability, fixed CCW errors. |
3.0 |
13-Feb-2025
|
Updated branding Requirements, style requirements, formatting and grammar. |
2.0 |
13-Apr-2023
|
Added Alt Text.
Updated Title, Introduction, Branding Requirements, Style Requirements, Gerunds, Formatting and Grammar. |
1.0 |
13-Aug-2021
|
Initial Release |

 Feedback
Contact Cisco
- Open a Support Case

- (Requires a Cisco Service Contract)