Introduction
This document describes how to troubleshoot Jabber audio issues with Wireshark.
Prerequisites
Requirements
Cisco recommends that you have knowledge of these topics:
- SIP signaling
- Jabber call flows
- Wireshark and basic knowledge of packet filtering
Components Used
The information in this document is based on these software and hardware versions:
- Jabber for Windows 15.0.2
- CUCM 15su2
- Wireshark 4.4.7
The information in this document was created from the devices in a specific lab environment. All of the devices used in this document started with a cleared (default) configuration. If your network is live, ensure that you understand the potential impact of any command.
Troubleshoot
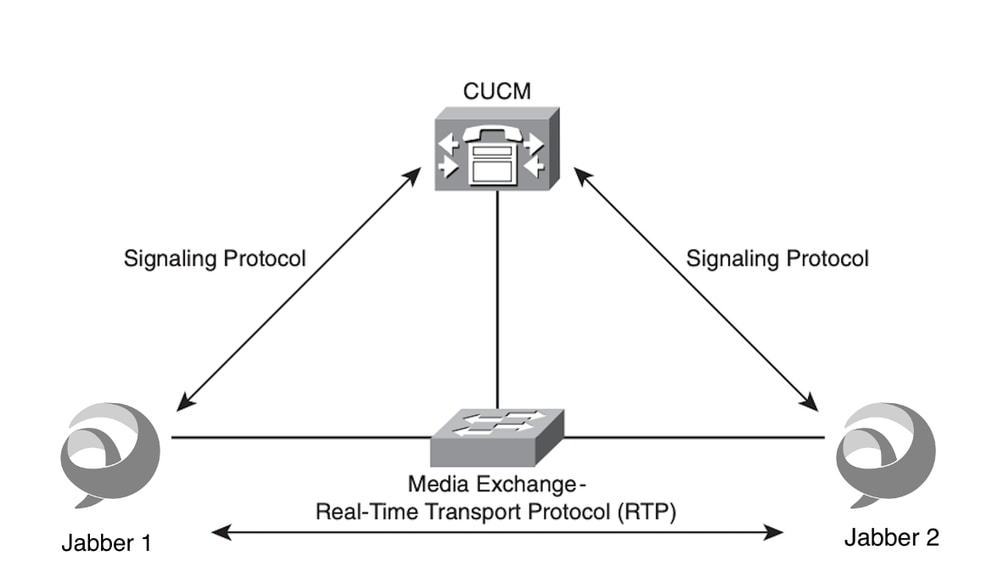
1. Identify and isolate the affected call flow. This is an important step as this determines the network devices involved in the issue. The media do not always use the same path as the SIP signaling, thus, it is crucial to understand the affected call flow. For the purpose of this document, you use as a reference a point-to-point call between 2 Jabber clients registered to CUCM, however, this basic troubleshoot applies to multiple scenarios.
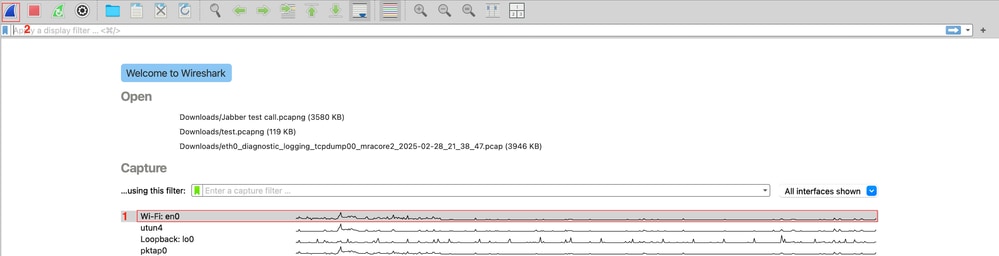
2. Open Wireshark, select the correct network interface and start Wireshark packet captures on the affected device.
3. Replicate the issue and note important information such as timestamp, called number, calling number, and any specific error or behavior during the call.
4. Stop and save the Wireshark packet capture.

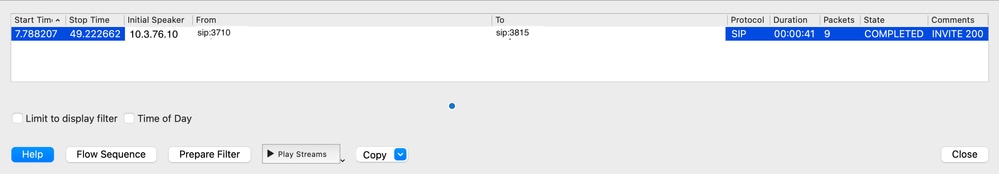
5. Open the packet capture and navigate to Telephony > VoIP Calls > Identify the test call and click Play Streams.
- Wireshark launchs the RTP Player. The RTP Player is a built-in tool in Wireshark that lets you reconstruct and play back audio from captured RTP streams. It is commonly used in VoIP troubleshooting to:
- Verify if both parties had audio.
- Detect one-way audio.
- Hear quality problems such as choppiness, silence, distortion, or robotic voice (often caused by jitter or packet loss).
The RTP player shows the RTP streams linked to the call. Click the Play button to hear the RTP streams. Remember the packets are collected directly in the device’s network interface. This way you can quickly identify if client PC sends or receives a bad RTP stream.
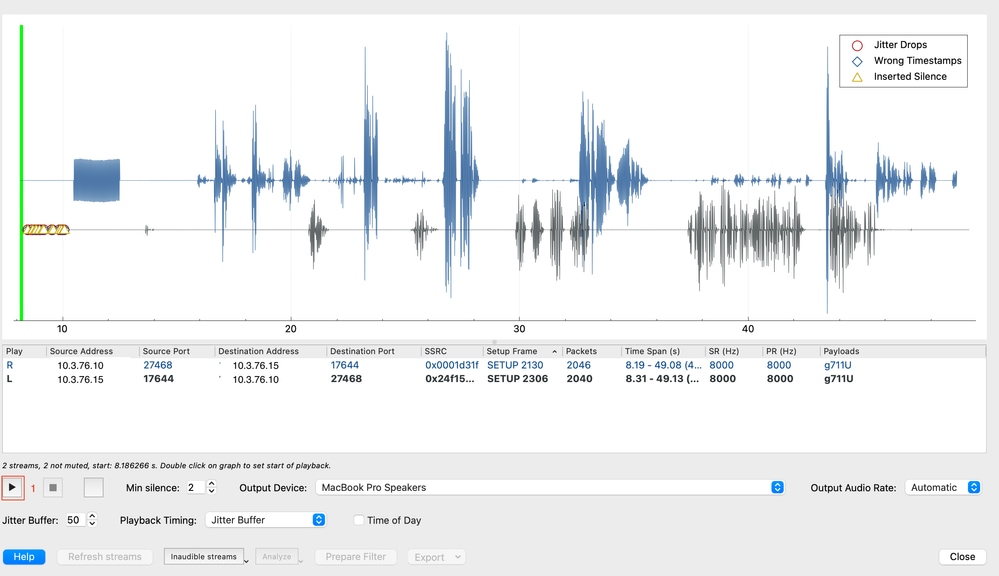
- For this test call, the end user reports choppy voice from the called device. That is the same behavior you can hear when you play the streams. To analyze further, select the received stream and click the Analyze button. Wireshark provides relevant statistics that help you to understand better this behavior.
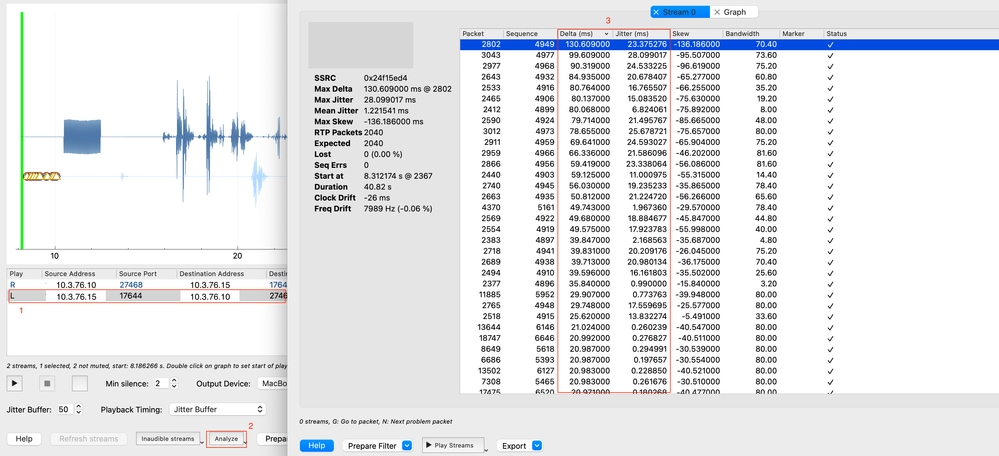
- The RTP Stream Analysis shows 3 main parameters: packet loss, delta time and jitter. In this case, the cause of the issue is the high delta time and jitter, the issue is not caused by Jabber itself but the network. The sysmptoms can vary, however, the information obtained from the packet capture is enough to engage your network team and find the root cause of the issue. Most common issues are listed in this table:
|
Issue
|
Symptoms
|
Common Causes
|
|
Jitter
|
Choppy audio, robotic voice, gaps
|
Network congestion, no QoS
|
|
Packet Loss
|
Clipped words, silence, robotic sound
|
Overloaded links, drops, wireless interference
|
|
Latency (Delay)
|
Lag, talk-over, echo problems
|
Long routing paths, queuing, network congestion
|
|
One-way audio
|
No audio from the far end
|
Network block, FW policies, Nat issues
|
 Feedback