Log Settings Configuration and Status on WAP121 and WAP321 Access Points
Available Languages
Objective
System logs are sets of messages which record system events. Logs help you to administer the status of the device. They are also used to debug the packet flow and to monitor events. Logs are generally stored to volatile memory, which means the logs will be deleted when the WAP is reset or powered off; however, you can store logs to nonvolatile (permanent) memory if you need to keep the logs. This can be beneficial if you have to debug a problem. This document guides you through the log settings configuration and explains the log status on the WAP121 and WAP321.
Applicable Devices
• WAP121
• WAP321
Software Version
• 1.0.3.4
Log Settings Configuration
Caution: Persistent logging can decrease the performance of flash (nonvolatile) memory and also network performance. Persistent logging should only be used when you want to debug a problem. Make sure that you disable persistent logging after you finish.
Step 1. Log in to the web configuration utility and choose Administration > Log Settings. The Log Settings page opens:
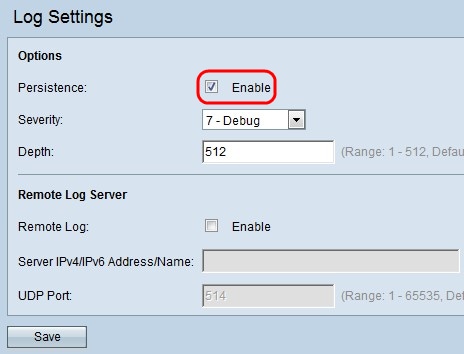
Step 2. Check the Enable check box in the Persistence field to enable the persistence feature which saves the system logs to the nonvolatile RAM (NVRAM) when the device is rebooted. This causes logs not to be erased when the device is rebooted. Up to 128 log messages can be saved in the NVRAM. If the logs exceed more than 128 messages, then the new ones overwrite the old logs.
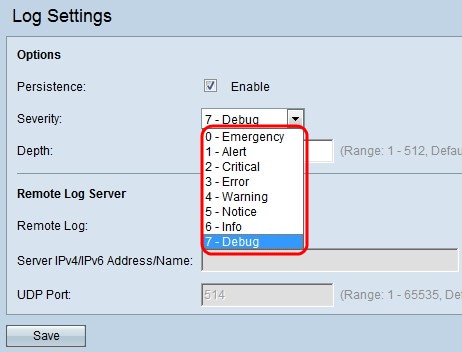
Step 3. Choose the severity level from the Severity drop-down list. All the logs at the chosen severity level and higher will be logged. The available severity levels are:
• Emergency — A panic condition which affects multiple applications and sites.
• Alert — When an alert message is logged, then the device needs an immediate action to be performed.
• Critical — The system is in a critical state. Certain measures have to be taken to overcome the situation when you see this message.
• Error — A system error has occurred, such as non-urgent failures. These must be resolved within a given time.
• Warning — Not an error, but an indication that an error will occur if action is not taken.
• Notice — The system functions properly, but a system notice has occurred. These are events that are unusual but not error conditions.
• Informational — Provides device information.
• Debug — Provides detailed information about the type of debug and time of the debug.
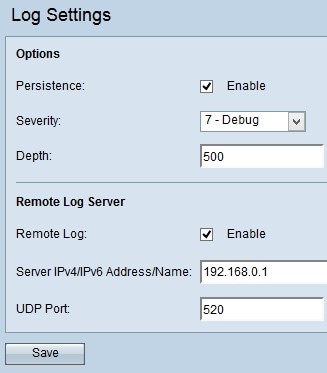
Step 4. Enter the maximum amount of messages that can be stored in the volatile memory in the Depth field. By default, an access point queues up to 512 messages.
Step 5. (Optional) If you want to send the log messages to a remote syslog server, check the Enable check box in the Remote Log field.
Timesaver: If you do not check the Enable check box, skip to Step 8.
Step 6. Enter the domain name or IP address of the syslog server in the Server IPv4/IPv6 Address/Name field.
Step 7. Enter the number of the UDP port of the syslog server where the logs are sent in the UDP Port field. The default port is 514.
Step 8. Click Save to save the changes made.
Log Status and Statistics
Step 1. Log in to the web configuration utility and choose Status and Statistics > Log. The Log page opens:
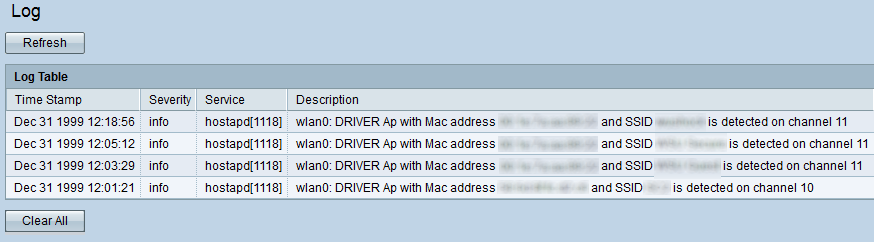
The Log Table has the following fields:
• Time Stamp — Displays the month, day, year, and time the log was created.
• Severity — Displays the event severity.
• Service — The software component related to the event.
• Description — Displays an informational message that describes the event logged.
Step 2. (Optional) If you want to clear the logs, then click Clear All.
Step 3. (Optional) If you want the update the log table, then click Refresh.
Revision History
| Revision | Publish Date | Comments |
|---|---|---|
1.0 |
11-Dec-2018
|
Initial Release |
 Feedback