Introduction
This document describes how to get diagnostic logs from the Cisco Security for Chromebook (DNS only) client for troubleshooting and support purposes.
Overview
Use this guide to collect diagnostic and configuration information from Security for Chromebook version 2.1.1 with DNS layer protection using DNS over HTTPS (DoH) templates. Umbrella support may request this information to assist with troubleshooting.
Obtain Configuration and Current State Information
-
Open the Chrome browser and go tohttps://policy-debug.checkumbrella.com/.
- Copy the diagnostic information located at the bottom of the page and send it to Support.
-
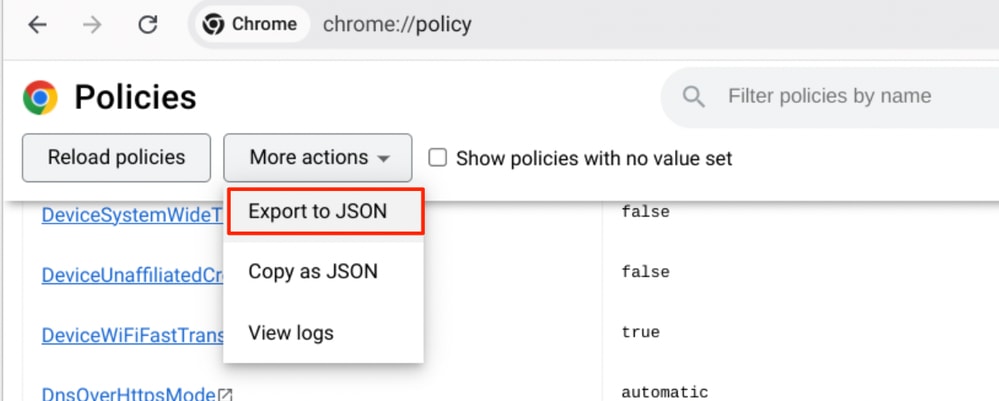
Openchrome://policyin the Chrome browser.
- ClickExport to JSONand send the exported JSON file to Support.
Enter these commands in the Extension Console ("Console" tab) to gather state information:

Note:You must enable and access the Extension Console Tab to perform this step. See the Debugging steps section for more details.
To save the console output, right-click inside the console and clickSaveAs. Send the exported log file to Support.
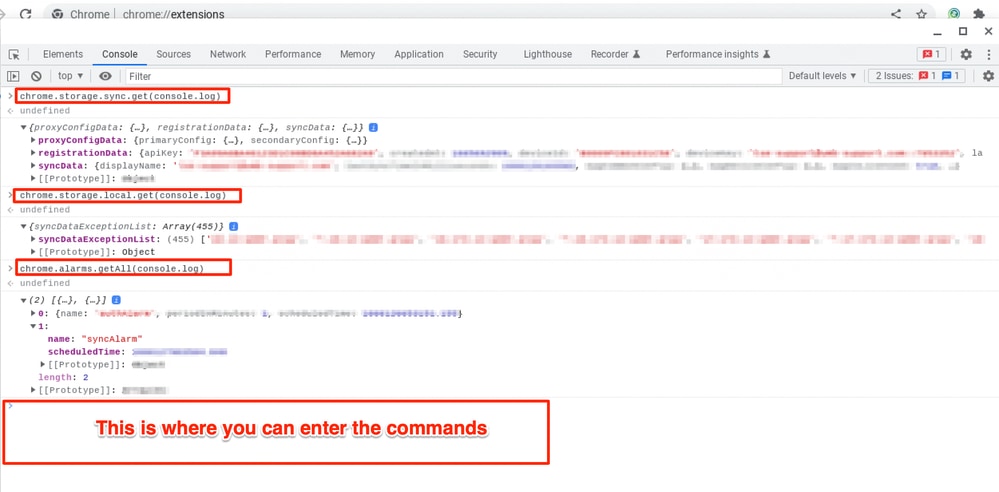 Screenshot showing sample extension console output.
Enable the Extension Console Tab
For steps to enable the Extension Console Tab, refer to the Debugging steps in the Umbrella documentation: Cisco Security for Chromebook Client: Debugging Steps
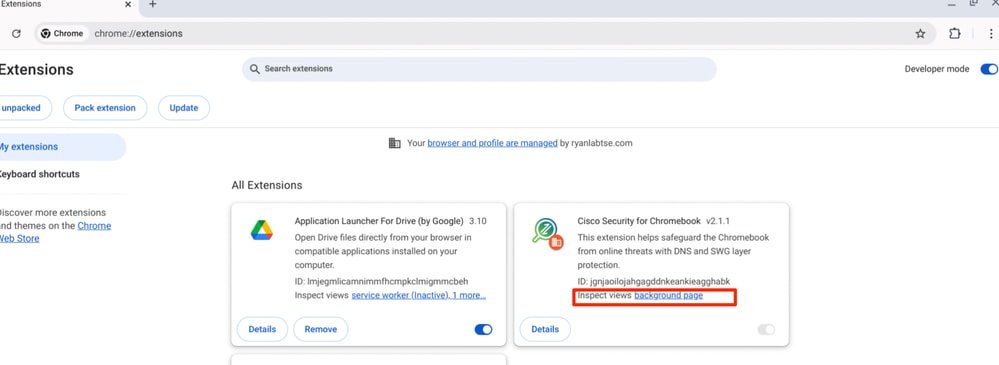
This screenshot shows the Chrome Extensions page with a link to "Inspect views background page" where you can open the Extension Console:
Obtain Diagnostic Logs for Chromebook SWG Client
To obtain diagnostic logs for the Security for Chromebook (SWG) client, refer to: Obtain Diagnostic Logs from Umbrella Chromebook Client
 Feedback