Introduction
This document describes how to manage the Cisco Cloud Security app for IBM QRadar.
Overview
QRadar from IBM is a popular SIEM for log analysis. It provides a powerful interface for analyzing large chunks of data, such as the logs provided by Cisco Umbrella for your organization's DNS traffic. Information displayed in the Cisco Cloud Security App for IBM QRadar comes through the API's of Cisco Umbrella, CloudLock, Investigate and Enforcement.
When you set up Cisco Cloud Security app for QRadar, it integrates all the data from Cisco Cloud Security platform and allows you to view the data in graphical form in the QRadar console. From the application, analysts can:
- Investigate domains, ip addresses, email addresses
- Block and Unblock domains (enforcement)
- View the information of all the incidents of the network.
This article walks you through how to navigate the Cisco Cloud Security App. Instructions on how to set-up the application can be found here: Configuring the Cisco Cloud Security App for IBM QRadar
Accessing the Cisco Cloud Security App
To navigate to the Cisco Cloud Security App in IBM QRadar, go to the homepage and click on the Cisco Cloud Security tab. The Cloud Overview tab and the Dashboard appears. You can then access the Umbrella, Investigate, CloudLock and Enforcement tabs to view your logs.
The Cloud Security App is set to show the data from the last 7 days by default. You can change the time frame by clicking on the date range on the top right:
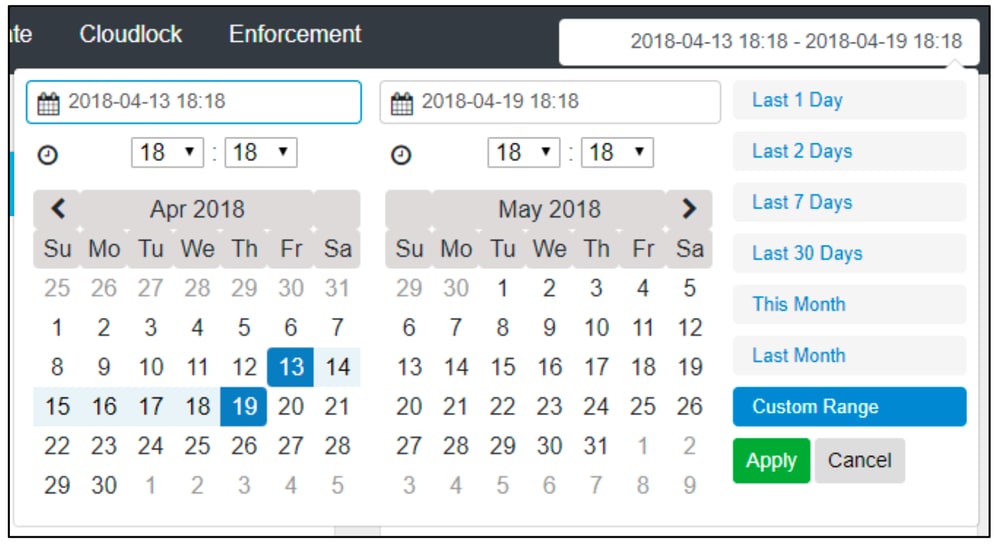 360072030052
Cisco Cloud Security App Components
Cloud Overview
The Cloud Overview Tab displays information such as All Requests, All Blocked, Security Blocked, Likely DGA’s, Suspicious Secure Rank, Cloudlock Incidents, CloudLock Overall, Top Policies, and Top Offenders in a chart based visual representation.
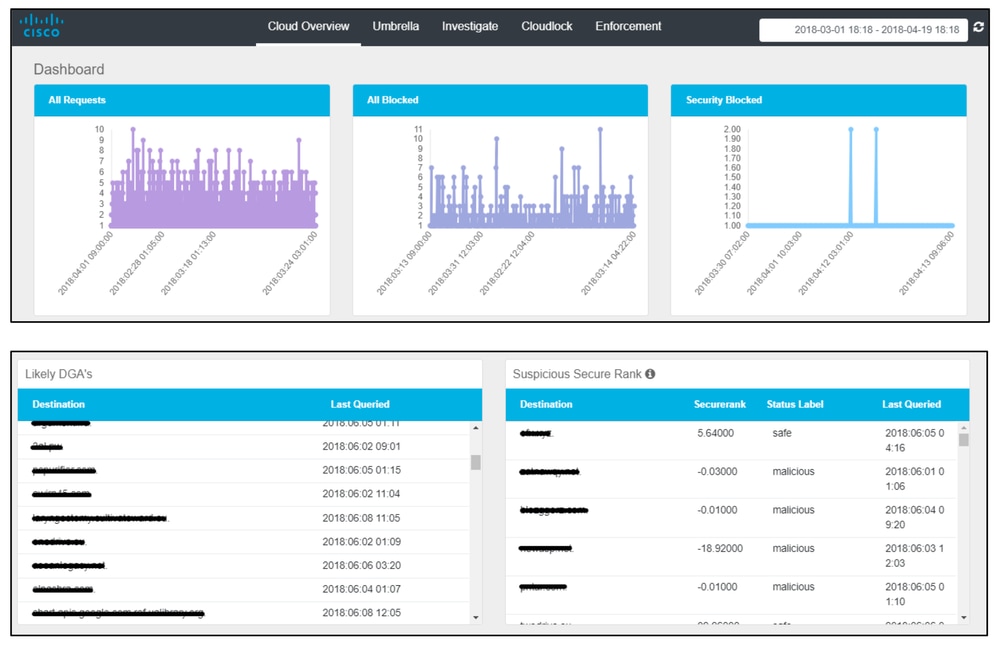 360072257631
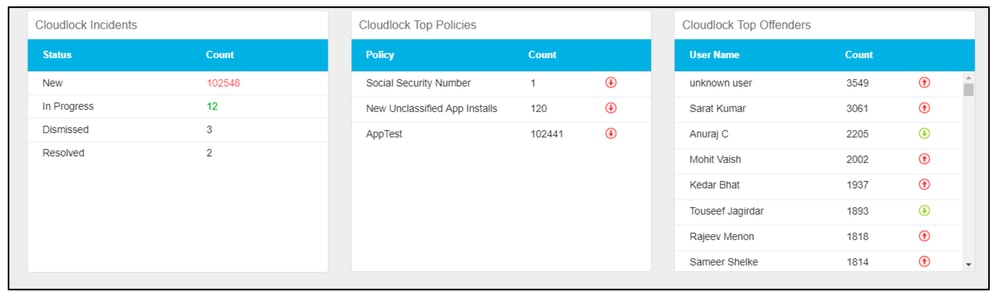 360072257611
Umbrella
The Umbrella Tab displays information such as Events By Action, Top Blocked Categories, Number of Events by Identity, Domains Being Blocked, Domains No longer being blocked, Compromised Users, Restricted content alerts, Compromised Devices, Top Domains, Top Blocked Domains, Top Blocked Identities, Malicious Content Category breakdowns, Top Categories, Activity and User Access Trend in a chart based visual representation.
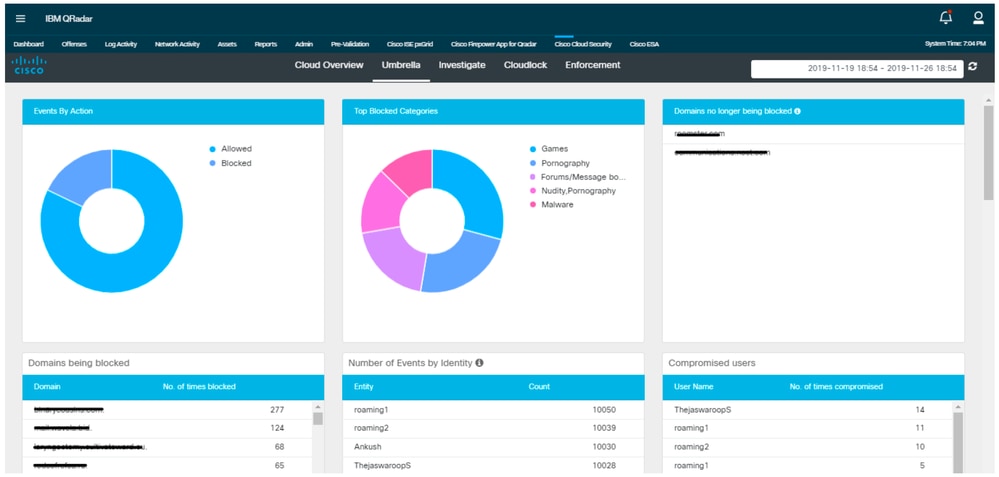 360072263411
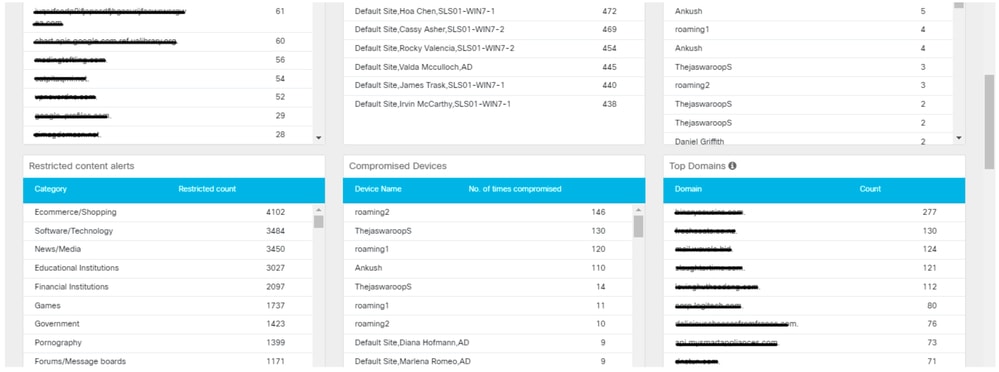 360072263391
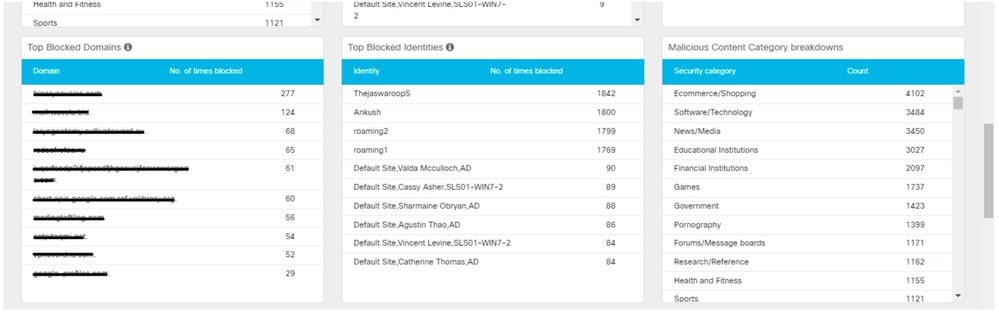 360072037372
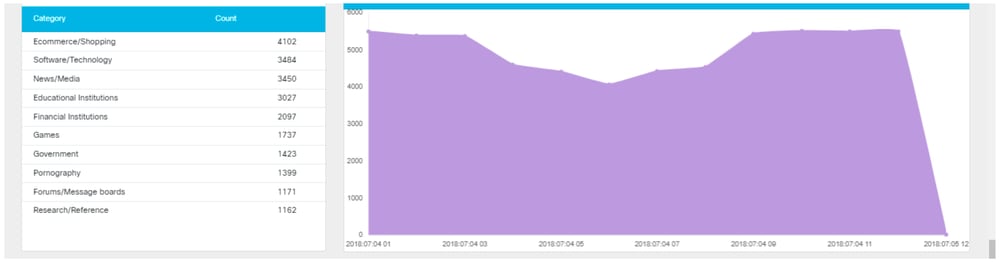 360072263331
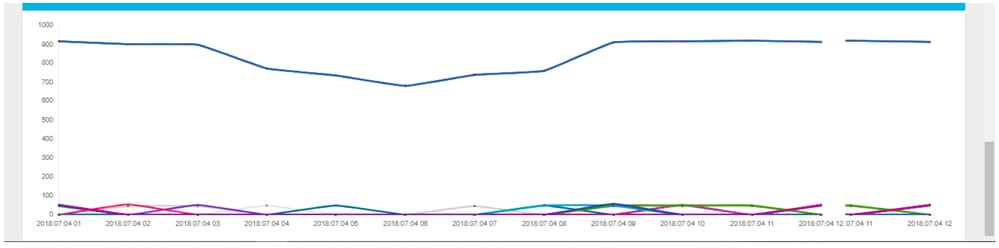 360072263351
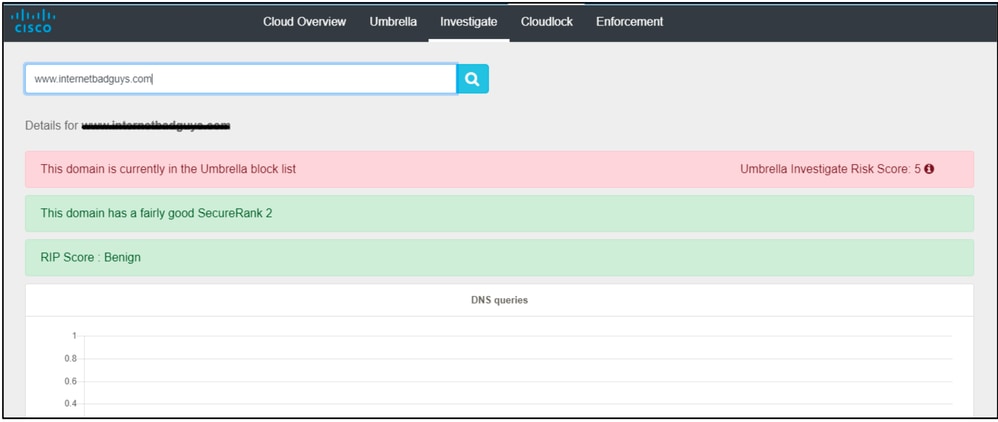
Investigate
The Investigate Tab enables the user to search the information related to hostname, URL, ASN, IP, Hash or email address. It also has information such as WHOIS record, DGA information and so on.
 360072263511
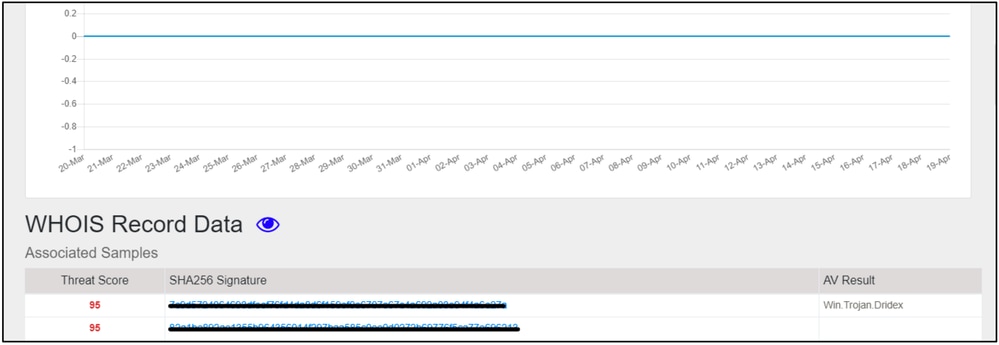 360072037472
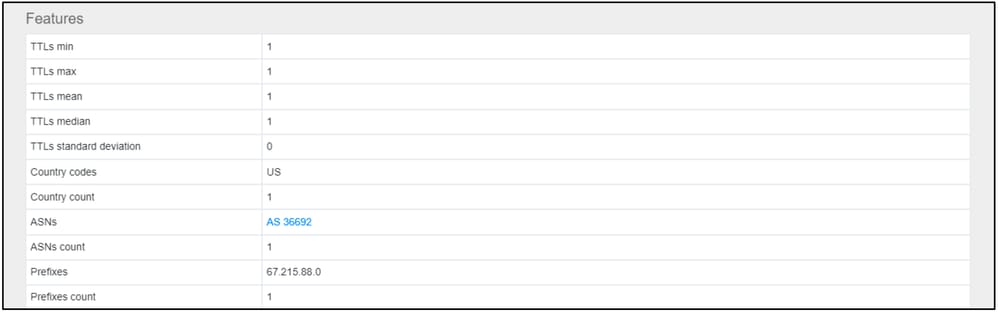 360072037452
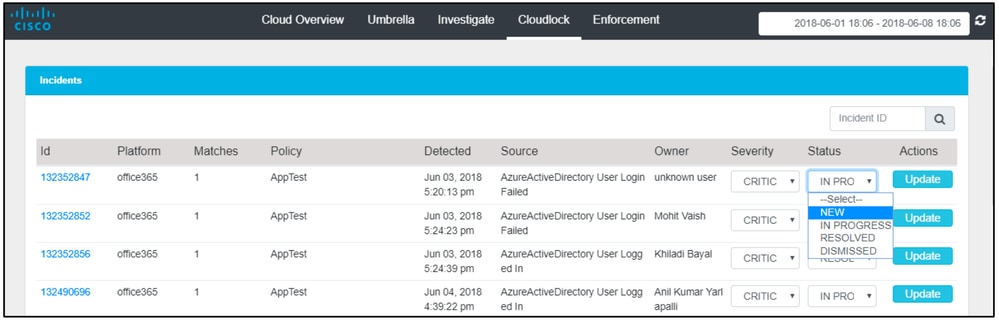
CloudLock
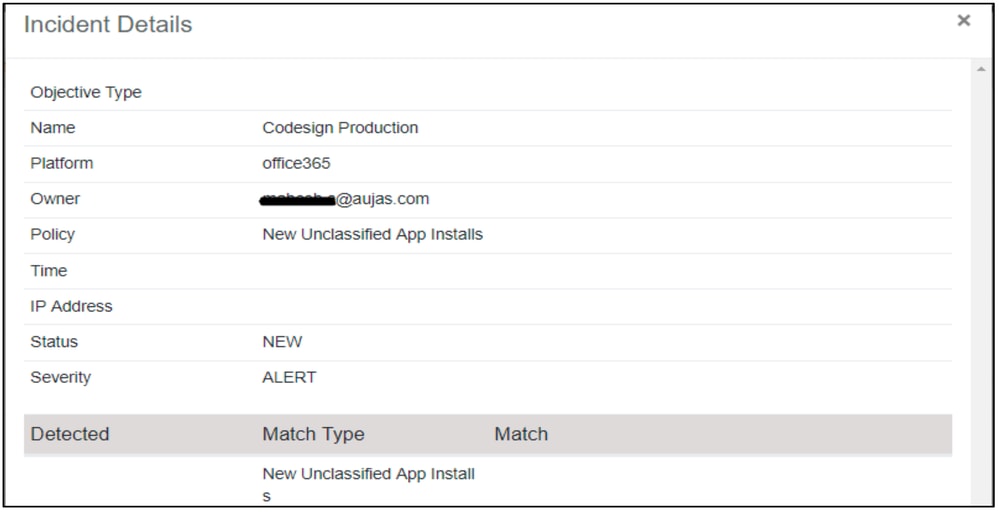
The CloudLock tab lets users view information about all of the incidents detected. Users can also update the severity and status of the incident by selecting the values from the drop-down menu and clicking "Update".
 360072268311
Users can clock on any of the events to view more details about the incident.
 360072042332
Enforcement Tab
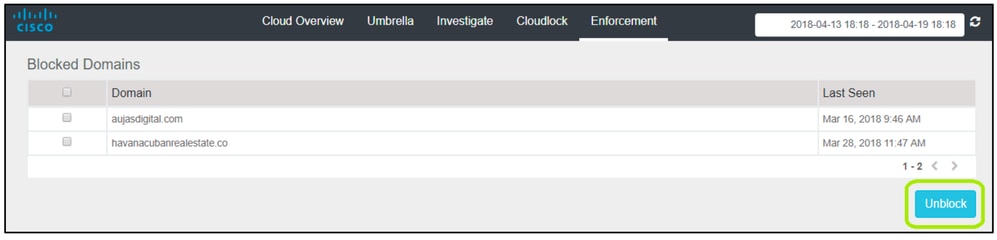
The Enforcement tab displays information about which domains are blocked. Users can also select blocked domains and unblock them from this interface.
 360072038472
 Feedback