Understand Endpoint Diagnostics Tool (CEDT)
Available Languages
Contents
Introduction
This document describes the CEDT to collect diagnostic data from your system and upload it to a Cisco TAC support case.
Prerequisites
The tool is available for MacOS and Windows.
You must understand these topics:
- MacOS: Double-click Cisco Endpoint Diagnostics Tool (CEDT).app to launch.
- Windows: Double-click CEDT.exe to launch.
- An active internet connection.
- A Cisco TAC Case ID and Token (required only if you want to upload results directly).
System Data Collected
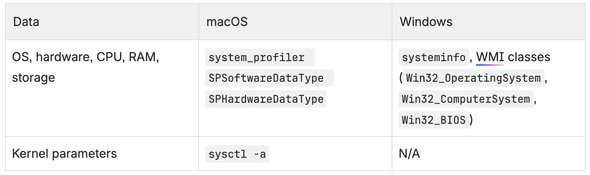
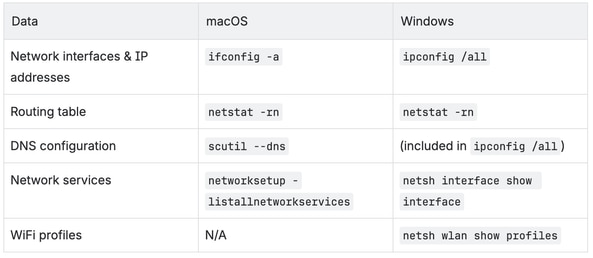
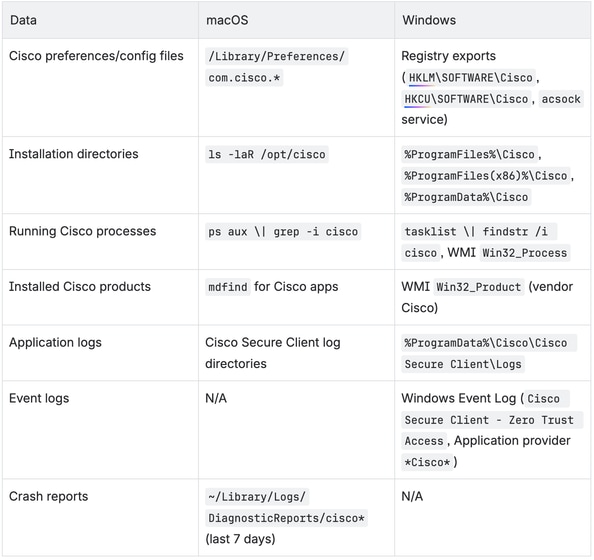
The tool collects this system data, organized by category. No personal data of any kind is captured.
General System Information
Network Configuration
Product Information
Step-by-Step Walkthrough
Welcome Screen
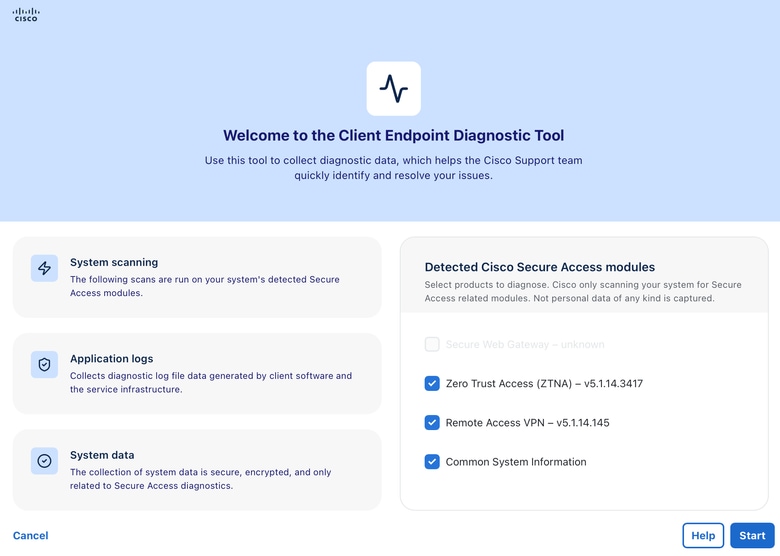
When you launch CEDT, the Welcome screen is displayed. It provides an overview of what the tool does:
- System scanning – Scans your system for detected Cisco Secure Access modules.
- Application logs – Collects diagnostic log file data generated by client software and the service infrastructure.
- System data – The collection of system data is secure, encrypted, and only related to Secure Access diagnostics.
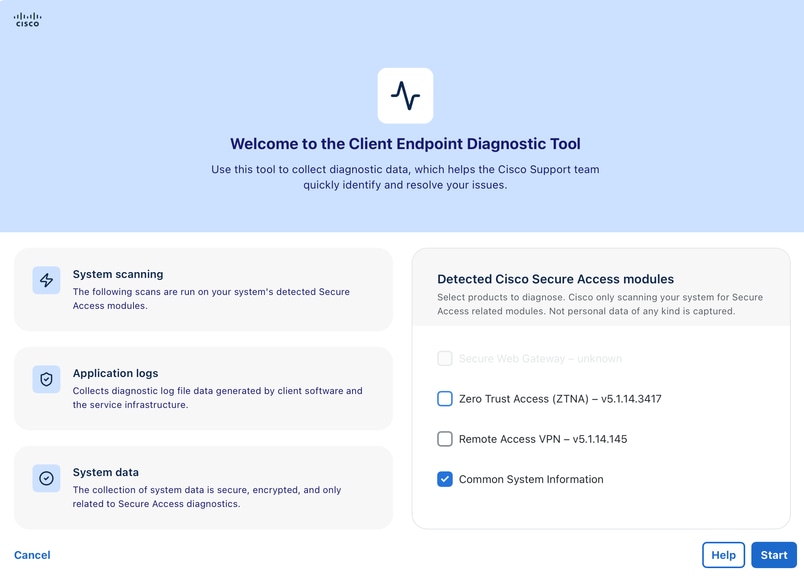
On the right side, the tool automatically detects any installed Cisco Secure Access modules on your system. You can see check boxes for each detected module along with its version number:
- Zero Trust Access (ZTNA)
- Secure Web Gateway (SWG)
- Remote Access VPN (RAVPN)
- Common System Information (always available)
Actions
- Select or deselect the products you want to diagnose.
- Click Let's Start to proceed, or click Help for more information.

Note: This tool only collects data for Secure Access related modules. No personal data of any kind is captured.
Step 1: Diagnostic Data Collection
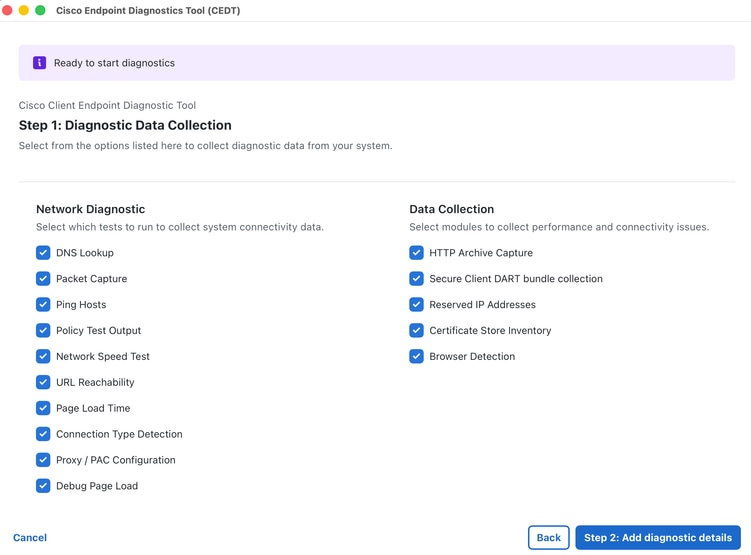
This screen lets you choose which diagnostic tests and data collection modules to include.
Network Diagnostic
Select which connectivity tests to run:
- DNS Lookup – Performs DNS resolution tests against specified hosts. Supports custom resolver IPs for targeted lookups. All results are consolidated into a single output file (dns/dns_lookups.txt) with structured section delimiters.
- Packet Capture – Captures network packets for a specified duration (requires administrator privileges).
- Ping Hosts – Pings specified hosts to check connectivity.
- Policy Test Output – Tests policy enforcement against specified URLs using the Cisco policy test endpoint (policy.test.sse.cisco.com). Supports multiple comma-separated hosts (maximum 10). Results include HAR data automatically captured during the policy test navigation.
- Network Speed Test – Measures upload/download speed and latency against the Cisco speed test endpoint (speed.test.sse.cisco.com). Collects download speed (6 parallel streams), upload speed (3 parallel streams), and ping latency/jitter (10 ICMP samples). Results are saved in both JSON and text summary formats.
- URL Reachability – Checks whether specified URLs are reachable using HTTP GET requests. Supports both HTTP (port 80) and HTTPS (port 443) by default. Non-standard ports can be specified in the URL (such as https://
example.com:8443). Maximum 20 URLs per check with a 30-second timeout per URL. Data collected per URL includes: URL, reachability status, HTTP status code, response time (ms), content length, resolved IP address, TLS version, and timestamp. Results are saved to reachability/reachability_results.json and reachability/reachability_summary.txt.
Data Collection
Select modules to collect performance and connectivity data:
- HAR Capture – Records HTTP Archive (HAR) data from a browser session. Currently supports Google Chrome only (uses the Chrome DevTools Protocol via headless browser automation). The tool auto-detects the Chrome installation on your system. Firefox and Safari are not supported at this time. HAR output adheres to the HAR 1.2 specification and includes full network traces (including JS-triggered XHR/fetch calls).
- DART Bundle Collection – Collects a DART diagnostic bundle from the Cisco Secure Client. This includes all module logs, including Zero Trust Access (ZTA) logs (such as flowlog.db on Windows at C:\ProgramData\Cisco\Cisco Secure Client\ZTA\logs\).
- Reserved IP – Runs reserved IP diagnostic checks. See the next section for the complete list of diagnostics collected.
Debug
- Enable Debug Flags – Collect detailed logs of endpoint activities to diagnose endpoint issues. This option is only available when at least one Cisco Secure Access product is detected and selected.
Platform Specific
- DebugView Capture (Windows) – Enables debug logging on the Windows Secure Endpoint Connector. This option is only available on Windows systems.
Actions
- Check or clear the diagnostic options you want.
- Click Step 2: Add diagnostic details to proceed.
- Click Back to return to the Welcome screen, or Cancel to exit.
Step 2: Add Diagnostic Details
This screen lets you configure the specific parameters for each enabled diagnostic test. Only settings for tests you enabled in Step 1 are shown.
DNS Lookup Settings
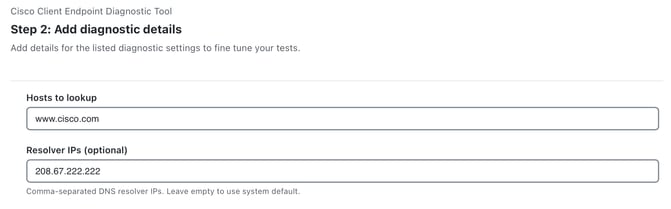
- Hosts to lookup – Enter one or more hostnames (comma-separated). Example: cisco.com
- Resolver IPs (optional) – Enter custom DNS resolver IPs (comma-separated). Example: 208.67.222.222, 208.67.220.220. Leave empty to use the system default DNS resolver. When specified, each host is queried against each resolver, providing comparative DNS resolution results across different DNS servers.
All DNS lookup results are consolidated into a single output file: dns/dns_lookups.txt, with structured TextFSM section delimiters for each host/resolver combination.
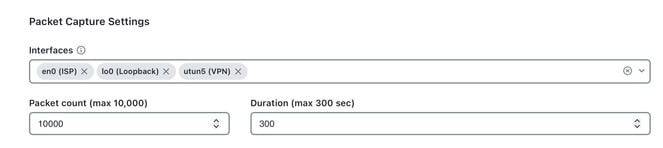
Packet Capture Settings
- Interfaces – Select the network interface to capture on (or leave as All).
- When set to All (auto mode):
- macOS/Linux: The tool runs tcpdump -D to enumerate all available interfaces, then filters for interfaces that are Up and Running (excluding disconnected interfaces). If no active interfaces are found, it falls back to the special any interface. Captures run on all matching interfaces in parallel.
- Windows: Captures on all NICs using the selected capture backend (see tools in the next section). When using dumpcap with no interface selected, up to the first 3 detected interfaces are captured simultaneously.
- When set to All (auto mode):
- Packet count – Number of packets to capture per interface. Default: 100. Maximum: 10,000.
- Duration (sec) – Maximum capture duration in seconds. Default: 20 seconds on macOS/Linux, 5 seconds on Windows. Maximum: 300 seconds. The capture stops when either the packet count or duration limit is reached, whichever comes first.
Packet Capture Tools by Platform
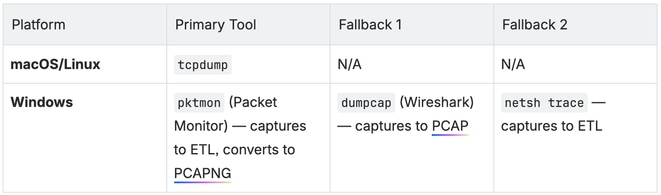
Note: (Windows): The tool automatically selects the best available capture backend. pktmon is preferred (built into Windows 10 v2004+), falling back to dumpcap (if Wireshark is installed), then netsh trace as a last resort.
Packet Capture Output Files
The capture of each interface is saved as a separate file using the naming convention: tcpdump/{interface_name}_capture.pcap (such as en0_capture.pcap, eth0_capture.pcap). A metadata manifest file (tcpdump/packet_capture_manifest.txt) is also generated, recording the platform, packet count, duration, interfaces captured, and capture backend used.
Ping Settings
- Host/s to ping – Enter hosts to ping (comma-separated). Example: www.
cisco.com.

URL Reachability Settings
URLs to check – Enter URLs to test (comma-separated). Example: https://
- Uses HTTP GET requests to test reachability.
- Default ports: 80 (HTTP) / 443 (HTTPS). Include the port in the URL for non-standard ports (such as https://
example.com:8443). - Maximum 20 URLs per check.
- Timeout: 30 seconds per URL.
- Data collected per URL: URL, reachability status, HTTP status code, response time (ms), content length, resolved IP address, TLS version, and timestamp.
- Results are saved to reachability/reachability_results.json and reachability/reachability_summary.txt.

Policy Test Settings
- Host URLs – Enter hosts for policy testing (comma-separated, maximum 10). Example: www.
cisco.com. - Policy tests are executed against the Cisco policy test endpoint: policy.test.sse.cisco.com
- Results include both structured policy test output and HAR data automatically captured during the test navigation.

HAR Capture Settings
- Target URLs – Enter URLs for HAR capture (comma-separated). Example: https://
www.cisco.com/.

Tip: HAR capture currently supports Google Chrome only. The tool uses the Chrome DevTools Protocol (via chromedp) to automate a headless Chrome session and capture network traffic. Ensure Google Chrome is installed on your system. Firefox and Safari are not supported at this time.

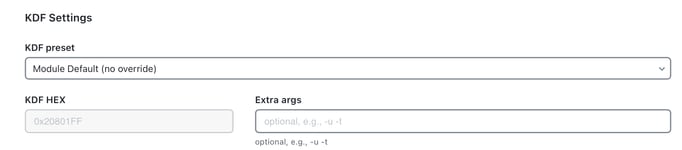
KDF Settings
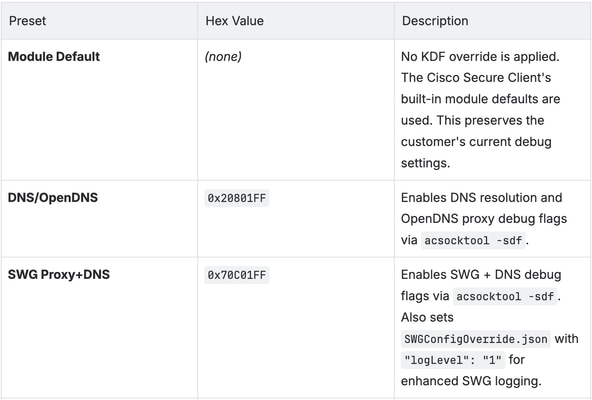
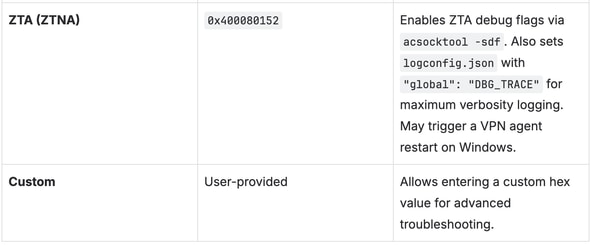
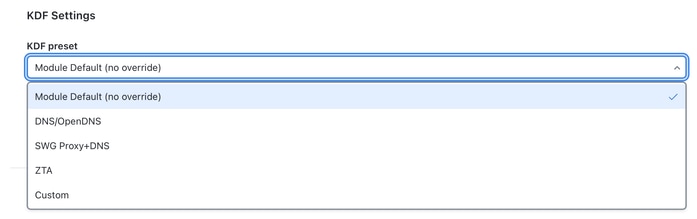
Configure the Key Derivation Function flags used during diagnostic collection. KDF flags control which debug categories are enabled in the Cisco Secure Client:
- KDF preset – Select a Key Derivation Function preset.
- KDF HEX – The hex value auto-populates based on the selected preset. When Custom is selected, enter your own hex value.
Reserved IP Settings
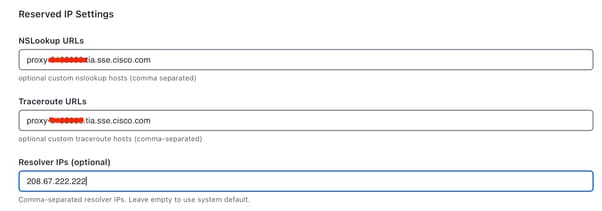
- NSLookup URLs – Optional custom nslookup hosts (comma-separated). Maximum 10 URLs. Each custom host is queried against all configured resolvers.
- Trace URLs – Optional custom traceroute/tracert hosts (comma-separated). Maximum 10 URLs. The tool automatically uses traceroute on macOS/Linux and tracert on Windows.
- Resolver IPs – Optional custom resolver IPs for nslookup queries (comma-separated,such as 208.67.222.
- 222, 208.67.220.220). Maximum 5 IPs. When specified, custom resolvers are used in addition to the three built-in resolvers (system default DNS, 127.0.0.1, 208.67.222.222).
Reserved IP Details
The Reserved IP diagnostic collects this data by default:
Default Traceroute/Tracert targets (run against all of these automatically):
208.67.222.222Route to OpenDNS primary nameserver
| Target | Purpose |
|---|---|
| 208.67.220.220 | Route to OpenDNS secondary nameserver |
| 146.112.255.50 | Route to Cisco SWG infrastructure IP |
| swg-url-proxy-https-sse.sigproxy.qq.opendns.com | Route to SWG proxy hostname |
- macOS/Linux: Uses traceroute command
- Windows: Uses tracert command
Default NSLookup queries (run against all of these automatically):
Every nslookup target is queried against each resolver in the resolver list. By default, the resolver list includes three built-in resolvers:
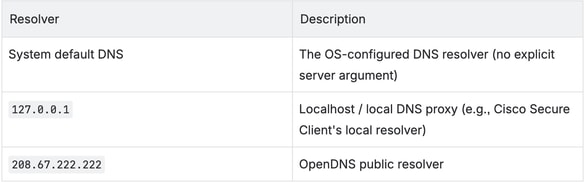
If custom Resolver IPs are configured (such as 208.67.222.222), those are added to the resolver list and every nslookup target is also queried against them.
NSLookup targets:
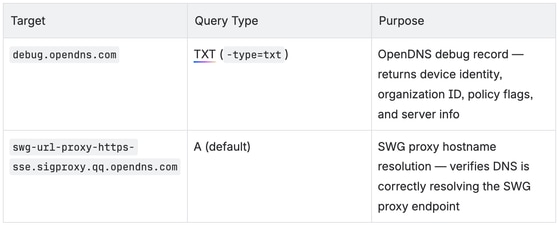
For example, with the default 3 resolvers, this produces 6 nslookup queries (2 targets x 3 resolvers). Adding one custom resolver IP increases this to 8 queries (2 targets x 4 resolvers).
Custom user-supplied NSLookup URLs are each queried against the same full resolver list (built-in + custom resolvers).
All results are consolidated into a single file: reserved_ip/reserved_ip_diagnostics.txt, grouped by section (traceroute, nslookup) with human-readable headers indicating the target and resolver for each entry.
Performance Diagnostics
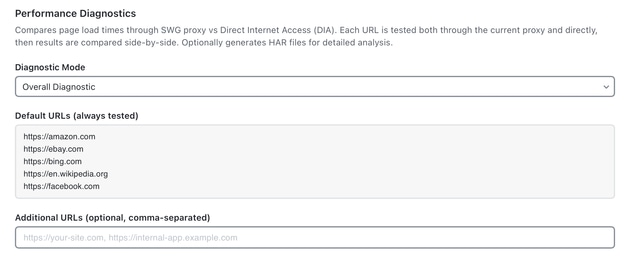
Compares page load times through SWG proxy vs Direct Internet Access (DIA). It has two modes:
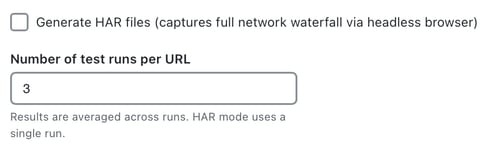
1. Overall Diagnostic Mode: Each URL is tested both through the current proxy and directly, then results are compared side-by-side. Optionally generates HAR files for detailed analysis.
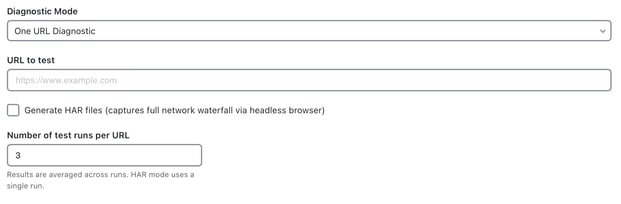
2. One URL Diagnostic Mode: We can enter specific URL to be tested via both through the current proxy and directly, then results are compared side-by-side. Optionally generates HAR files for detailed analysis.
Certificate Store Inventory Settings
- Enumerates certificates from configured certificate stores:
- System
- Login
- Root
- And more
- Quickly identifies missing, expired, or untrusted certificates

Debug Page Load Settings:
- Loads configurable debug URLs.
- Captures:
- Response headers
- Response body
- Timing information
- SSL metadata

Actions
- Fill in or adjust the settings for each enabled diagnostic.
- Click Start Diagnostics to begin the diagnostic run.
- Click Back to return to Step 1, or Cancel to exit
Note: Fields with validation errors are highlighted. You must correct them before the diagnostics can start.
Pause and Continue
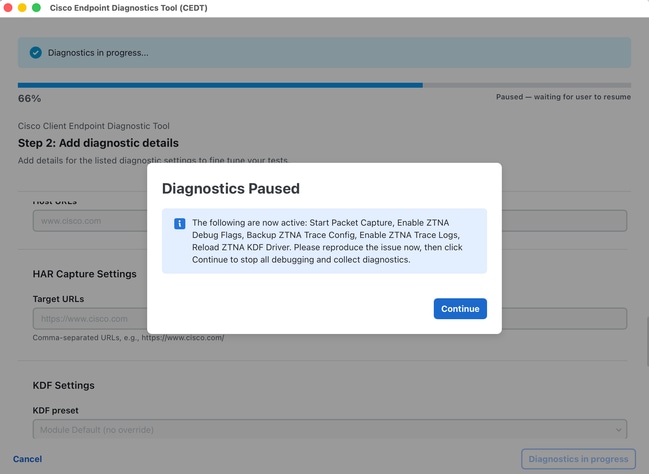
When you run a diagnostic collection that includes advanced troubleshooting (for example ZTNA or SWG tracing), the Cisco Endpoint Diagnostic Tool can pause partway through the run and ask you to reproduce the problem before it continues.
This gives you time to trigger the issue while detailed logging is turned on, so the support team receives more useful diagnostic data.
- When the Diagnostics Paused window appears, read the message – it tells you which logging features are now active.
- Reproduce the issue you are troubleshooting. For example:
- Reconnect to VPN
- Open the internal application that is failing
- Repeat the steps that cause the error
- When you are done reproducing the issue, click Continue
Let the run finish. The tool then collects files, restore your normal settings, and create the diagnostic archive.
Do not close the application while paused. Logging remains active until you click Continue and the run completes.
(Command line)
If you are running the tool from a terminal, you can see a pause message in the window instead of a dialog box.
- Read the pause message shown in the terminal.
- Reproduce the issue.
- Return to the terminal and press Enter to continue.
- Wait for the run to finish.
Administrator Privileges Prompt
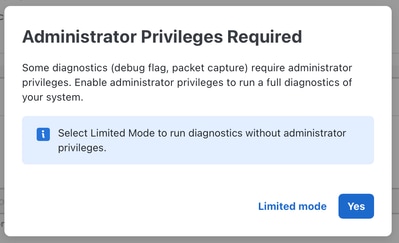
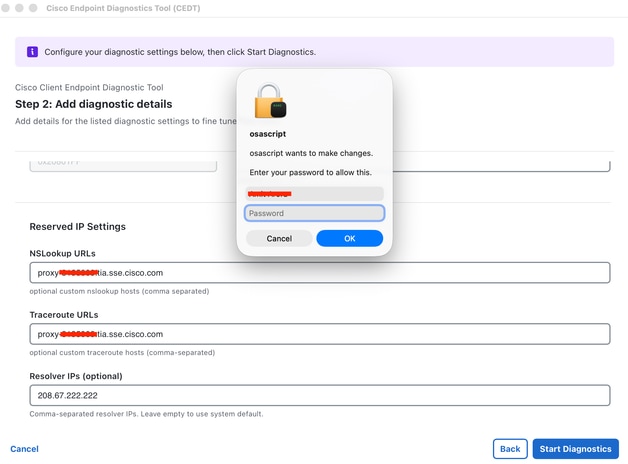
After clicking Start Diagnostics, the tool can prompt you for administrator privileges if you enabled features that require elevated access (such as Packet Capture or Debug Flags).
A dialog appears with the title Administrator Privileges Required:
- Click Yes to grant administrator privileges. This triggers the native macOS/Windows credential prompt.
- Click Limited mode to proceed without elevation. Privileged tasks (packet capture, debug flags) is skipped.
- macOS: You can see the standard macOS password dialog from osascript. Enter your system password and click OK.
- Windows: A standard UAC elevation prompt appears. Click Yes to allow.
Diagnostics in Progress
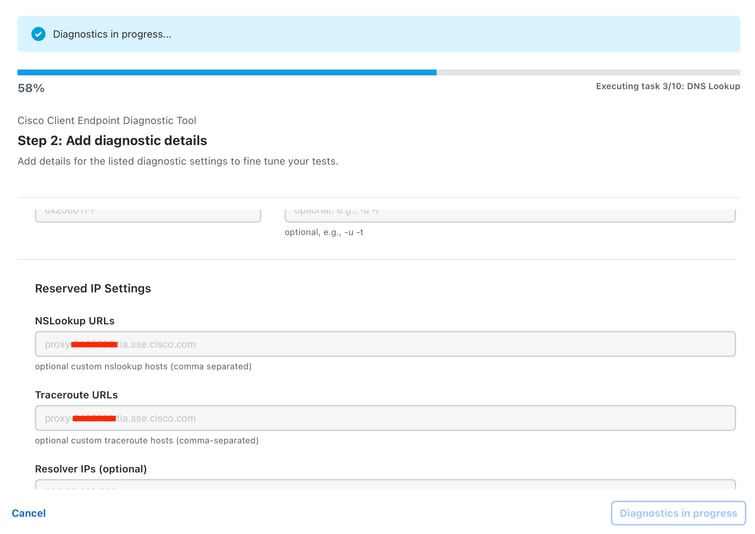
Once started, the tool runs through all selected diagnostic tasks:
- A progress bar shows overall completion (such as 59% – Executing task 3/9: DNS Lookup).
- A Diagnostics in progress... banner displays at the top.
- All settings fields are disabled/greyed out during the run.
- The footer shows a Diagnostics in progress button (disabled) to indicate the tool is busy.
Wait while the diagnostics complete. Do not close the application.
Diagnostics Complete – Upload to TAC
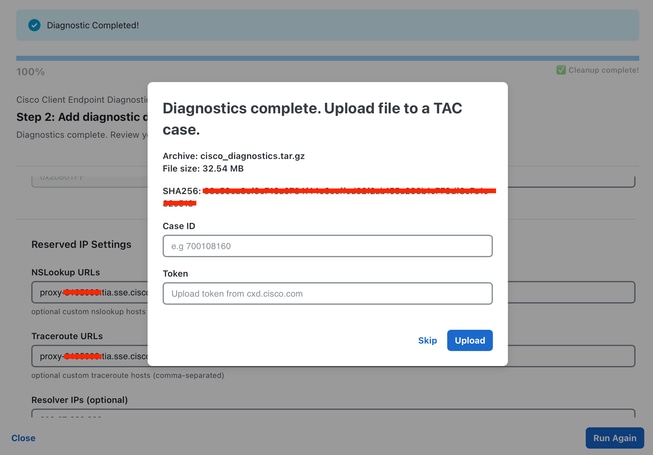
When all diagnostics finish, a completion dialog appears:
Diagnostics complete. Upload file to a TAC case.
The dialog displays:
- Archive – The filename of the generated diagnostic archive (such as cisco_diagnostics.tar.gz).
- File size – The size of the archive (such as 7.72 MB).
- SHA256 – The checksum of the archive file for integrity verification.
To upload to a TAC case:
- Enter your Case ID (such as698746730).
- Enter your Token (provided by Cisco support).
- Click Open TAC Case to start the upload.
A progress bar shows the upload status (such as Uploading... 85.0% (6.56 MB / 7.72 MB)).
To skip the upload:
- Click Skip to close the dialog without uploading. The archive file is still saved locally.
Upload Complete – Final Screen
After a successful upload, the completion banner updates to:
Diagnostic archive successfully uploaded to case [Case ID]
The progress bar shows 100% with a Cleanup complete status.
Actions
- Click Run Again to start a new diagnostic run.
- Click Close to exit the application.
Output Location
Diagnostic output is saved to:
- macOS: ~/Desktop/cisco_diagnostics/
- Windows: %USERPROFILE%\Desktop\cisco_diagnostics\
The output archive file (cisco_diagnostics.tar.gz) contains all collected diagnostic data in a structured format.
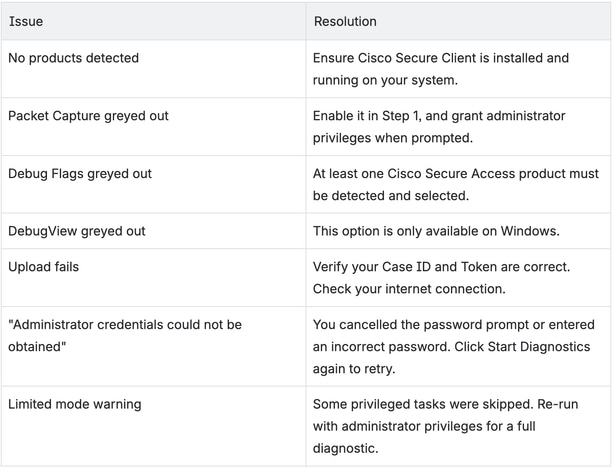
Troubleshooting
FAQ
Q: What data does this tool collect?
A: The tool collects system information (OS, hardware, network configuration), application logs, Cisco product configuration and installed module data, and network diagnostic data related to Cisco Secure Access modules only. See What System Data is Collected in the preceding section for a detailed breakdown. No personal data is captured.
Q: Do I need administrator/root access?
A: Administrator access is optional but recommended. Without it, some diagnostics (packet capture, debug flags) are skipped. The tool prompts you and let you choose.
Q: Can I run the tool multiple times?
A: Yes. After each run completes, you can click "Run Again" to start a new diagnostic session.
Q: Where is the output saved?
A: The diagnostic archive is saved to your Desktop under the cisco_diagnostics folder.
Q: What if I do not have a TAC Case ID?
A: Click Skip on the upload dialog. The archive file is still saved locally. You can manually upload it to a TAC case later or share it with your support engineer.
Q: Is the data encrypted?
A: The diagnostic archive is compressed (tar.gz) and sensitive data is automatically redacted before packaging.
Q: Which browsers does HAR capture support?
A: HAR capture currently supports Google Chrome only. The tool uses the Chrome DevTools Protocol for headless browser automation. Ensure Chrome is installed before running HAR capture.
Q The pause screen never appeared. Is something wrong?
A: Not necessarily. The pause step only appears when detailed logging was successfully enabled for your scenario. Check the run log in the app; if enable steps were skipped, the tool continues without pausing.
Q The run seems stuck. What do I do?
A: Look for the Diagnostics Paused window – it can be behind other windows. The run does not move forward until you click Continue (or press Enter in the command line).
A: Yes. The message shows whichever logging features the tool enabled for your platform and the diagnostic options you selected.
A: Run the diagnostic collection again and let it finish. If you are unsure whether logging was left on, contact your support engineer for guidance.
Revision History
| Revision | Publish Date | Comments |
|---|---|---|
2.0 |
06-Jul-2026
|
Added Alt Text, Formatting. |
1.0 |
03-Jul-2026
|
Initial Release |

 Feedback
Contact Cisco
- Open a Support Case

- (Requires a Cisco Service Contract)