Introduction
This document describes the basic information need to be collected while working with Cisco Secure Access Support Team
Prerequisites
Requirements
Cisco recommends that you have knowledge of these topics:
- Cisco Secure Access
- Cisco Secure Client
- Packet Captures through Wireshark and tcpdump
Components Used
The information in this document was created from the devices in a specific lab environment. All of the devices used in this document started with a cleared (default) configuration. If your network is live, ensure that you understand the potential impact of any command.
Background Information
While working on Cisco Secure Access, you can run into issues where you need to contact Cisco Support Team, or would like to perform basic investigation for the issue and try to go through the logs and islote the problem. This article go over on how to gather the basic troubleshooting logs related to Secure Access. note that not all the steps apply to every scenario.
Locate The Secure Access Organization ID
In order for Cisco Engineer to locate your account, provide your organization ID which can be found in the URL once you are logged in to the Secure Access Dashboard.
Steps to locate Organization ID:
1. Login to sse.cisco.com
2. If you have multiple organizations switch to the right one.
3. The organization ID can be found in the URL in this pattern: https://dashboard.sse.cisco.com/org/{7_digit_org_id}/overview
Cisco Secure Client Diagnostic and Reporting Tool (DART)
Cisco Secure Client Diagnostic and Reporting Tool (DART) is a tool that is installed with Secure Client package, helps to collect important information about the user endpoint.
Example of information collected by DART bundle:
- ZTNA Logs
- Secure Client Logs and Profile Information
- System Information
- Other Secure Client Add-ons or Plugins logs that are installed on
Instructions to collect DART:
Step 1. Launch DART.
1. For a Windows computer, launch the Cisco Secure Client.
2. For a Linux computer, choose Applications > Internet > Cisco DARTor /opt/cisco/anyconnect/dart/dartui.
3. For a Mac computer, choose Applications > Cisco > Cisco DART.
Step 2. Click the Statistics tab and then click Details.
Step 3. Choose Default or Custom bundle creation.

Tip: The default name for the bundle is DARTBundle.zip, and it is saved to the local desktop.

Note: If you chose Default, DART starts creating the bundle. If you chose Custom, continue the wizard prompts to specify logs, preference files, diagnostic information, and any other customizations
Enable Debug Logs for ZTNA and SWG Modules
In some of the scenarios support team would require enabling trace or debug level logs in order to identify more complex issues.
complete the steps provided in this section to enable debugs for each of the modules.
Enable Debug Logs for ZTNA
Step 1. Create a json file with name logconfig.json
Step 2. Enter this text inside the file
{ "global": "DBG_TRACE" }Step 3. Place the file into the right directory based on operating system
-
Windows: C:\ProgramData\Cisco\Cisco Secure Client\ZTA
- MacOS: /opt/cisco/secureclient/zta
Step 4. Restart the ZTNA Module or Cisco Secure Client for logs to take affect.
Enable Debug Logs for SWG
Step 1. Create a json file with name SWGConfigOverride.json
Step 2. Enter this text inside the file
{"logLevel": "1"}
Step 3. Place the file into the right directory based on operating system
-
Windows: C:\ProgramData\Cisco\Cisco Secure Client\Umbrella\SWG\
- MacOS: /opt/cisco/secureclient/umbrella/swg
Step 4. Restart the SWG Module or Cisco Secure Client for logs to take affect.
Enable Debug logs for DUO
Enable DUO KDF logs ( Posture Troubleshooting, Enrollment Issues)
reg add “HKEY_LOCAL_MACHINE\SOFTWARE\Duo\Duo Device Health” /v verbose_logging_enabled /d 1 /f
Disable DUO KDF logs
reg add “HKEY_LOCAL_MACHINE\SOFTWARE\Duo\Duo Device Health” /v verbose_logging_enabled /d 0 /f
Collect KDF Logs for ZTNA and SWG, DNS Modules (Windows)
In some of the scenarios support team would require collecting kdf logs in order to identify more complex issues.
complete the steps provided in this section to configure and collect the kdf logs.
Prerequisites
Installing DebugView is be required in order to collect the logs properly. which can be installed using this source: https://learn.microsoft.com/en-us/sysinternals/downloads/debugview
Enable DNS Registry Key
reg add "HKEY_LOCAL_MACHINE\SYSTEM\CurrentControlSet\Services\acsock" /v DebugFlags /d 0x20801FF /t reg_dword /f
Enable SWG Registry Key
reg add "HKEY_LOCAL_MACHINE\SYSTEM\CurrentControlSet\Services\acsock" /v DebugFlags /d 0x70C01FF /t reg_dword /f
Enable ZTNA Registry Key
"%ProgramFiles(x86)%\Cisco\Cisco Secure Client\acsocktool.exe" -sdf 0x40018EF52
Disable All Flags
"%ProgramFiles(x86)%\Cisco\Cisco Secure Client\acsocktool.exe" -cdf
HTTP Archive (HAR) Captures
HAR can be collected from different browsers. it provides multiple information that includes:
1. Decrypted version of the HTTPS requests.
2. Internal information about error messages, request details, and headers.
3. Timing and delay information
4. Other miscellaneous information about browser based requests.
To Collect HAR Captures please use the steps described in this source: https://toolbox.googleapps.com/apps/har_analyzer/
Note: You need to refresh your browser session in order to collect the right data
Packet Captures
Packet captures is useful in a scenario where a performance issue or a packet loss is detected, or total outage for network. The most common tools to collect captures are wireshark and tcpdump. Or a built-in capability to collect pcap files format within the device itself, like a Cisco Firewall or router.
To collect useful packet captures on an endpoint, please make sure to include:
1. Loopback interface to capture traffic sent through Secure Client add-ons.
2. All other interfaces involved in packet path.
3. Apply minimal filters, or no filters at all to make sure all data is collected.
Note: When captures are collected on a network Device, make sure you filter on source and destination of traffic, and limit the captures to related ports and services only, to avoid any performance caused by this activity.
Policy Debug Output
Policy debug output is a diagnostic output sent through the user browser when being protected by Secure Access. which includes critical information about the deployment.
1. Organization ID
2. Deployment type
3. Connected proxy
4. Public and Private IP address
5. Other information related to the source of the traffic.
To run the policy test results, please login to this link from a protected endpoint: https://policy.test.sse.cisco.com/
Please make sure you trust the Secure Access Root Certificate if a certificate error message is presented in your browser.
To Download Secure Access Root Certificate:
Navigate to Secure Access Dashboard > Secure > Settings > Certificate > (Internet Destinations tab)
Common Commands Troubleshooting Site-to-Site Tunnel
# Tunnel Establishment
asa>show crypto ikev1 sa

asa>show crypto ikev2 sa

asa>show crypto ipsec sa

asa>show crypto session

#BGP Troubleshooting
asa>show running-config router bgp
asa>show bgp summary
asa>show ip bgp neighbors

#Routes Advertisements
asa>show bgp ipv4 unicast neighbors <sse-dc-ip> advertised-routes

asa>show bgp ipv4 unicast neighbors <sse-dc-ip> received-routes

asa>show bgp ipv4 unicast neighbors <sse-dc-ip> routes

#Debug BGP events
asa>debug ip bgp

asa>debug ip bgp events

asa>debug ip bgp updates

asa>debug ip routing

#Disable Debugs
asa>undebug all
Common Commands Troubleshooting Resource Connector
The provided list give a comprehensive view on resource connector and important troubleshooting details for Secure Access Support Team
#DNS and connectivity tests on the local IP address, gateway, Secure Access APIs
rc-cli> diagnostic
#Software version, VPN tunnel state, system health, sysctl settings, routes and iptables
rc-cli> techsupport
#Packet captures
rc-cli> tcpdump <host>
Upload Results To Cisco Support Service Request
You can upload files to Support case through these steps:
Step 1. Log in to SCM.
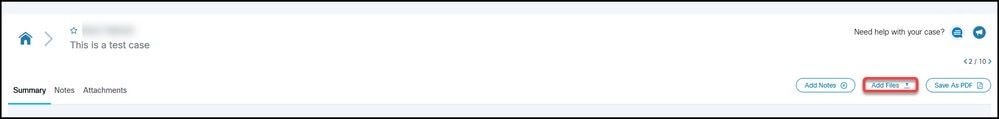
Step 2. In order to view and edit the case, click the case number or case title in the list. The Case Summary page opens.
Step 3. Click Add Files in order to choose a file and upload it as an attachment to the case. The system displays the SCM File Uploader tool.
Step 4. In the Choose Files to Upload dialog box, drag the files that you want to upload or click inside to browse your local machine for files to upload.
Step 5. Add a description and specify a category for all files, or individually.
Related Information
 Feedback