Troubleshoot Drain of FMC Unprocessed Frequent Health Alerts
Available Languages
Contents
Introduction
This document describes how to troubleshoot drain of unprocessed events and frequent drain of event health alerts on Firepower Management Center.
Problem Overview
The Firepower Management Center (FMC) generates one of these health alerts:
- Frequent drain of Unified Low Priority Events
- Drain of unprocessed events from Unified Low Priority Events
Although these events are generated and shown on the FMC, they relate to a managed device sensor whether it is a Firepower Threat Defense (FTD) device or a Next-Generation Intrusion Prevention System (NGIPS) device. For the rest of this document, the term sensor refers to both FTD and NGIPS devices unless otherwise specified.
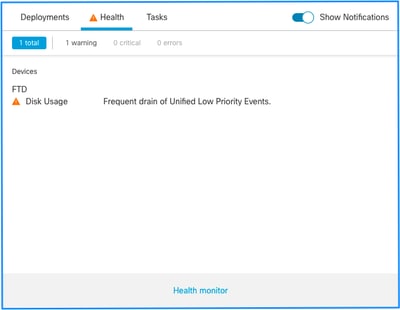
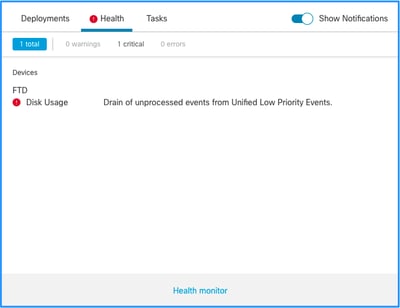
This is the health alert structure:
- Frequent drain of <SILO NAME>
- Drain of unprocessed events from <SILO NAME>
In this example, the SILO NAME is Unified Low Priority Events. This is one of the disk manager silos (see Background Information section for a more comprehensive explanation).
Additionally:
- Although any silo can technically generate a Frequent drain of <SILO NAME> health alert, the most commonly seen are the ones related to events and, amongst them, the Low Priority Events simply because these are the type of events more often generated by the sensors.
- A Frequent drain of <SILO NAME> event, has a warning severity in the case it is an event-related silo. If this were processed (explanation about what constitutes an unprocessed event is given next), they are in the FMC database.
- For a non-event related silo, such as a backup silo, the alert is critical as this information is lost.
- Only event type silos generate a Drain of unprocessed events from <SILO NAME> health alert. This alert always has critical severity.
Additional symptoms can include:
- Loss of events
- Slowness on the FMC UI
Common Troubleshoot Scenarios
A Frequent drain of <SILO NAME> event is caused by too much input into the silo for its size. In this case, the disk manager drains (purges) that file at least twice in the last 5-minute interval. In an event type silo, this is typically caused by excessive logging of that event type. If a Drain has unprocessed events of <SILO NAME> health alert, this can also be caused by a bottleneck in the event processing path.
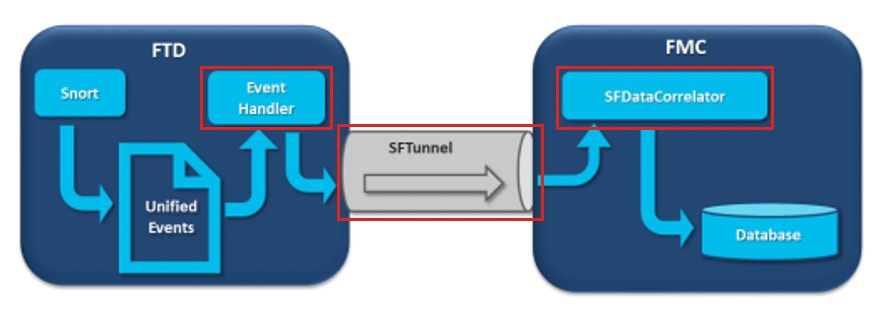
In the diagram, there are three potential bottlenecks:
- The EventHandler process on FTD is oversubscribed (it reads slower than what Snort writes).
- The Eventing interface is oversubscribed.
- The SFDataCorrelator process on FMC is oversubscribed.
To understand the Event Processing architecture, refer to the Deep Dive section.
Case 1. Excessive Logging
As stated in the previous section, one of the most common causes for health alerts of this type, is excessive input.
The difference between the Low Water Mark (LWM) and High Water Mark (HWM) (gathered from the show disk-manager CLISH command) shows how much space there is required to take on that silo. To go from LWM (freshly drained) to the HWM value, if there are frequent drains of events (with or without unprocessed events), you must first review the logging configuration.
For an in-depth explanation of the Disk Manager process, refer to the Deep Dive section.
Whether it is double logging or just a high rate of events on the overall manager-sensors ecosystem, a review of the logging settings must be done.
Recommended Actions
Step 1. Check for double logging
Double logging scenarios can be identified if you review the correlator perfstats on the FMC as shown in this output:
admin@FMC:~$ sudo perfstats -Cq < /var/sf/rna/correlator-stats/now
129 statistics lines read
                 host limit:                         50000            0                50000
                 pcnt host limit in use:             0.01             0.01             0.01
                 rna events/second:                  0.00             0.00             0.06
                 user cpu time:                      0.48             0.21             10.09
                 system cpu time:                    0.47             0.00             8.83
                 memory usage:                       2547304          0                2547304
                 resident memory usage:              28201            0                49736
                 rna flows/second:                   126.41           0.00             3844.16
                 rna dup flows/second:               69.71            0.00             2181.81
                 ids alerts/second:                  0.00             0.00             0.00
                 ids packets/second:                 0.00             0.00             0.00
                 ids comm records/second:            0.02             0.01             0.03
                 ids extras/second:                  0.00             0.00             0.00
                 fw_stats/second:                    0.00             0.00             0.03
                 user logins/second:                 0.00             0.00             0.00
                 file events/second:                 0.00             0.00             0.00
                 malware events/second:              0.00             0.00             0.00
                 fireamp events/second:              0.00             0.00             0.00
In this example, a high rate of duplicated flows can be seen in the output.
Step 2. Review the logging settings of the ACP
You must start with a review of the logging settings of the Access Control Policy (ACP). Ensure you use the best practices described in the Best Practices for Connection Logging.
A review of the logging settings is advisable in all situations as the recommendations listed do not just cover double logging scenarios.
To check the rate of generated events on FTD, check this file and focus on the TotalEvents and PerSec columns:
admin@firepower:/ngfw/var/log$ sudo more EventHandlerStats.2023-08-13 | grep Total | more
{"Time": "2023-08-13T00:03:37Z", "TotalEvents": 298, "PerSec": 0, "UserCPUSec": 0.995, "SysCPUSec": 4.598, "%CPU": 1.9, "MemoryKB": 33676}
{"Time": "2023-08-13T00:08:37Z", "TotalEvents": 298, "PerSec": 0, "UserCPUSec": 1.156, "SysCPUSec": 4.280, "%CPU": 1.8, "MemoryKB": 33676}
{"Time": "2023-08-13T00:13:37Z", "TotalEvents": 320, "PerSec": 1, "UserCPUSec": 1.238, "SysCPUSec": 4.221, "%CPU": 1.8, "MemoryKB": 33676}
{"Time": "2023-08-13T00:18:37Z", "TotalEvents": 312, "PerSec": 1, "UserCPUSec": 1.008, "SysCPUSec": 4.427, "%CPU": 1.8, "MemoryKB": 33676}
{"Time": "2023-08-13T00:23:37Z", "TotalEvents": 320, "PerSec": 1, "UserCPUSec": 0.977, "SysCPUSec": 4.465, "%CPU": 1.8, "MemoryKB": 33676}
{"Time": "2023-08-13T00:28:37Z", "TotalEvents": 299, "PerSec": 0, "UserCPUSec": 1.066, "SysCPUSec": 4.361, "%CPU": 1.8, "MemoryKB": 33676}
Step 3. Check whether excessive logging is expected
You must review whether excessive logging has an expected cause. If excessive logging is cause by DOS/DDoS attacks, routing loop, or a specific application/host that has a large number of connections; you must check and mitigate/stop connections from the unexpected/excessive connection sources.
Step 4. Check for corrupted diskmanager.log file
Normally, an entry can have 12 comma-separated values. To check for corrupted lines that have a different number of fields:
admin@firepower:/ngfw/var/log$ sudo cat diskmanager.log | awk -F',' 'NF != 12 {print}'
admin@firepower:/ngfw/var/log$
If there is a corrupted line with different than 12 fields are shown.
Step 5. Upgrade model
Upgrade the FTD hardware device to a higher performance model (for example, FPR2100 --> FPR4100), the source silo would increase.
Step 6. Consider whether you can disable Log to Ramdisk
In the case of a Unified Low Priority Events silo, you can disable Log to Ramdisk to increase the silo size. You can review the drawbacks in the Deep Dive section.
Case 2. A Bottleneck in the Communication Channel Between the Sensor and the FMC
Another common cause for this type of alert is connectivity issues and/or instability in the communication channel (sftunnel) between the sensor and the FMC. The communication issue can be due to:
- sftunnel is oversubscribed.
- sftunnel is down or is unstable (flaps).
For the sftunnel connectivity issue, ensure the FMC and sensor have reachability between their management interfaces on TCP port 8305.
On FTD, you can search for the sftunneld string in the [/ngfw]/var/log/messages file. Connectivity issues cause messages like these to be generated:
Sep  9 15:41:35 firepower SF-IMS[5458]: [27602] sftunneld:sf_ch_util [INFO] Delay for heartbeat reply on channel from 10.62.148.75 for 609 seconds. dropChannel...
Sep  9 15:41:35 firepower SF-IMS[5458]: [27602] sftunneld:sf_connections [INFO] Ping Event Channel for 10.62.148.75 failed
Sep  9 15:41:35 firepower SF-IMS[5458]: [27602] sftunneld:sf_channel [INFO] >> ChannelState dropChannel peer 10.62.148.75 / channelB / EVENT [ msgSock2 & ssl_context2 ] <<
Sep  9 15:41:35 firepower SF-IMS[5458]: [27602] sftunneld:sf_channel [INFO] >> ChannelState freeChannel peer 10.62.148.75 / channelB / DROPPED [ msgSock2 & ssl_context2 ] <<
Sep  9 15:41:35 firepower SF-IMS[5458]: [27602] sftunneld:sf_connections [INFO] Need to send SW version and Published Services to 10.62.148.75
Sep  9 15:41:35 firepower SF-IMS[5458]: [27602] sftunneld:sf_peers [INFO] Confirm RPC service in CONTROL channel
Sep  9 15:41:35 firepower SF-IMS[5458]: [27602] sftunneld:sf_channel [INFO] >> ChannelState do_dataio_for_heartbeat peer 10.62.148.75 / channelA / CONTROL [ msgSock & ssl_context ] <<
Sep  9 15:41:48 firepower SF-IMS[5458]: [5464] sftunneld:tunnsockets [INFO] Started listening on port 8305 IPv4(10.62.148.180) management0
Sep  9 15:41:51 firepower SF-IMS[5458]: [27602] sftunneld:control_services [INFO] Successfully Send Interfaces info to peer 10.62.148.75 over managemen
Sep  9 15:41:53 firepower SF-IMS[5458]: [5465] sftunneld:sf_connections [INFO] Start connection to : 10.62.148.75 (wait 10 seconds is up)
Sep  9 15:41:53 firepower SF-IMS[5458]: [27061] sftunneld:sf_peers [INFO] Peer 10.62.148.75 needs the second connection
Sep  9 15:41:53 firepower SF-IMS[5458]: [27061] sftunneld:sf_ssl [INFO] Interface management0 is configured for events on this Device
Sep  9 15:41:53 firepower SF-IMS[5458]: [27061] sftunneld:sf_ssl [INFO] Connect to 10.62.148.75 on port 8305 - management0
Sep  9 15:41:53 firepower SF-IMS[5458]: [27061] sftunneld:sf_ssl [INFO] Initiate IPv4 connection to 10.62.148.75 (via management0)
Sep  9 15:41:53 firepower SF-IMS[5458]: [27061] sftunneld:sf_ssl [INFO] Initiating IPv4 connection to 10.62.148.75:8305/tcp
Sep  9 15:41:53 firepower SF-IMS[5458]: [27061] sftunneld:sf_ssl [INFO] Wait to connect to 8305 (IPv6): 10.62.148.75
Oversubscription of the FMCs management interface can be a spike in management traffic or a constant oversubscription. Historical data from the Heath Monitor is a good indicator of this.
The first thing to note is in most cases, the FMC is deployed with a single NIC for management. This interface is used for:
- FMC management
- FMC sensor management
- FMC event collection from the sensors
- Update of Intelligence Feeds
- The download of SRU, Software, VDB, and GeoDB updates from the Software Download Site
- The query for URL Reputations and Categories (if applicable)
- The query for File Dispositions (if applicable)
Recommended Actions
You can deploy a second NIC on the FMC for an event dedicated interface. Implementations depend on the use case. General guidelines can be found in the FMC Hardware Guide - Deploying on a Management Network.
Case 3. A Bottleneck in the SFDataCorrelator Process
The last scenario covered is when a bottleneck happens on the SFDataCorrelator side (FMC).
The first step is to look into the diskmanager.log file as there is important information to gather such as:
- The frequency of the drain.
- The number of files with Unprocessed Events drained.
-
The occurrence of the drain with Unprocessed Events.
For information about the diskmanager.log file and how to interpret it, refer to the Disk Manager section. The information from the diskmanager.log can be used to help narrow down the subsequent steps.
Additionally, you must review the correlator performance statistics:
admin@FMC:~$ sudo perfstats -Cq < /var/sf/rna/correlator-stats/now
129 statistics lines read
                 host limit:                         50000            0                50000
                 pcnt host limit in use:             100.01           100.00           100.55
                 rna events/second:                  1.78             0.00             48.65
                 user cpu time:                      2.14             0.11             58.20
                 system cpu time:                    1.74             0.00             41.13
                 memory usage:                       5010148          0                5138904
                 resident memory usage:              757165           0                900792
                 rna flows/second:                   101.90           0.00             3388.23
                 rna dup flows/second:               0.00             0.00             0.00
                 ids alerts/second:                  0.00             0.00             0.00
                 ids packets/second:                 0.00             0.00             0.00
                 ids comm records/second:            0.02             0.01             0.03
                 ids extras/second:                  0.00             0.00             0.00
                 fw_stats/second:                    0.01             0.00             0.08
                 user logins/second:                 0.00             0.00             0.00
                 file events/second:                 0.00             0.00             0.00
                 malware events/second:              0.00             0.00             0.00
                 fireamp events/second:              0.00             0.00             0.01
These statistics relate to the FMC and correspond to the aggregate of all sensors managed by it. In the case of Unified low priority events, you mainly look for:
- Total flows per second of any event type to evaluate possible oversubscription of the SFDataCorrelator process.
- The two rows highlighted in the previous output:
- rna flows/second – Indicates the rate of low priority events processed by the SFDataCorrelator.
- rna dup flows/second - Indicates the rate of duplicated low priority events processed by the SFDataCorrelator. This is generated by double logging as discussed in the previous scenario.
Based on the output it can be concluded that:
- There is no duplicate logging as indicated by the rna dup flows/second row.
- In the rna flows/second row, the Maximum value is much higher than the average value, as there was a spike in the rate of events processed by the SFDataCorrelator process. This can be expected if you review early in the morning when your users workday has just started; in general, this is a red flag and requires further investigation.
More information on the SFDataCorrelator process can be found under the Event Processing section.
Recommended Actions
First, you must determine when the spike occurred. To do this, you must review the correlator statistics per each 5-minute sample interval. The information gathered from the diskmanager.log can help you review the critical timeframes.
admin@FMC:~$ sudo perfstats -C < /var/sf/rna/correlator-stats/now

<OUTPUT OMITTED FOR READABILITY>

Wed Sep  9 16:01:35 2020
                 host limit:                    50000
                 pcnt host limit in use:        100.14
                 rna events/second:             24.33
                 user cpu time:                 7.34
                 system cpu time:               5.66
                 memory usage:                  5007832
                 resident memory usage:         797168
                 rna flows/second:              638.55
                 rna dup flows/second:          0.00
                 ids alerts/second:             0.00
                 ids pkts/second:               0.00
                 ids comm records/second:       0.02
                 ids extras/second:             0.00
                 fw stats/second:               0.00
                 user logins/second:            0.00
                 file events/second:            0.00
                 malware events/second:         0.00
                 fireAMP events/second:         0.00


Wed Sep  9 16:06:39 2020
                 host limit:                    50000
                 pcnt host limit in use:        100.03
                 rna events/second:             28.69
                 user cpu time:                 16.04
                 system cpu time:               11.52
                 memory usage:                  5007832
                 resident memory usage:         801476
                 rna flows/second:              685.65
                 rna dup flows/second:          0.00
                 ids alerts/second:             0.00
                 ids pkts/second:               0.00
                 ids comm records/second:       0.01
                 ids extras/second:             0.00
                 fw stats/second:               0.00
                 user logins/second:            0.00
                 file events/second:            0.00
                 malware events/second:         0.00
                 fireAMP events/second:         0.00

Wed Sep  9 16:11:42 2020
                 host limit:                    50000
                 pcnt host limit in use:        100.01
                 rna events/second:             47.51
                 user cpu time:                 16.33
                 system cpu time:               12.64
                 memory usage:                  5007832
                 resident memory usage:         809528
                 rna flows/second:              1488.17
                 rna dup flows/second:          0.00
                 ids alerts/second:             0.00
                 ids pkts/second:               0.00
                 ids comm records/second:       0.02
                 ids extras/second:             0.00
                 fw stats/second:               0.01
                 user logins/second:            0.00
                 file events/second:            0.00
                 malware events/second:         0.00
                 fireAMP events/second:         0.00

Wed Sep  9 16:16:42 2020
                 host limit:                    50000
                 pcnt host limit in use:        100.00
                 rna events/second:             8.57
                 user cpu time:                 58.20
                 system cpu time:               41.13
                 memory usage:                  5007832
                 resident memory usage:         837732
                 rna flows/second:              3388.23
                 rna dup flows/second:          0.00
                 ids alerts/second:             0.00
                 ids pkts/second:               0.00
                 ids comm records/second:       0.01
                 ids extras/second:             0.00
                 fw stats/second:               0.03
                 user logins/second:            0.00
                 file events/second:            0.00
                 malware events/second:         0.00
                 fireAMP events/second:         0.00

197 statistics lines read

                 host limit:                         50000            0                50000
                 pcnt host limit in use:             100.01           100.00           100.55
                 rna events/second:                  1.78             0.00             48.65
                 user cpu time:                      2.14             0.11             58.20
                 system cpu time:                    1.74             0.00             41.13
                 memory usage:                       5010148          0                5138904
                 resident memory usage:              757165           0                900792
                 rna flows/second:                   101.90           0.00             3388.23
                 rna dup flows/second:               0.00             0.00             0.00
                 ids alerts/second:                  0.00             0.00             0.00
                 ids packets/second:                 0.00             0.00             0.00
                 ids comm records/second:            0.02             0.01             0.03
                 ids extras/second:                  0.00             0.00             0.00
                 fw_stats/second:                    0.01             0.00             0.08
                 user logins/second:                 0.00             0.00             0.00
                 file events/second:                 0.00             0.00             0.00
                 malware events/second:              0.00             0.00             0.00
                 fireamp events/second:              0.00             0.00             0.01
Use the information in the output to:
- Determine the normal/baseline rate of events.
- Determine the 5-minute interval when the spike happened.
In the previous example, there is an obvious spike in the rate of events received at 16:06:39 and beyond. These are 5-minute averages, so the increase can be more abrupt than shown (burst), however, diluted in this 5-minute interval if it started towards the end of it.
This leads to the conclusion this spike of events caused the Drain of unprocessed events. You can see the connection of events from the FMC Graphical User Interface (GUI) with the appropriate time window to understand the type of connections that traversed the FTD box in this spike:
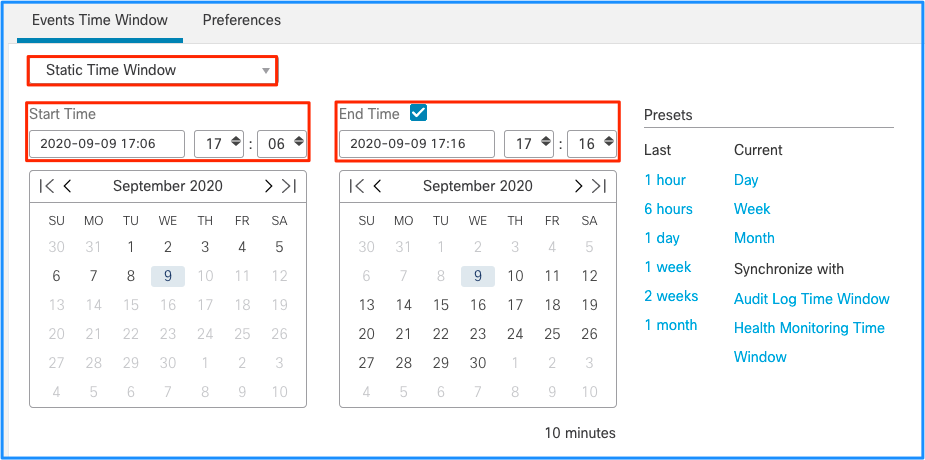
Apply this time window to view the filtered Connection Events (do not forget to account for the time zone.) In this example, the sensor uses UTC and the FMC UTC+1. Use the Table View to view the events that triggered the overload of events and take action accordingly:
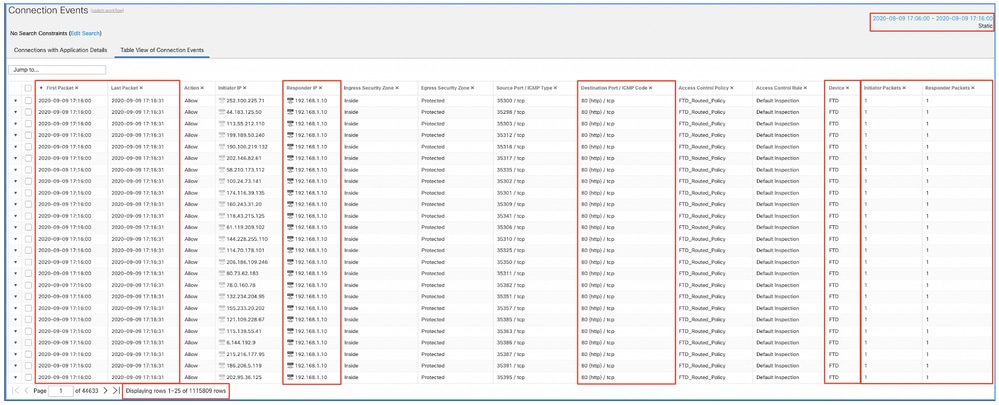
Based on the timestamps (time of the first and last packet), it can be seen these are short-lived connections. The Initiator and Responder Packet columns show there was only one packet exchanged in each direction. This confirms the connections were short-lived and exchanged very little data.
You can see all the flows target the same responder IPs and port. Also, they are all reported by the same sensor (which alongside Ingress and Egress interface information can speak to the place and direction of the flows). Additional actions:
- Check the Syslogs on the destination endpoint.
- Implement DOS/DDOS protection, or take other preventive measures.

Note: The intent of this article is to provide guidelines to troubleshoot the Drain of Unprocessed Event alerts. This example used hping3 to generate a TCP SYN flood to the destination server. For guidelines to harden your FTD device, refer to the Cisco Firepower Threat Defense Hardening Guide.
Items to Collect Before Contacting Cisco Technical Assistance Center (TAC)
It is highly recommended to collect these items before you contact Cisco TAC:
- Screenshot(s) of the health alerts seen.
- Troubleshoot file generated from the FMC.
- Troubleshoot file generated from the affected sensor.
- Date and Time when the problem first started.
- Information on any recent changes to the policies (if applicable).
- The output of the stats_unified.pl command as described in the Event Processing section (with a mention of the affected sensors).
Deep Dive
This section covers an in-depth explanation of the various components that can take part in the types of health alerts. This includes:
- Event Processing: Covers the path events take on both the sensor devices and the FMC. This is mainly useful when the health alert refers to an event-type Silo.
- Disk Manager: Covers the disk manager process, silos, and how they are drained.
- Health Monitor: Covers how the Health Monitor modules are used to generate health alerts.
- Log to Ramdisk: Covers the logging to ramdisk feature and its potential impact on health alerts.
To understand the Drain of Events health alerts and identify potential failure points, you must look into how these components function and interact with each other.
Event Processing
While the Frequent Drain type of health alerts can be triggered by silos that are not event-related, the vast majority of the cases seen by Cisco TAC are related to drain event-related information. Additionally, to understand what constitutes a drain of unprocessed events, you must look at the event processing architecture and its components.
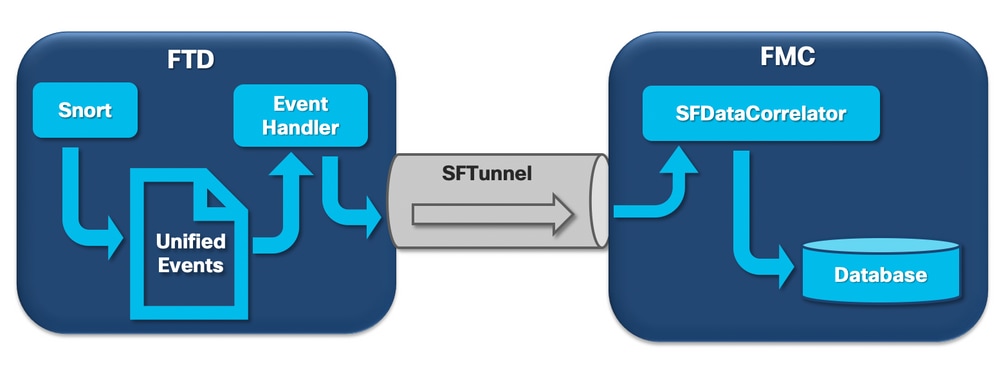
When a Firepower sensor receives a packet from a new connection, the snort process generates an event in the unified2 format which is a binary format that allows for quicker read/write, as well as lighter events.
The output shows the FTD command system support trace, where you can see a new connection was created. The important parts are highlighted and explained:
192.168.0.2-42310 - 192.168.1.10-80 6 AS 1-1 CID 0 Packet: TCP, SYN, seq 3310981951
192.168.0.2-42310 - 192.168.1.10-80 6 AS 1-1 CID 0 Session: new snort session
192.168.0.2-42310 - 192.168.1.10-80 6 AS 1-1 CID 0 AppID: service unknown (0), application unknown (0)
192.168.0.2-42310 > 192.168.1.10-80 6 AS 1-1 I 0 new firewall session
192.168.0.2-42310 > 192.168.1.10-80 6 AS 1-1 I 0 using HW or preset rule order 4, 'Default Inspection', action Allow and prefilter rule 0
192.168.0.2-42310 > 192.168.1.10-80 6 AS 1-1 I 0 HitCount data sent for rule id: 268437505,
192.168.0.2-42310 > 192.168.1.10-80 6 AS 1-1 I 0 allow action
192.168.0.2-42310 - 192.168.1.10-80 6 AS 1-1 CID 0 Firewall: allow rule, 'Default Inspection', allow
192.168.0.2-42310 - 192.168.1.10-80 6 AS 1-1 CID 0 Snort id 0, NAP id 1, IPS id 0, Verdict PASS
Snort unified_events files are generated per instance under the path [/ngfw]var/sf/detection_engine/*/instance-N/, where:
- * is the Snort UUID. This is unique per appliance.
- N is the Snort instance ID which can be calculated as the instance ID from the previous output (the highlighted 0 in the example) + 1
There can be 2 types of unified_events files in any given Snort instance folder:
- unified_events-1 (Which contains high priority events.)
- unified_events-2 (Which contains low priority events.)
A high priority event, is an event that corresponds to a potentially malicious connection.
Types of events and their priority:
| High Priority (1) |
Low Priority (2) |
| Intrusion |
Connection |
| Malware |
Discovery |
| Security Intelligence |
File |
| Associated Connection Events |
Statistics |
The next output shows an event that belongs to the new connection traced in the previous example. The format is unified2 and is taken from the output of the respective unified event log located under [/ngfw]/var/sf/detection_engine/*/instance-1/ where 1 is the snort instance ID in bold in the previous output +1. The unified event log format name uses the syntax unified_events-2.log.1599654750 where 2 stands for the priority of the events as shown in the table and the last portion in bold (1599654750) is the timestamp (Unix time) of when the file was created.

Tip: You can use the Linux date command to convert the Unix time into a readable date:
admin@FP1120-2:~$ sudo date -d@1599654750
Wed Sep 9 14:32:30 CEST 2020
Unified2 Record at offset 2190389
  Type: 210(0x000000d2)
  Timestamp: 0
  Length: 765 bytes
Forward to DC: Yes
FlowStats:
        Sensor ID: 0
        Service: 676
        NetBIOS Domain: <none>
        Client App: 909, Version: 1.20.3 (linux-gnu)
        Protocol: TCP
        Initiator Port: 42310
        Responder Port: 80
        First Packet: (1599662092) Tue Sep 9 14:34:52 2020
        Last Packet: (1599662092) Tue Sep 9 14:34:52 2020

<OUTPUT OMITTED FOR READABILITY>

        Initiator: 192.168.0.2
        Responder: 192.168.1.10
        Original Client: ::
        Policy Revision: 00000000-0000-0000-0000-00005f502a92
        Rule ID: 268437505
        Tunnel Rule ID: 0
        Monitor Rule ID: <none>
        Rule Action: 2
Alongside every unified_events file, there is a bookmark file which contains 2 important values:
- Timestamp correspondent to the current unified_events file for that instance and priority.
- Position in bytes for the last read event on the unified_event file.
The values are in order separated by a comma, as shown in this example:
root@FTD:/home/admin# cat /var/sf/detection_engines/d5a4d5d0-6ddf-11ea-b364-2ac815c16717/instance-1/unified_events-2.log.bookmark.1a3d52e6-3e09-11ea-838f-68e7af919059
1599862498,   18754115
This allows the disk manager process to know which events have already been processed (sent to FMC) and which ones have not.
Note: When the disk manager drains an event silo, it removes unified event files.
For more information about the drain of silos refer to the Disk Manager section.
A drained unified file is deemed to have unprocessed events when one of these is true:
- The bookmark timestamp is lower than the file creation time.
- The bookmark timestamp is the same as the file creation time and the position in Bytes in the file is lower than it’s size.
The EventHandler process reads events from the unified files and streams them to the FMC (as metadata) via sftunnel, which is the process responsible for encrypted communication between the sensor and the FMC. This is a TCP based connection so the event streaming is acknowledged by the FMC
You can see these messages in the [/ngfw]/var/log/messages file:
sfpreproc:OutputFile [INFO] *** Opening /ngfw/var/sf/detection_engines/77d31ce2-c2fc-11ea-b470-d428d53ed3ae/instance-1/unified_events-2.log.1597810478 for output" in /var/log/messages

EventHandler:SpoolIterator [INFO] Opened unified event file /var/sf/detection_engines/77d31ce2-c2fc-11ea-b470-d428d53ed3ae/instance-1/unified_events-2.log.1597810478

sftunneld:FileUtils [INFO] Processed 10334 events from log file var/sf/detection_engines/77d31ce2-c2fc-11ea-b470-d428d53ed3ae/instance-1/unified_events-2.log.1597810478
This output provides:
- Snort opened the unified_events file for output (to write in it).
- Event Handler opened the same unified_events file (to read from it).
- sftunnel reported the number of events processed from that unified_events file.
The bookmark file is then updated accordingly. The sftunnel uses two different channels called Unified Events (UE) Channel 0 and 1 for high and low priority events respectively.
With the sfunnel_status CLI command on the FTD, you can view the number of events that were streamed.
Priority UE Channel 1 service

TOTAL TRANSMITTED MESSAGES <530541> for UE Channel service
RECEIVED MESSAGES <424712> for UE Channel service
SEND MESSAGES <105829> for UE Channel service
FAILED MESSAGES <0> for UE Channel service
HALT REQUEST SEND COUNTER <17332> for UE Channel service
STORED MESSAGES for UE Channel service (service 0/peer 0)
STATE <Process messages> for UE Channel service
REQUESTED FOR REMOTE <Process messages> for UE Channel service
REQUESTED FROM REMOTE <Process messages> for UE Channel service
In the FMC, the events are received by the SFDataCorrelator process. The status of events that were processed from each sensor can be seen by running the stats_unified.pl command:
admin@FMC:~$ sudo stats_unified.pl
Current Time - Fri Sep 9 23:00:47 UTC 2020

**********************************************************************************
* FTD - 60a0526e-6ddf-11ea-99fa-89a415c16717, version 6.6.0.1
**********************************************************************************
  Channel Backlog Statistics (unified_event_backlog)
    Chan    Last Time              Bookmark Time          Bytes Behind
       0    2020-09-09 23:00:30    2020-09-07 10:41:50               0
       1    2020-09-09 23:00:30    2020-09-09 22:14:58            6960
This command shows the status of the backlog of events for certain device per channel and the Channel ID used is the same as the sftunnel. The Bytes Behind value can be computed as the difference between the position shown in the unified event bookmark file and the size of the unified event file (plus any subsequent file with a higher timestamp than the one in the bookmark file.)
The SFDataCorrelator process also stores performance statistics, which are saved in /var/sf/rna/correlator-stats/. One file is created per day to store the performance statistics for that day in CSV format. The name of the file uses the format YYYY-MM-DD and the file correspondent to the current day is called now.
The statistics are gathered every 5-minutes (there is one line per each 5-minute interval).
The output of this file can be read by running the perfstats command.
Note: This command is also used to read snort performance statistics files, so the appropriate flags must be used.
-C: Instructs perfstats the input is a correlator-stats file (without this flag, perfstats assumes the input is a snort performance statistics file).
-q: Quiet mode prints only the summary for the file.
admin@FMC:~$ sudo perfstats -Cq < /var/sf/rna/correlator-stats/now
287 statistics lines read

                 host limit:                         50000            0                50000
                 pcnt host limit in use:             100.01           100.00           100.55
                 rna events/second:                  1.22             0.00             48.65
                 user cpu time:                      1.56             0.11             58.20
                 system cpu time:                    1.31             0.00             41.13
                 memory usage:                       5050384          0                5138904
                 resident memory usage:              801920           0                901424
                 rna flows/second:                   64.06            0.00             348.15
                 rna dup flows/second:               0.00             0.00             37.05
                 ids alerts/second:                  1.49             0.00             4.63
                 ids packets/second:                 1.71             0.00             10.10
                 ids comm records/second:            3.24             0.00             12.63
                 ids extras/second:                  0.01             0.00             0.07
                 fw_stats/second:                    1.78             0.00             5.72
                 user logins/second:                 0.00             0.00             0.00
                 file events/second:                 0.00             0.00             3.25
                 malware events/second:              0.00             0.00             0.06
                 fireamp events/second:              0.00             0.00             0.00
Each row in the summary has three values in this order: Average, Minimum, Maximum.
If you print without the -q flag, you also see the 5-minute interval values (the summary is shown in the end.)
Note: Each FMC has a maximum flow rate described on its datasheet. The next table contains the values per module taken from the respective datasheet.
| Model |
FMC 750 |
FMC 1000 |
FMC 1600 |
FMC 2000 |
FMC 2500 |
FMC 2600 |
FMC 4000 |
FMC 4500 |
FMC 4600 |
FMCv |
FMCv300 |
| Maximum Flow Rate (fps) |
2000 |
5000 |
5000 |
12000 |
12000 |
12000 |
20000 |
20000 |
20000 |
Variable |
12000 |
Note: These values are for the aggregate of all event types shown in bold on the SFDataCorrelator statistics output.
If you look at the output and you size the FMC that you are prepared for the worst-case scenario (when all maximum values occur at the same time), then the rate of events this FMC sees is 48.65 + 348.15 + 4.63 + 3.25 + 0.06 = 404.74 fps.
The total value can be compared with the value from the datasheet of the respective model.
The SFDataCorrelator can also make additional work on top of the received events (such as Correlation Rules), it then stores them into the database, which is queried to populate various information in the FMC GUI, such as Dashboards and Event Views.
Disk Manager
The next diagram shows the logical components for both the Health Monitor and Disk Manager processes as they are intertwined for the generation of disk-related health alerts.
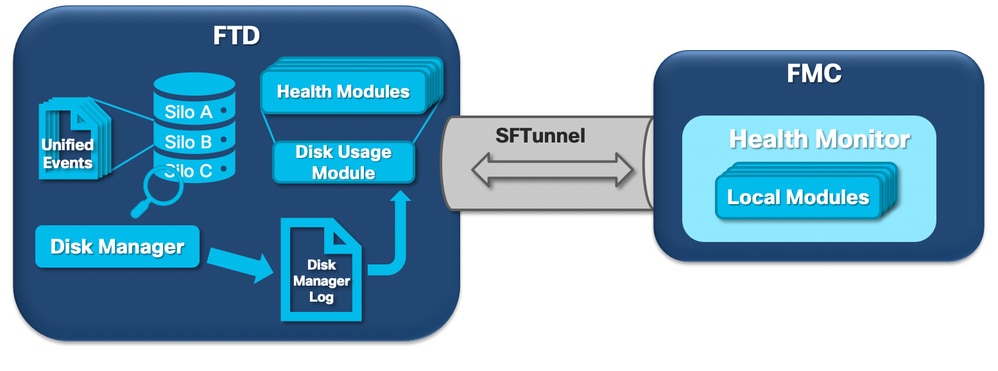
In a nutshell, the disk manager process manages the disk usage of the box and it has its configuration files in the [/ngfw]/etc/sf/ folder. There are multiple configuration files for the disk manager process that are used under certain circumstances:
- diskmanager.conf: Standard configuration file.
- diskmanager_2hd.conf: Used when the box has two hard drives installed. The second hard drive is the one related to the Malware Expansion that is used to store files as defined in the file policy.
- ramdisk-diskmanager.conf: Used when the log to Ramdisk is enabled. Refer to the Log to Ramdisk section.
Each type of file monitored by the disk manager which is assigned a Silo. Based on the amount of disk space available on the system, the disk manager computes a High Water Mark (HWM) and a Low Water Mark (LWM) for each silo. When the disk manager process drains a silo, it does so up until the LWM is reached. Since events are drained per file, this threshold can be crossed.
To check the status of silos on a sensor device, you can run this command:
> show disk-manager
Silo                                    Used        Minimum     Maximum
misc_fdm_logs                           0 KB        65.208 MB   130.417 MB
Temporary Files                         0 KB        108.681 MB  434.726 MB
Action Queue Results                    0 KB        108.681 MB  434.726 MB
User Identity Events                    0 KB        108.681 MB  434.726 MB
UI Caches                               4 KB        326.044 MB  652.089 MB
Backups                                 0 KB        869.452 MB  2.123 GB
Updates                                 304.367 MB  1.274 GB    3.184 GB
Other Detection Engine                  0 KB        652.089 MB  1.274 GB
Performance Statistics                  45.985 MB   217.362 MB  2.547 GB
Other Events                            0 KB        434.726 MB  869.452 MB
IP Reputation & URL Filtering           0 KB        543.407 MB  1.061 GB
arch_debug_file                         0 KB        2.123 GB    12.736 GB
Archives & Cores & File Logs            0 KB        869.452 MB  4.245 GB
Unified Low Priority Events             974.109 MB  1.061 GB    5.307 GB
RNA Events                              879 KB      869.452 MB  3.396 GB
File Capture                            0 KB        2.123 GB    4.245 GB
Unified High Priority Events            252 KB      3.184 GB    7.429 GB
IPS Events                              3.023 MB    2.547 GB    6.368 GB
The disk manager process runs when one of these conditions is met:
- The process starts (or restarts)
- A Silo reaches the HWM
- A Silo is manually drained
- Once every hour
Each time the disk manager process runs, it generates an entry for each of the different silos on its own log file which is located under [/ngfw]/var/log/diskmanager.log and has data in a CSV format.
Next, a sample line from the diskmanager.log file is shown. It was taken from a sensor that triggered the Drain of unprocessed events from the Unified Low Priority Events health alert, as well as the breakdown of the respective columns:
priority_2_events,1599668981,221,4587929508,1132501868,20972020,4596,1586044534,5710966962,1142193392,110,0
| Column | Value |
| Silo Label |
priority_2_events |
| Time of drain (Epoch time) |
1599668981 |
| Number of files drained | 221 |
| Bytes drained | 4587929508 |
| Current size of data after drain (Bytes) | 1132501868 |
| Largest file drained (Bytes) | 20972020 |
| Smallest file drained (Bytes) | 4596 |
| Oldest file drained (Epoch time) | 1586044534 |
| High watermark (Bytes) | 5710966962 |
| Low watermark (Bytes) | 1142193392 |
| Number of files with unprocessed events drained | 110 |
| Diskmanager state flag | 0 |
This information is then read by the respective Health Monitor module to trigger the related health alert.
Drain a Silo Manually
In certain scenarios, you can drain a silo manually. For example, to clear disk space with a manual silo drain, manual file removals have the benefit of allowing the disk manager to decide which files to keep and which to delete. The disk manager saves the most recent files for that silo.
Any silo can be drained and this operates as described (the disk manager drains data until the amount of data goes under the LWM threshold). The command system support silo-drain is available on FTD CLISH mode and provides a list of available silos (name + numeric id).
This is an example of a manual drain of the Unified Low Priority Events silo:
> show disk-manager
Silo                                    Used        Minimum     Maximum
misc_fdm_logs                           0 KB        65.213 MB   130.426 MB
Temporary Files                         0 KB        108.688 MB  434.753 MB
Action Queue Results                    0 KB        108.688 MB  434.753 MB
User Identity Events                    0 KB        108.688 MB  434.753 MB
UI Caches                               4 KB        326.064 MB  652.130 MB
Backups                                 0 KB        869.507 MB  2.123 GB
Updates                                 304.367 MB  1.274 GB    3.184 GB
Other Detection Engine                  0 KB        652.130 MB  1.274 GB
Performance Statistics                  1.002 MB    217.376 MB  2.547 GB
Other Events                            0 KB        434.753 MB  869.507 MB
IP Reputation & URL Filtering           0 KB        543.441 MB  1.061 GB
arch_debug_file                         0 KB        2.123 GB    12.737 GB
Archives & Cores & File Logs            0 KB        869.507 MB  4.246 GB
Unified Low Priority Events             2.397 GB    1.061 GB    5.307 GB
RNA Events                              8 KB        869.507 MB  3.397 GB
File Capture                            0 KB        2.123 GB    4.246 GB
Unified High Priority Events            0 KB        3.184 GB    7.430 GB
IPS Events                              0 KB        2.547 GB    6.368 GB

> system support silo-drain
Available Silos
  1 - misc_fdm_logs
  2 - Temporary Files
  3 - Action Queue Results
  4 - User Identity Events
  5 - UI Caches
  6 - Backups
  7 - Updates
  8 - Other Detection Engine
  9 - Performance Statistics
 10 - Other Events
 11 - IP Reputation & URL Filtering
 12 - arch_debug_file
 13 - Archives & Cores & File Logs
 14 - Unified Low Priority Events
 15 - RNA Events
 16 - File Capture
 17 - Unified High Priority Events
 18 - IPS Events
  0 - Cancel and return

Select a Silo to drain: 14
Silo Unified Low Priority Events being drained.

> show disk-manager
Silo                                    Used        Minimum     Maximum
misc_fdm_logs                           0 KB        65.213 MB   130.426 MB
Temporary Files                         0 KB        108.688 MB  434.753 MB
Action Queue Results                    0 KB        108.688 MB  434.753 MB
User Identity Events                    0 KB        108.688 MB  434.753 MB
UI Caches                               4 KB        326.064 MB  652.130 MB
Backups                                 0 KB        869.507 MB  2.123 GB
Updates                                 304.367 MB  1.274 GB    3.184 GB
Other Detection Engine                  0 KB        652.130 MB  1.274 GB
Performance Statistics                  1.002 MB    217.376 MB  2.547 GB
Other Events                            0 KB        434.753 MB  869.507 MB
IP Reputation & URL Filtering           0 KB        543.441 MB  1.061 GB
arch_debug_file                         0 KB        2.123 GB    12.737 GB
Archives & Cores & File Logs            0 KB        869.507 MB  4.246 GB
Unified Low Priority Events             1.046 GB    1.061 GB    5.307 GB
RNA Events                              8 KB        869.507 MB  3.397 GB
File Capture                            0 KB        2.123 GB    4.246 GB
Unified High Priority Events            0 KB        3.184 GB    7.430 GB
IPS Events                              0 KB        2.547 GB    6.368 GB
Health Monitor
These are the main points:
- Any health alert seen on the FMC in the Health Monitor menu or under the Health tab in the Message Center is generated by the Health Monitor process.
- This process monitors the health of the system, both for the FMC and the managed sensors and is composed of a number of different modules.
- Health alert modules are defined in the Health Policy, which can be attached per device.
- Health alerts are generated by the Disk Usage module that can run on each of the sensors managed by the FMC.
- When the Health Monitor process on the FMC runs (once every 5-minutes or when a manual run is triggered), the Disk Usage module checks the diskmanager.log file and, if the correct conditions are met, the respective health alert is triggered.
For a Drain of Unprocessed events health alert to be triggered, all these conditions must be true:
- Bytes drained field is greater than 0 (this indicates the data from this silo was drained).
- The number of files with unprocessed events drained greater than 0 (this indicates there were unprocessed events within the drained data).
- The time of the drain is within the last 1 hour.
For a Frequent Drain of events health alert to be triggered, these conditions must be true:
- The last two entries on the diskmanager.log file must be true:
- Bytes drained field is greater than 0 (this indicates the data from this silo was drained).
- Be less than 5-minutes apart.
- The time of drain in the last entry for this silo is within the last 1 hour.
The results gathered from the disk usage module (and the results gathered by other modules) are sent to the FMC via sftunnel. You can see counters for the Health Events exchanged over sftunnel by running the sftunnel_status command:
TOTAL TRANSMITTED MESSAGES <3544> for Health Events service
RECEIVED MESSAGES <1772> for Health Events service
SEND MESSAGES <1772> for Health Events service
FAILED MESSAGES <0> for Health Events service
HALT REQUEST SEND COUNTER <0> for Health Events service
STORED MESSAGES for Health service (service 0/peer 0)
STATE <Process messages> for Health Events service
REQUESTED FOR REMOTE <Process messages> for Health Events service
REQUESTED FROM REMOTE <Process messages> for Health Events service
Log to Ramdisk
While most events are stored in disk, the device is configured by default to log to ramdisk to prevent gradual damage to the SSD that can be caused by constant writes and deletes of events to disk.
In this scenario, the events are not stored under [/ngfw]/var/sf/detection_engine/*/instance-N/, however, they are located in [/ngfw]/var/sf/detection_engines/*/instance-N/connection/, which is a symbolic link to /dev/shm/instance-N/connection. In this case, the events reside in virtual memory rather than physical.
admin@FTD4140:~$ ls -la /ngfw/var/sf/detection_engines/b0c4a5a4-de25-11ea-8ec3-4df4ea7207e3/instance-1/connection
lrwxrwxrwx 1 sfsnort sfsnort 30 Sep  9 19:03 /ngfw/var/sf/detection_engines/b0c4a5a4-de25-11ea-8ec3-4df4ea7207e3/instance-1/connection -> /dev/shm/instance-1/connection
To verify which device is currently configured to run the show log-events-to-ramdisk command from the FTD CLISH. You can also change this if you run the command configure log-events-to-ramdisk <enable/disable>:
> show log-events-to-ramdisk
Logging connection events to RAM Disk.

> configure log-events-to-ramdisk
Enable or Disable  enable or disable (enable/disable)

Warning: When the configure log-events-to-ramdisk disable command is executed, there is a requirement for two deployments to be completed on the FTD for snort not to get stuck in a D state (Uninterruptible Sleep), which would cause a traffic outage.
This behavior is documented with Cisco bug ID CSCvz53372. With the first deployment, the reassessment of the snort memory stage is skipped, which causes snort to go in a D state. The workaround is to create another deployment with any dummy changes.
When you log into ramdisk, the main drawback is the respective silo has a smaller space allocated and drains them more often under the same circumstances. The next output is the disk manager from an FPR 4140 with and without the log events to ramdisk enabled for comparison.
Log to Ramdisk enabled:
> show disk-manager
Silo                                    Used        Minimum     Maximum
Temporary Files                         0 KB        903.803 MB  3.530 GB
Action Queue Results                    0 KB        903.803 MB  3.530 GB
User Identity Events                    0 KB        903.803 MB  3.530 GB
UI Caches                               4 KB        2.648 GB    5.296 GB
Backups                                 0 KB        7.061 GB    17.652 GB
Updates                                 305.723 MB  10.591 GB   26.479 GB
Other Detection Engine                  0 KB        5.296 GB    10.591 GB
Performance Statistics                  19.616 MB   1.765 GB    21.183 GB
Other Events                            0 KB        3.530 GB    7.061 GB
IP Reputation & URL Filtering           0 KB        4.413 GB    8.826 GB
arch_debug_file                         0 KB        17.652 GB   105.914 GB
Archives & Cores & File Logs            0 KB        7.061 GB    35.305 GB
RNA Events                              0 KB        7.061 GB    28.244 GB
File Capture                            0 KB        17.652 GB   35.305 GB
Unified High Priority Events            0 KB        17.652 GB   30.892 GB
Connection Events                       0 KB        451.698 MB  903.396 MB
IPS Events                              0 KB        12.357 GB   26.479 GB
Log to Ramdisk disabled:
> show disk-manager
Silo                                    Used        Minimum     Maximum
Temporary Files                         0 KB        976.564 MB  3.815 GB
Action Queue Results                    0 KB        976.564 MB  3.815 GB
User Identity Events                    0 KB        976.564 MB  3.815 GB
UI Caches                               4 KB        2.861 GB    5.722 GB
Backups                                 0 KB        7.629 GB    19.074 GB
Updates                                 305.723 MB  11.444 GB   28.610 GB
Other Detection Engine                  0 KB        5.722 GB    11.444 GB
Performance Statistics                  19.616 MB   1.907 GB    22.888 GB
Other Events                            0 KB        3.815 GB    7.629 GB
IP Reputation & URL Filtering           0 KB        4.768 GB    9.537 GB
arch_debug_file                         0 KB        19.074 GB   114.441 GB
Archives & Cores & File Logs            0 KB        7.629 GB    38.147 GB
Unified Low Priority Events             0 KB        9.537 GB    47.684 GB
RNA Events                              0 KB        7.629 GB    30.518 GB
File Capture                            0 KB        19.074 GB   38.147 GB
Unified High Priority Events            0 KB        19.074 GB   33.379 GB
IPS Events                              0 KB        13.351 GB   28.610 GB
The smaller size of the silo is compensated by the higher speed to access the events and stream them to the FMC. This is a better option under proper conditions, while the drawback must be considered.
Frequently Asked Questions (FAQ)
Q: Are the Drain of Events health alerts only generated by Connection Events?
A: No.
- Alerts of Frequent Drain can be generated by any disk manager Silo.
- Alerts of Drain of Unprocessed Events can be generated by any event-related Silo. Connection Events are the most common culprit.
Q: Is it always advisable to disable a Log to Ramdisk when a Frequent Drain health alert is seen?
A: No. Only in Excessive Logging scenarios, except for DOS/DDOS when the affected Silo is the Connection Events Silo, and only in cases where it is not possible to further tune the Logging Settings. If DOS/DDOS causes excessive Logging, the solution is to implement DOS/DDOS protection or to eliminate the source(s) of the DOS/DDOS attacks.
The default feature Log to Ramdisk reduces the SSD wear out, so, it is strongly recommended to use it.
Q: What constitutes an unprocessed event?
A: Events are not individually marked as unprocessed. A file has unprocessed events when:
- The creation timestamp is higher than the timestamp field in the respective bookmark file.
or
- The creation timestamp is equal to the timestamp field in the respective bookmark file and its size is higher than the position in the Bytes field on the respective bookmark file.
Q: How does the FMC know the number of Bytes behind for a particular sensor?
A: The sensor sends metadata on the unified_events file name and size as well as the information on the bookmark files, which provides FMC enough information to compute the bytes behind as:
Current unified_events file size - Position in Bytes field from bookmark file + Size of all unified_events files with higher timestamp than the timestamp in the respective bookmark file.
Known Issues
1. Open the Bug Search Tool and use this query:

Revision History
| Revision | Publish Date | Comments |
|---|---|---|
4.0 |
10-Jul-2026
|
Updated title (too long), spelling, grammar, inserted lines to separate sections for readability, updated alt text, and CCW alerts. |
3.0 |
03-May-2024
|
Updated Introduction, PII, Alt Text, Machine Translation, Link Targets, and Formatting. |
1.0 |
25-Sep-2020
|
Initial Release |

 Feedback
Contact Cisco
- Open a Support Case

- (Requires a Cisco Service Contract)