Troubleshoot Debug Log Collection in Secure Endpoint for Windows Devices
Available Languages
Introduction
This document describes how to generate a Debug Bundle file from Cisco Secure Endpoint Connector on Windows.
Prerequisites
Requirements
Required knowledge: Cisco Secure Endpoint Connector.
Components Used
The information in this document applies to:
- Microsoft Windows
- Cisco Secure Endpoint Connector for Windows:
- Version 7.x.x and later (procedure in Version 7.5.5 and later)
- Version 8.x.x and later (Cisco Secure Client; procedure in Version 8.0.1 and later (Cisco Secure Client))
The information in this document was created from the devices in a specific lab environment. All of the devices used in this document started with a cleared (default) configuration. If your network is live, ensure that you understand the potential impact of any command.
Background Information
For performance issues with Cisco Secure Endpoint Connector on the Microsoft Windows operating system, contact the Cisco Technical Assistance Center (TAC). A Cisco Technical Support Engineer analyzes the logs available in the Debug Bundle file in order to identify the root cause.
Collect Debug Log Files in Cisco Secure Endpoint for Windows
Version 7.5.5 and earlier
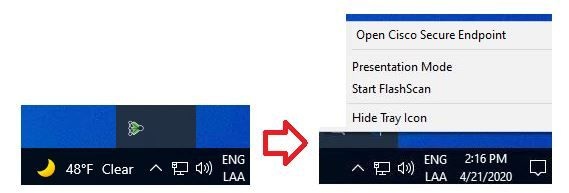
Step 1. Click the Cisco Secure Endpoint tray icon on the taskbar, and then click Open Cisco Secure Endpoint, as shown in the image.
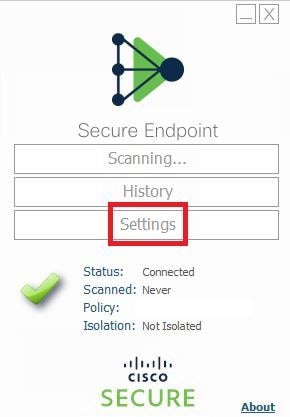
Step 2. Click Settings in Secure Endpoint Connector, as shown in the image.
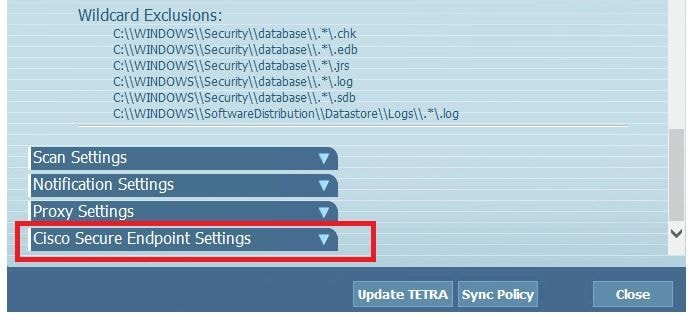
Step 3. Choose Settings > Cisco Secure Endpoint Connector Settings, as shown in the image.
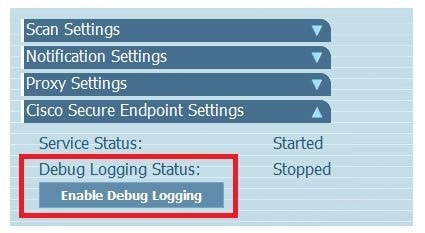
Step 4. Click Enable Debug Logging, as shown in the image.
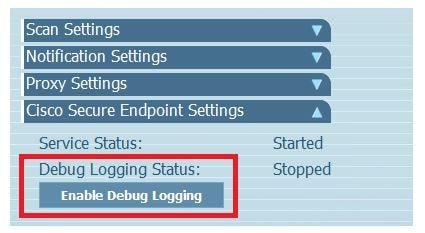
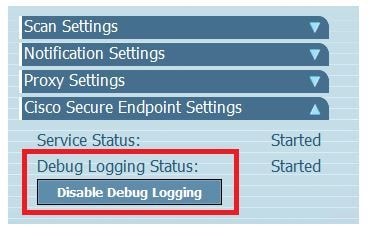
Step 5. The button name changes to Disable Debug Logging. Debug mode is now enabled, as shown in the image.
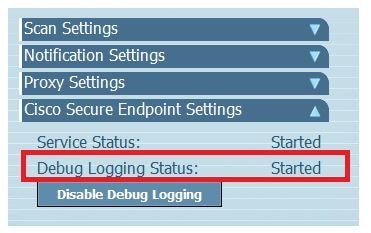
Step 6. Recreate the issue and let the device run for at least 30 minutes.
Step 7. After 30 minutes, open Windows Search and type Support Diagnostic Tool. Run the tool with Administrator privileges, as shown in the image.
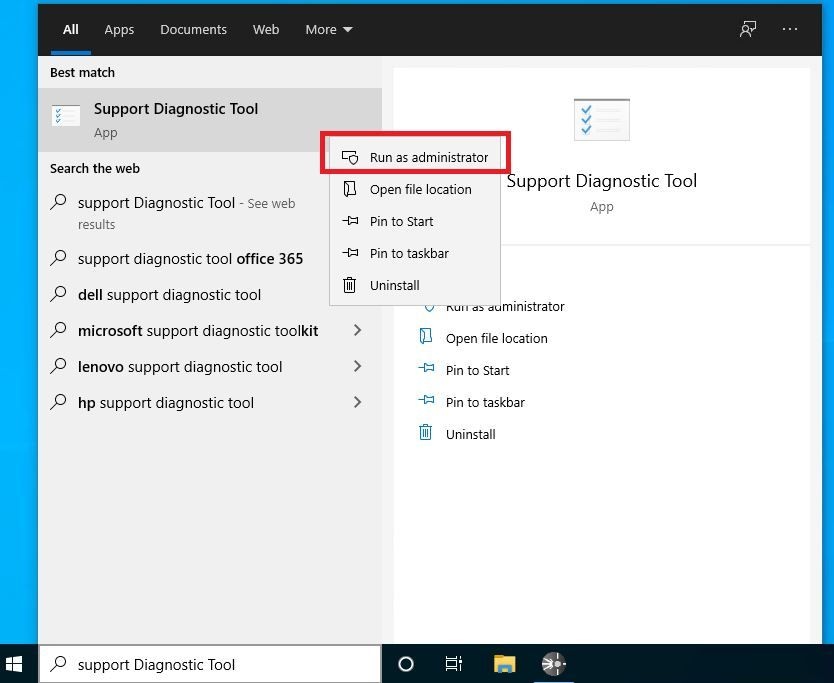
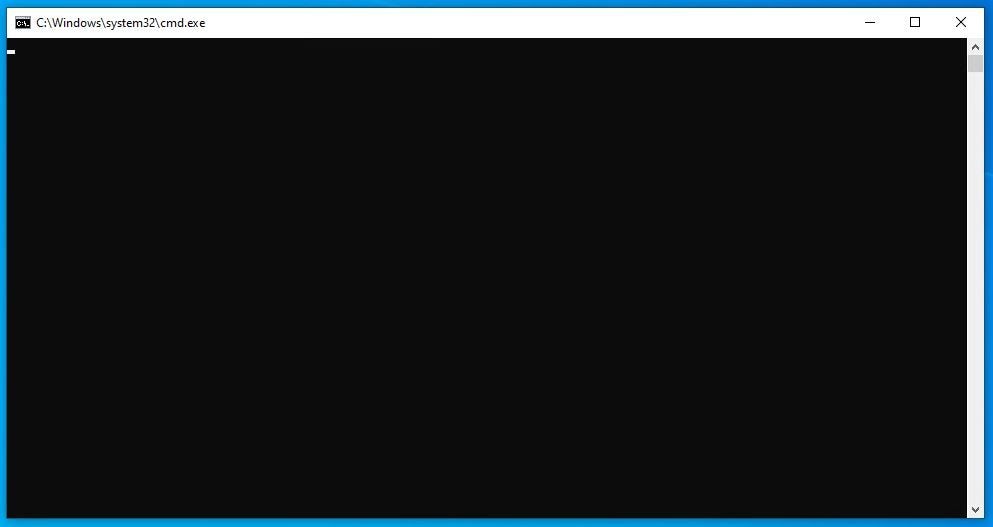
Step 8. A temporary Windows black screen appears, as shown in the image.
Step 9. After a few minutes, the Debug Bundle file appears on the desktop, as shown in the image.
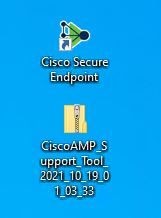
Step 10. Once the Debug Bundle file is generated, Debug mode can be disabled. Select the Disable Debug Logging button, as shown in the image.
Step 11. The button name changes to Enable Debug Logging, as shown in the image.
Step 12. Once the Debug Bundle file is collected, upload it to My Case in Cloud Apps.
Version 8.0.1 and later (Cisco Secure Client)
Step 1. Click the Cisco Secure Endpoint tray icon on the taskbar, as shown in the image.
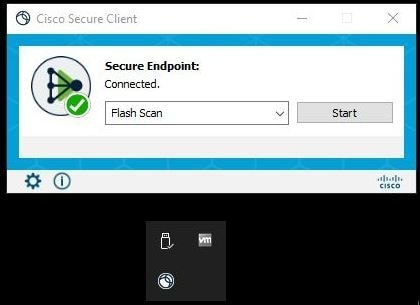
Step 2. Click Advanced Window from the tray icon menu in Secure Endpoint Connector, as shown in the image.
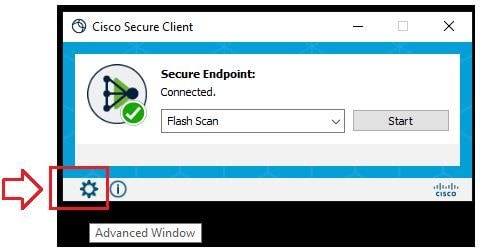
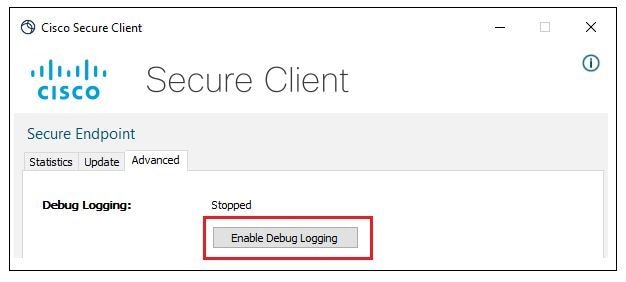
Step 3. Click the Advanced tab, and then click Enable Debug Logging, as shown in the image.
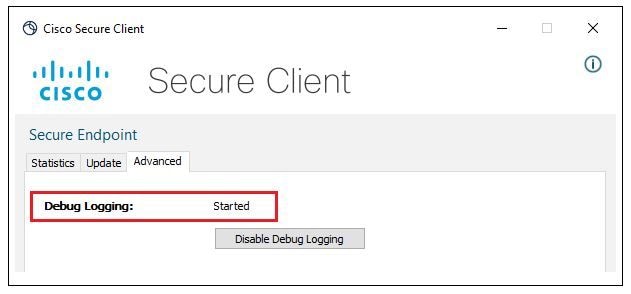
Step 4. The debug logging button name changes to Started. Debug mode is now enabled, as shown in the image.
Step 5. Recreate the issue and let the device run for at least 30 minutes.
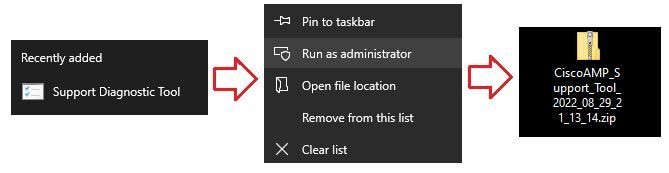
Step 6. Open Windows Search and enter Support Diagnostic Tool.
Step 7. Click Support Diagnostic Tool, and then run it with Administrator privileges.
Step 8. After a few minutes, confirm that the Debug Bundle file appears on the desktop, as shown in the image.
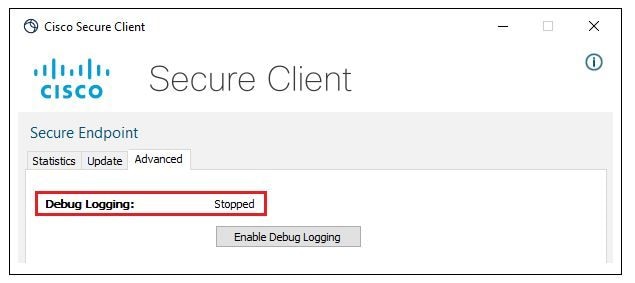
Step 9. Once the Debug Bundle file is generated, Debug mode can be disabled. Click Disable Debug Logging.
Step 10. Once the Debug Bundle file is collected, upload it to My Case in Cloud Apps.
Related Content
- Cisco Secure Endpoint Connector Release Notes
- Cisco Secure Endpoint Documentation
- My Case in Cloud Apps (upload files to a TAC service request)
Revision History
| Revision | Publish Date | Comments |
|---|---|---|
6.0 |
22-May-2024
|
Updated Link of Support Case Manager, ATS team noticed the link was not working. |
5.0 |
12-Apr-2024
|
Updated SEO, Alt Text and Formatting. |
4.0 |
31-Aug-2022
|
Updating connector version requirements. |
2.0 |
12-Nov-2021
|
Adding new branding |
1.0 |
23-Sep-2020
|
Initial Release |

 Feedback
Contact Cisco
- Open a Support Case

- (Requires a Cisco Service Contract)