Analyze macOS Secure Endpoint Diagnostic Bundle for High CPU
Available Languages
Contents
Introduction
This document describes the steps to analyze a diagnostic bundle from Secure Endpoint Public Cloud on macOS devices to troubleshoot high CPU usage.
Prerequisites
Requirements
Cisco recommends that you have knowledge of these topics:
- Basic navigation in the Secure Endpoint Console
- Navigation of the macOS terminal
Components Used
The information in this document is based on these software and hardware versions:
- Secure Endpoint Console v5.4.20260915
- macOS: 27.0
- Secure Endpoint Connector 1.27
The information in this document was created from the devices in a specific lab environment. All of the devices used in this document started with a cleared (default) configuration. If your network is live, ensure that you understand the potential impact of any command.
Background Information
The Secure Endpoint Connector scans all active files (those which move, copy and/or modify themselves) on a machine unless explicitly told not to, that inevitably brings performances issues if too many processes and operations run while the Connector is running, which leads to high CPU utilization, slowdowns or crashes. In addition, the Secure Endpoint Connector can block files based on their cloud reputation, which can some times be erroneous (false positive). The solution to both issues is to exclude these paths and processes.
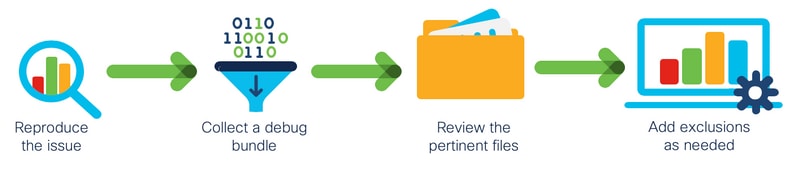
The flow of troubleshooting performance issues is shown in the image.
Troubleshoot
This section provides the information you can use to troubleshoot your configuration.
Verify if another antivirus is installed on the machine
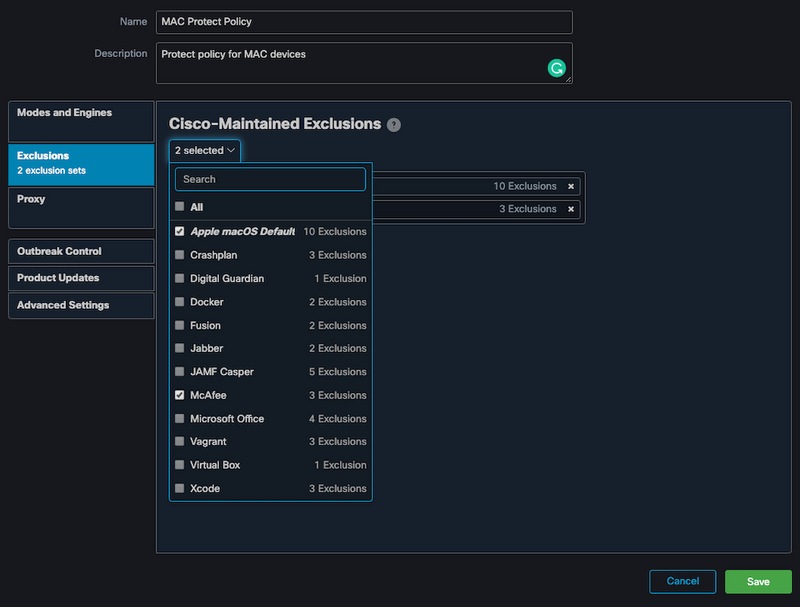
In order to see the lists available in Cisco maintained exclusions section on the Secure Endpoint console:
- Navigate to Management > Policies.
- Find the policy and click on Edit.
- On the policy, settings window click on Exclusions.
Select the ones your endpoint would need according to the software currently installed on the machine, then, save the policy, as shown in the image.
Identify the high CPU when a specific application is in use
Identify if the issue happens while one application or a few of them are executed if you are able to replicate the issue helps in the process to identify potential exclusions.
Gatter a diagnostic bundle for analysis
In order to gather a useful diagnostic bundle, the debug log level must be enabled.
Debug Level in the Endpoint
If you can replicate the issue and have access to the endpoint, this is the best procedure to capture the diagnostic bundle.
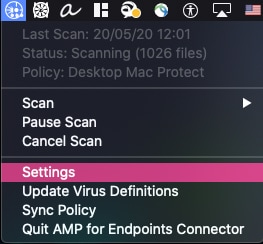
- On the macOS menu bar, select the Secure Endpoint icon.
- Select Settings:
- Select About.
- To enable debug mode, click inside the Secure Endpoint logo:
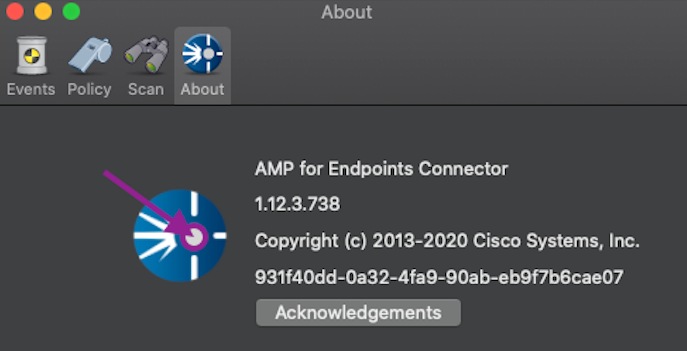
A notification indicates the Secure Endpoint Connector is on Debug Mode.
This procedure enables debug log level until the next policy heartbeat interval.
Debug Level in the Secure Endpoint Command Line Interface (CLI)
- Open a Terminal
- Run ampcli
/opt/cisco/amp/ampcli
- On the Secure Endpoint CLI enable debug mode
ampcli>debuglevel 1
This process enables debug log level until the next policy heartbeat interval.
Debug Level in the Policy
If you don´t have access to the endpoint or the issue can´t be reproduced consistently, the debug log level must be enabled in the policy.
To enable the debug log level by the policy:
- Select Management > Policies.
- Find the policy and click on Edit.
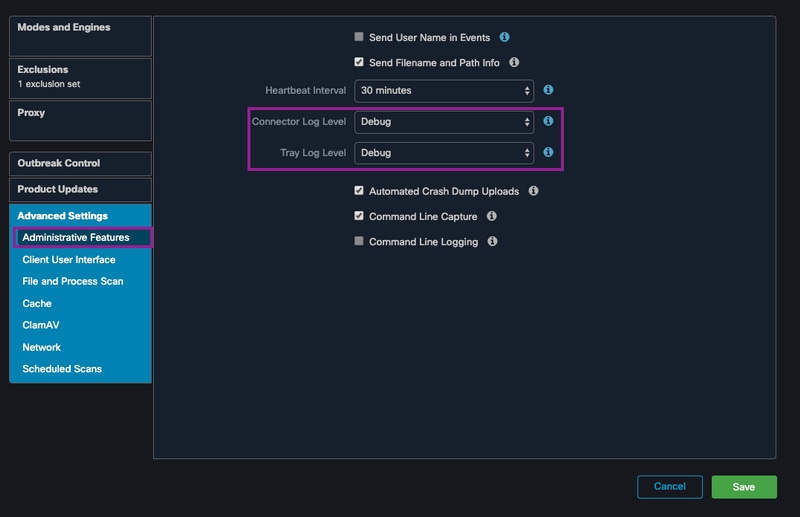
- Select Advanced Settings > Administrative Features.
- Configure Connector Log Level and Tray Log Level to Debug and save the policy, as shown in the image
Exclude Secure Endpoint from other antivirus solutions
According to the user guide, antivirus products must exclude the next directories and any files, directories, and executable files within them to be compatible with the Secure Endpoint Connector for macOS. The directories to exclude are:
- /Applications/Cisco Secure Endpoint/Secure Endpoint Service.app
Reproduce the issue and gather a diagnostic bundle
When the debug level is configured, wait until the state of high CPU happens on the system or manually reproduce the conditions previously identified and then gather the diagnostic bundle.
To collect the debug bundle:
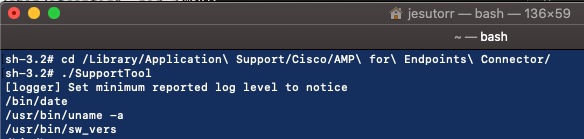
- Open a terminal
- Use the command
sudo /Applications/Cisco\ Secure\ Endpoint/Secure\ Endpoint\ Service.app/Contents/MacOS/SupportTool
The debug bundle is saved in the ~/Desktop folder as a .zip file extension.
Analysis of high CPU performance
The debug diagnostic bundle is storage in the Desktop, to start the analysis:
- Decompress the Diagnostic Bundle
- There are 2 files to review
- File Executions: execs.txt
- File Operations: fileops.txt
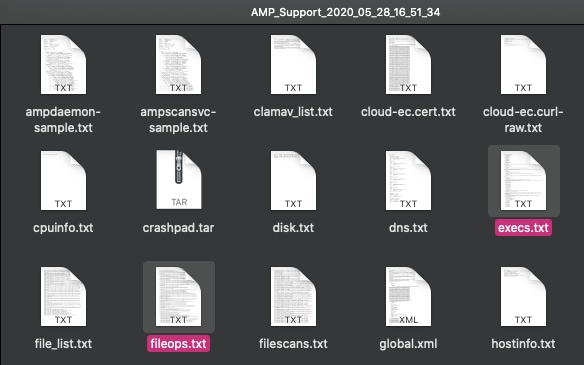
- The fileops.txt works as the main performance tool to troubleshoot. It lists al current all currently active operations on your endpoint while the Connector runs, it is read as:
<Number scans performed on the path when the bundle is collected> / <Path scanned>
For example, If you have a homebrew application, fileops.txt shows the next active operations:
639 /Users/user/Library/Bin/MyApplication/support/
460 /Users/user/Library/Bin/MyApplication/logs/
219 /Users/user/Library/Bin/MyApplication/Collection/Node/Server/ - Once the process is identified, create an exclusion: select Management > Exclusions.
- Select the exclusion set and then Edit.
- Add the exclusion:

- The Execs.txt file contains all commands used by processes that run while the Connector collects bundles. The paths listed here must not be excluded on the Secure Endpoint policy, as these are binaries (/bin) and system binaries(/sbin) that all processes utilize, however, on the Execs.text can provide the main process that is running.
For example, if the Execs.txt file shows the next logs.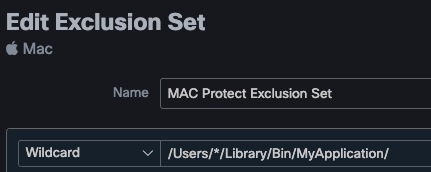
Since the homebrew application uses bash you can confirm that the application is the cause of the high CPU.
Related Information
Revision History
| Revision | Publish Date | Comments |
|---|---|---|
2.0 |
29-Sep-2026
|
Refreshed for macOS Golden Gate |
1.0 |
01-Jun-2020
|
Initial Release |

 Feedback
Contact Cisco
- Open a Support Case

- (Requires a Cisco Service Contract)