How to monitor your critical applications processes using the Splunk OTel Collector
Available Languages
Applicability
Splunk Infrastructure MonitoringDescription
Monitoring critical application processes using the Splunk OTel Collector requires the use of the hostmetrics receiver. An example of how to add an applications process is demonstrated in this article on an Ubuntu 24.04.2 LTS virtual machine.
Resolution
Here's an example of how tomonitor the Apache2 and Tomcat processes on an Ubuntu 24.04.2 LTS virtual machine:
1) Edit the Splunk OTel Collector configuration (E.g. /etc/otel/collector/agent_config.yaml). Inside that file, it's necessary to enable receivers::hostmetrics::scrapers::process.
Following that, the names of the desired processes can be included for monitoring by using match_type: regexp.
2) To check the process name. Do a process listing.
$ ps aux |grep -i 'COMMAND\|tomcat\|apache2' |grep -v 'ssh\|grep'
USER         PID %CPU %MEM    VSZ   RSS TTY      STAT START   TIME COMMAND
tomcat     16613  0.3 11.2 2804284 105136 ?      Ssl  00:52   0:14 /usr/lib/jvm/default-java/bin/java -Djava.util.logging.config.file=/var/lib/tomcat10/conf/logging.properties -Djava.util.logging.manager=org.apache.juli.ClassLoaderLogManager -Djava.awt.headless=true -Djdk.tls.ephemeralDHKeySize=2048 -Djava.protocol.handler.pkgs=org.apache.catalina.webresources -Dorg.apache.catalina.security.SecurityListener.UMASK=0027 --add-opens=java.base/java.lang=ALL-UNNAMED --add-opens=java.base/java.io=ALL-UNNAMED --add-opens=java.base/java.util=ALL-UNNAMED --add-opens=java.base/java.util.concurrent=ALL-UNNAMED --add-opens=java.rmi/sun.rmi.transport=ALL-UNNAMED -classpath /usr/share/tomcat10/bin/bootstrap.jar:/usr/share/tomcat10/bin/tomcat-juli.jar -Dcatalina.base=/var/lib/tomcat10 -Dcatalina.home=/usr/share/tomcat10 -Djava.io.tmpdir=/tmp org.apache.catalina.startup.Bootstrap start
root       19007  0.0  0.5   6880  4964 ?        Ss   01:54   0:00 /usr/sbin/apache2 -k start
www-data   19009  0.0  0.8 1213208 8312 ?        Sl   01:54   0:00 /usr/sbin/apache2 -k start
www-data   19010  0.0  0.9 1213208 9336 ?        Sl   01:54   0:00 /usr/sbin/apache2 -k start
www-data   19122  0.0  0.1   3620  1544 ?        Ss   01:54   0:00 /usr/bin/htcacheclean -d 120 -p /var/cache/apache2/mod_cache_disk -l 300M -n
For instance, if Tomcat has a process ID (PID) 16613, one can check /proc/<PID>/comm to confirm the process name, which in this case would appear as java.
$ cat /proc/16613/comm
java
3) Next, the names of the identified processes should be added to the receivers::hostmetrics::scrapers::process::include::names section, ensuring that match_type: regexp is also specified.
Example configuration below:
receivers:
  ...
  hostmetrics:
    collection_interval: 10s
    scrapers:
      cpu:
      disk:
      filesystem:
      memory:
      network:
      load:
      paging:
      processes:
      process:
         include:
           names: ["^java$", "^apache2$"]
           match_type: regexp
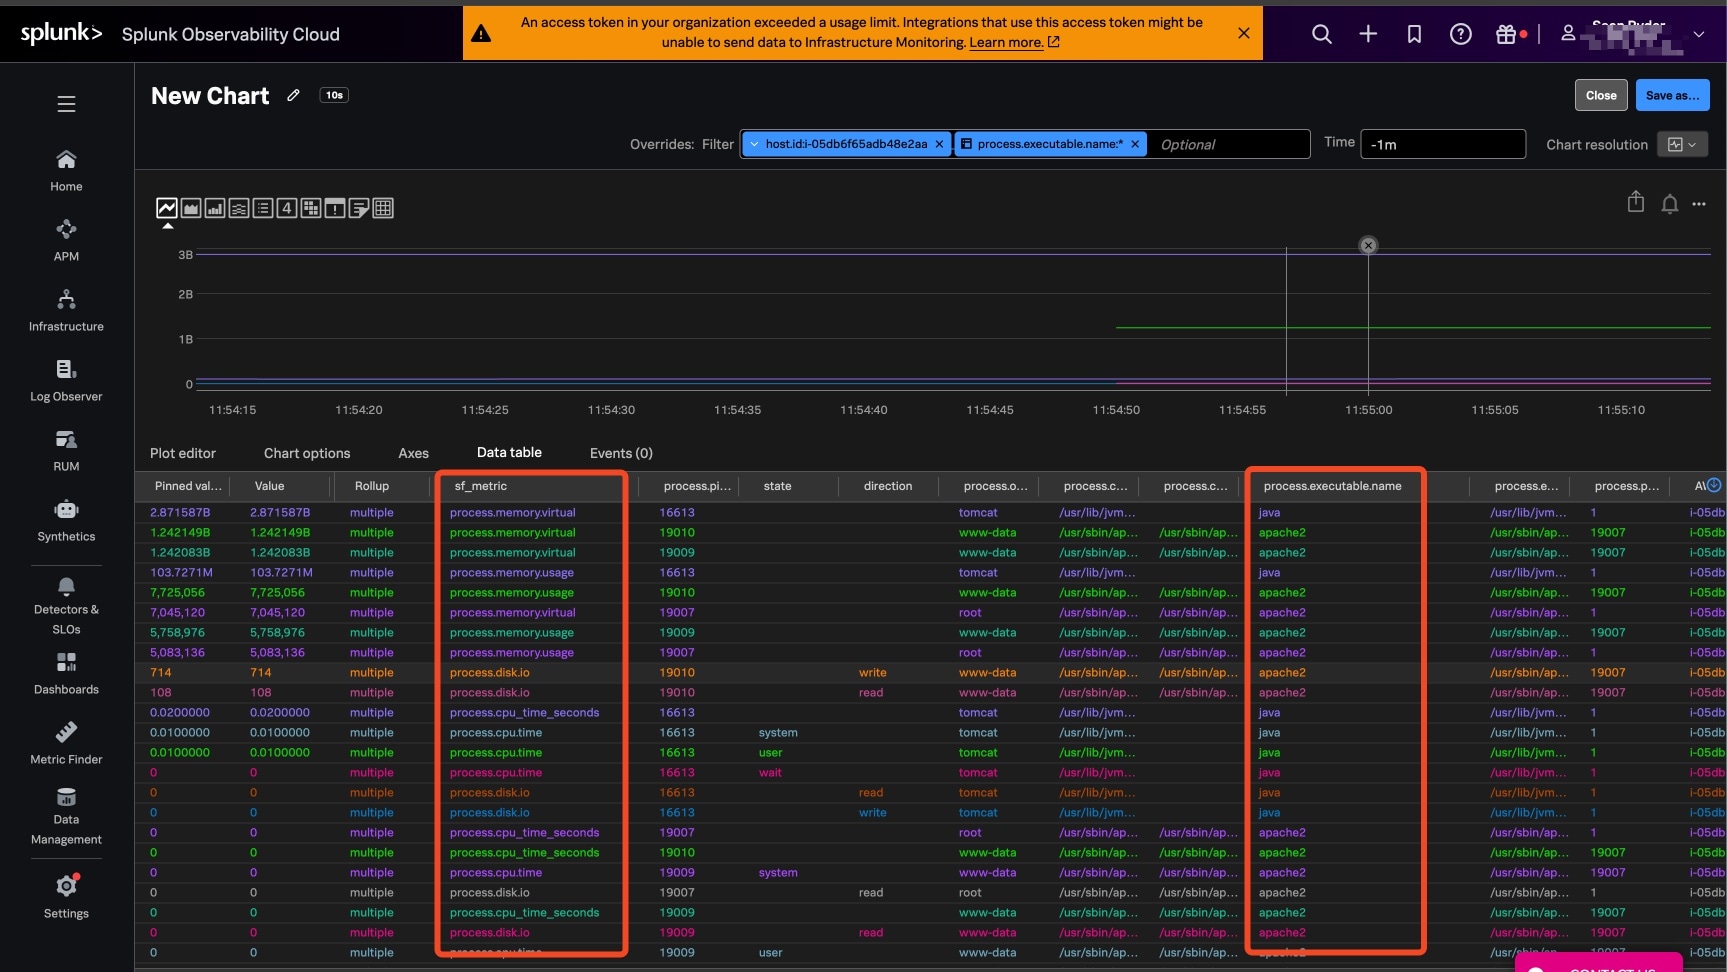
4) To view the collected data in Splunk Observability Cloud, create a new chart. A helpful approach is to use * for the metric, then filter by the dimensions host.id:<your host id> and process.executable.name:*.
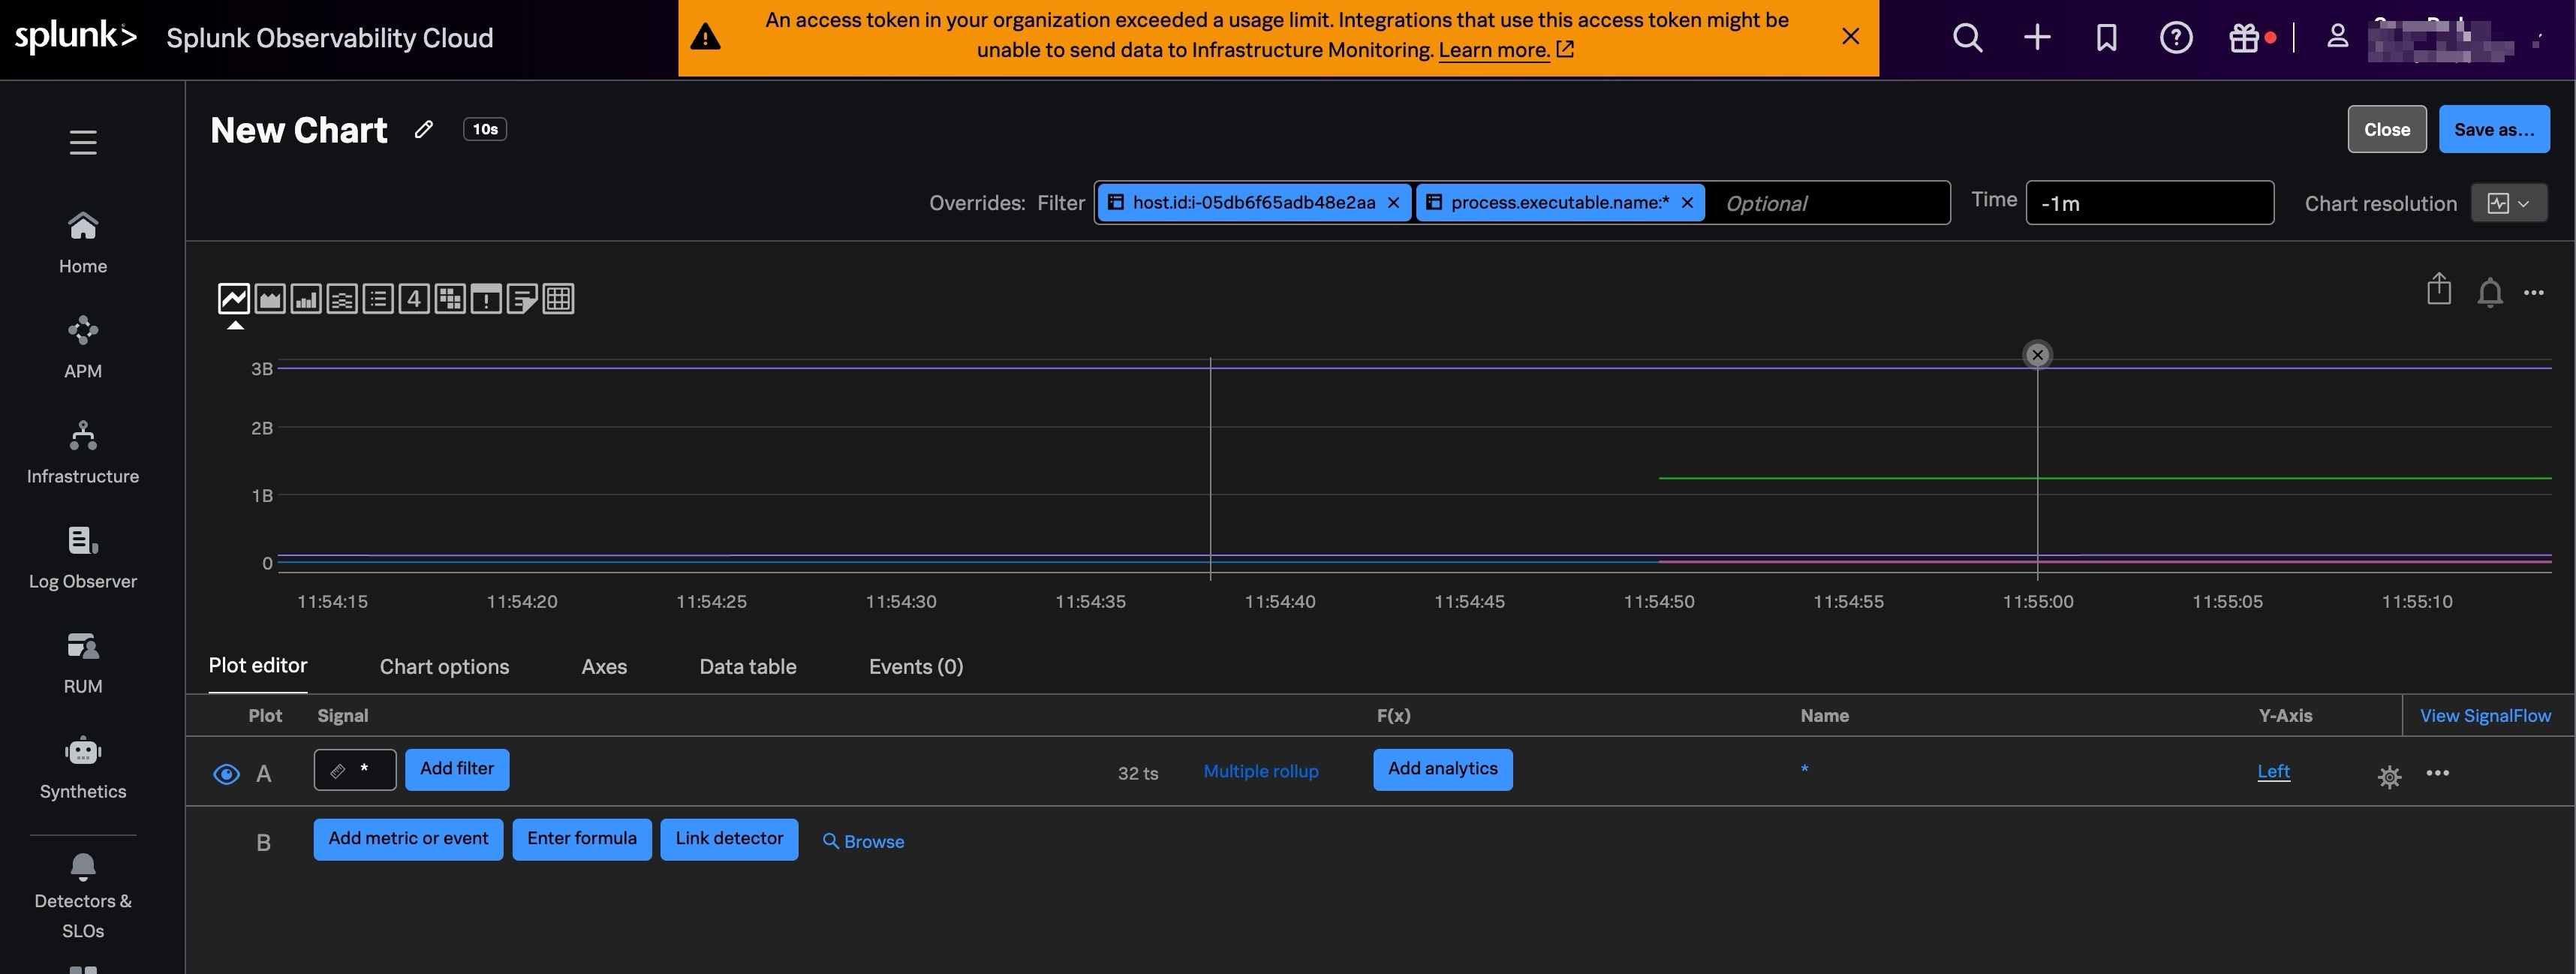
Once a data point on the chart is selected, the metrics used to monitor the process should become visible in the chart table below, as illustrated in the accompanying screenshot.
Revision History
| Revision | Publish Date | Comments |
|---|---|---|
1.0 |
01-Oct-2026
|
Initial Release |
 Feedback
Contact Cisco
- Open a Support Case

- (Requires a Cisco Service Contract)
Related Articles
- How to monitor TCP ports using the Splunk OTel Collector
- How to Monitor Dockerized Applications with Splunk OTel Collector on Standalone EC2 and ECS Fargate
- How to monitoring Windows Services with Splunk OTEL Collector (Windows)
- Splunk OTEL Collector for Kubernetes - Required Information to troubleshoot