How CPU iowait affects indexing performance
Available Languages
Applicability
Splunk EnterpriseDescription
In the ideal world, data goes through the Splunk indexer's pipeline without delay and gets persisted in the file system immediately. In real life, however, hardware capability varies and so is the load.This knowledge article focuses on how CPU iowait affects indexing performance. As per sar manpage, CPU iowait or %iowait is the percentage of time that the CPU or CPUs were idle during which the system had an outstanding disk I/O request.
Investigation
We can obtain similar measurement from Splunk by querying the metrics log:
index=_internal group=pipeline name=indexerpipe processor=indexer | timechart sum(write_cpu_seconds)
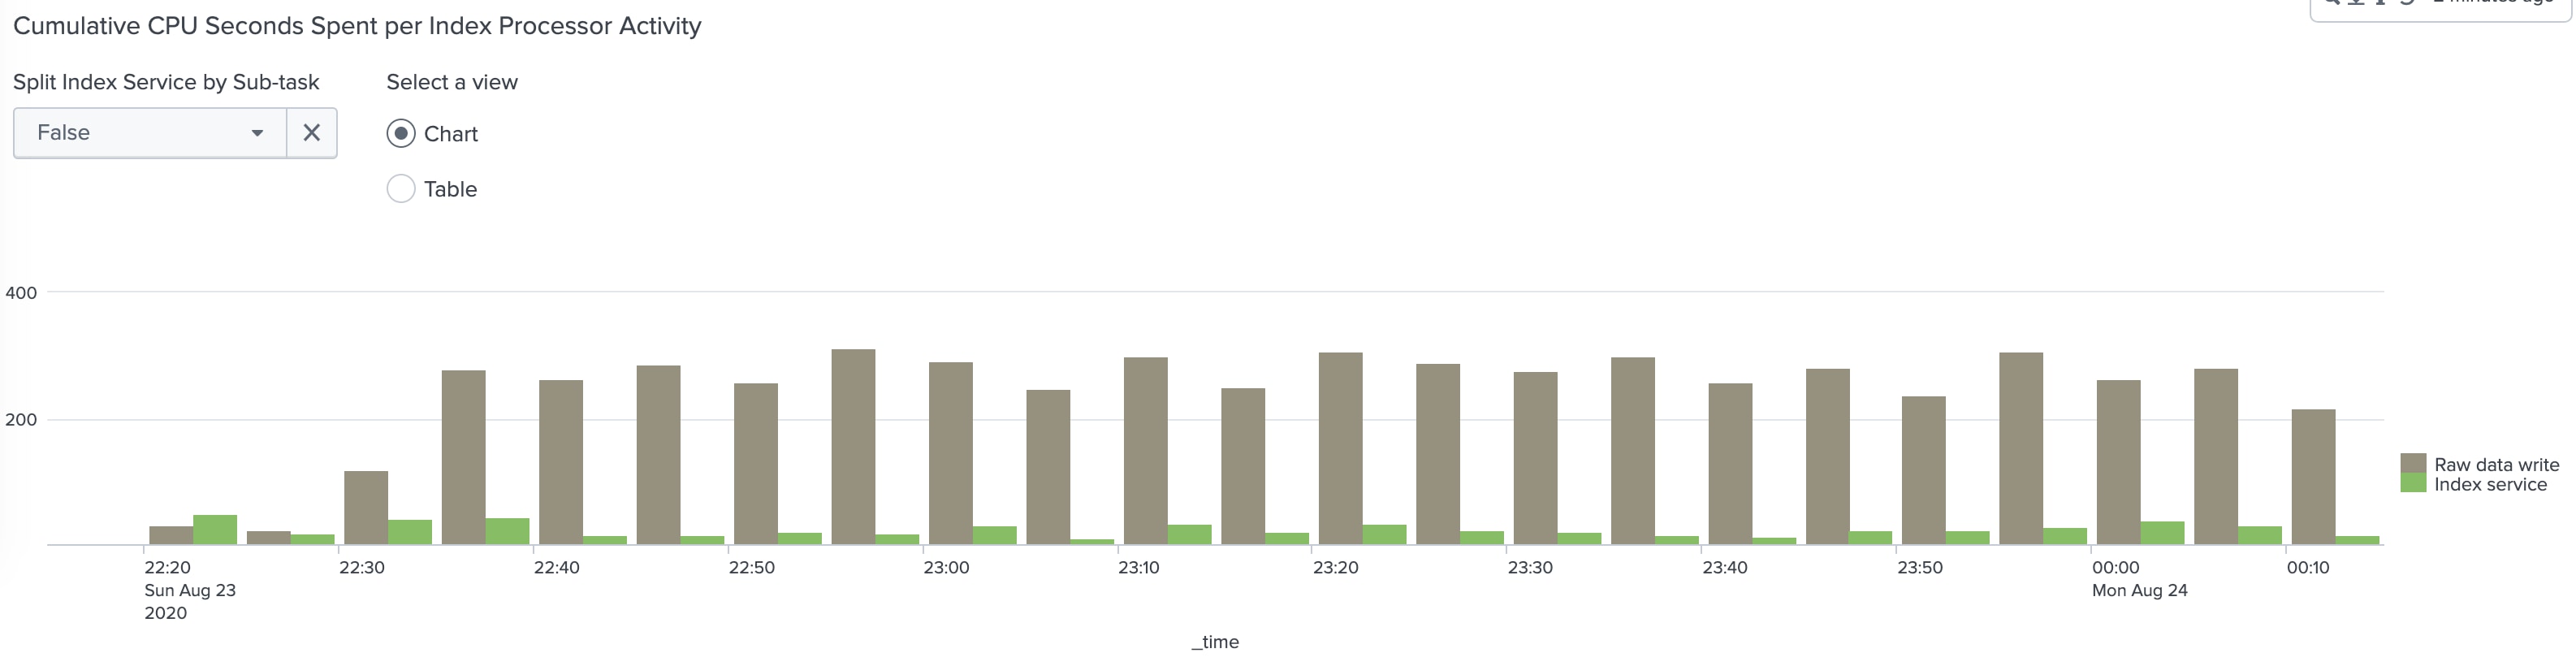
Continuously high write_cpu_seconds statistics are an indication of a disk bottleneck.
This typically manifests in the indexing queue being full during peak ingestion period. When the indexing queue is full or blocked, the blockage usually spills to the rest of the queues in the pipeline, such as typing, merging, and parsing.
Example 1: Blocked indexing queue correlates to high write_cpu_seconds.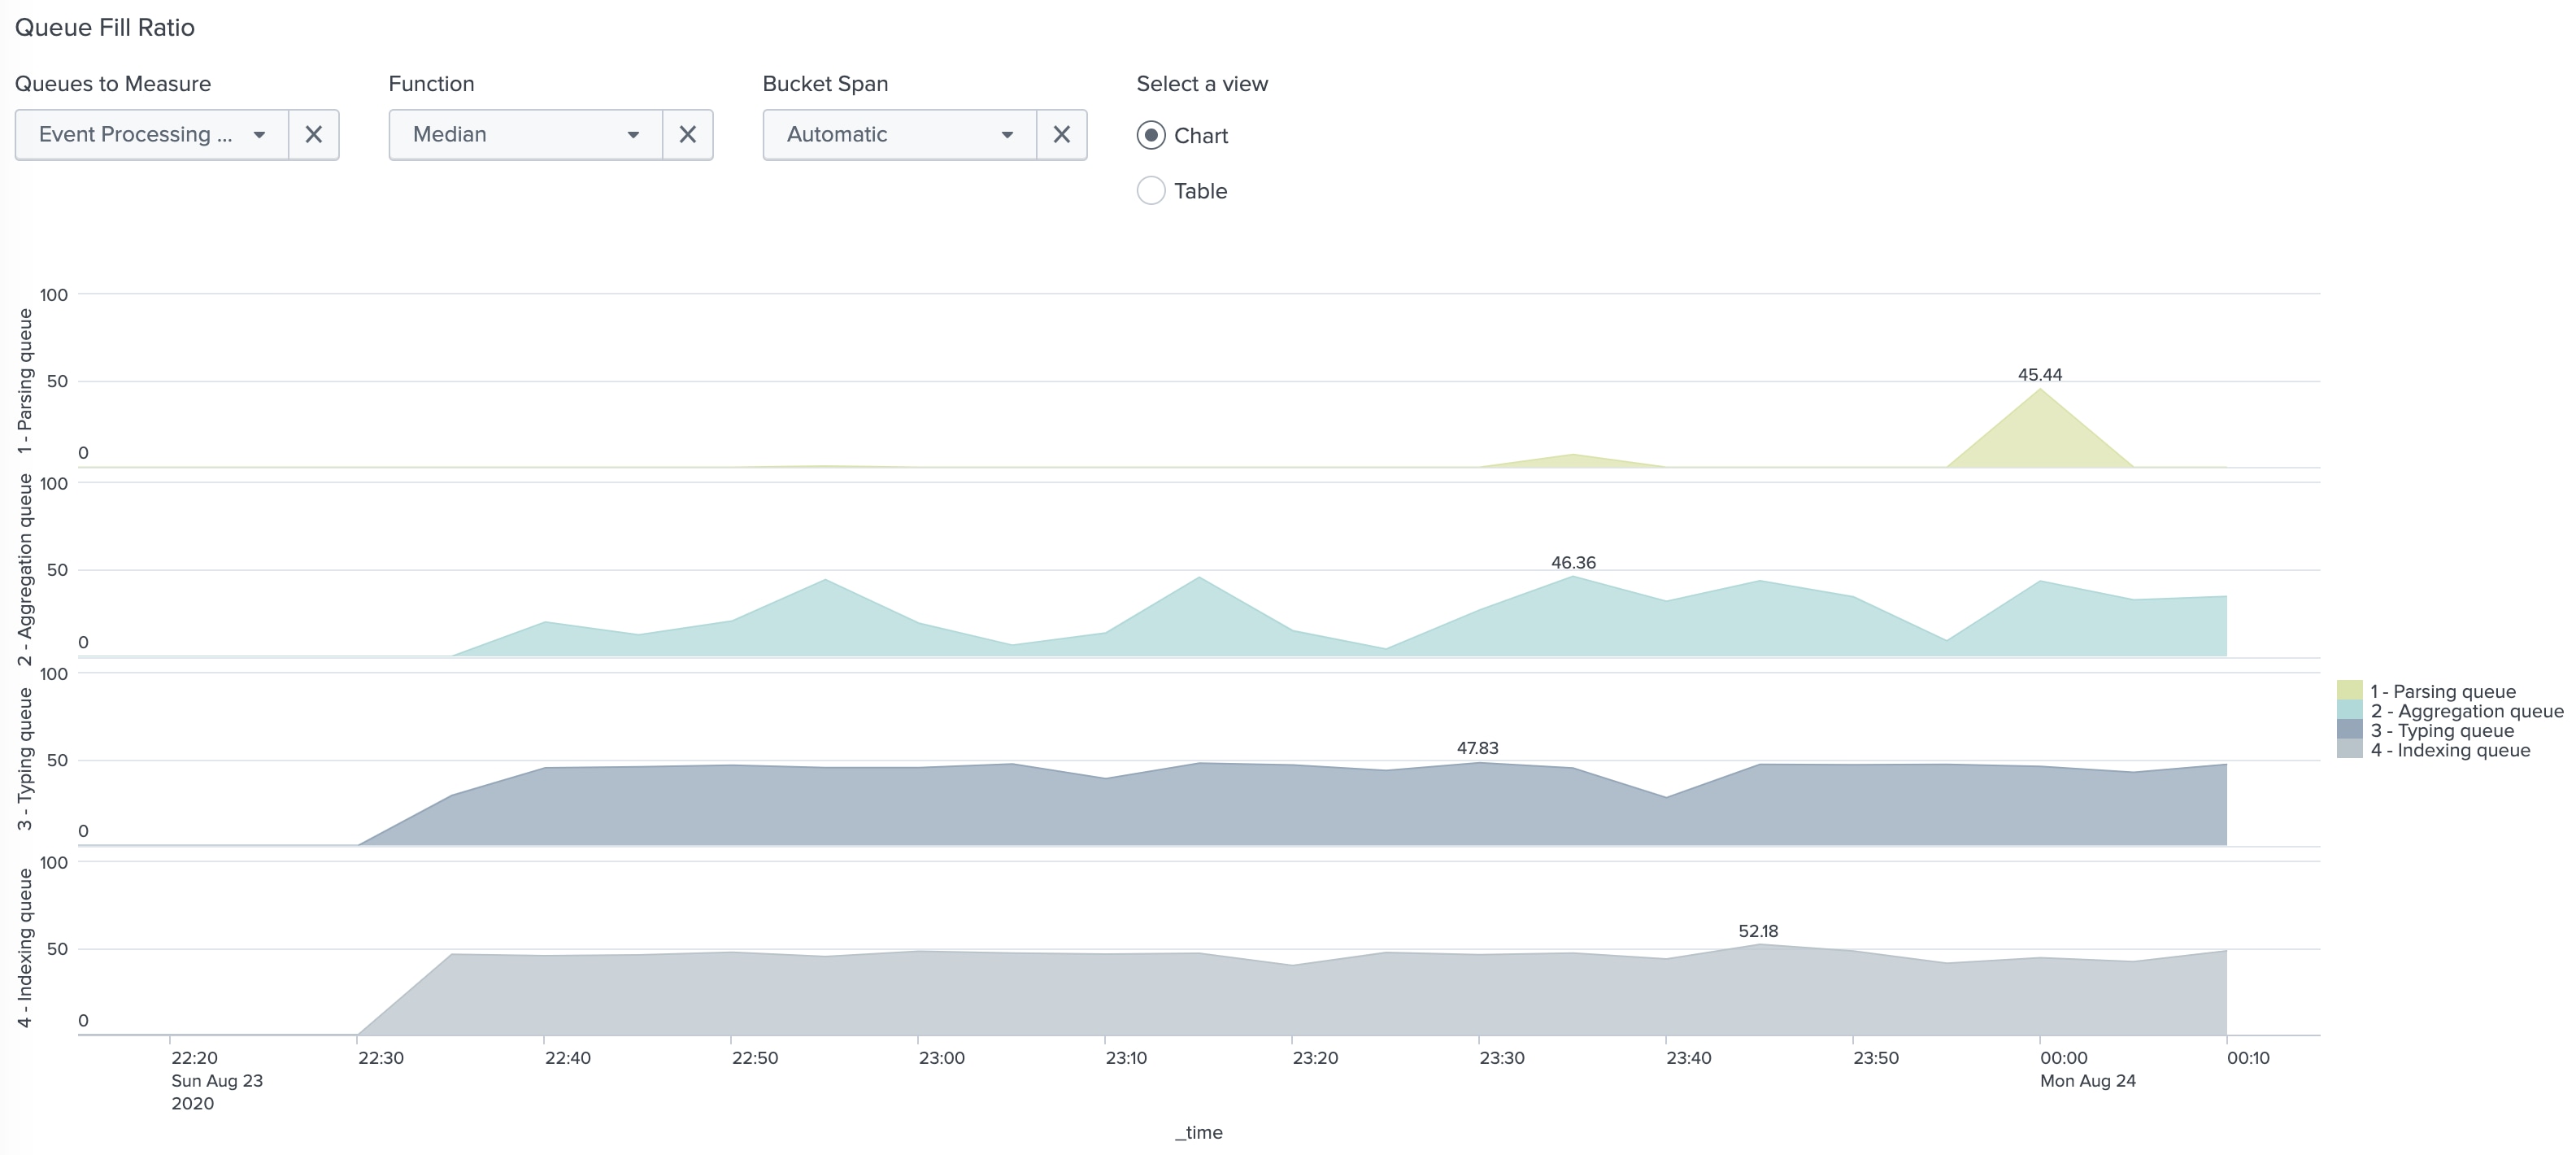
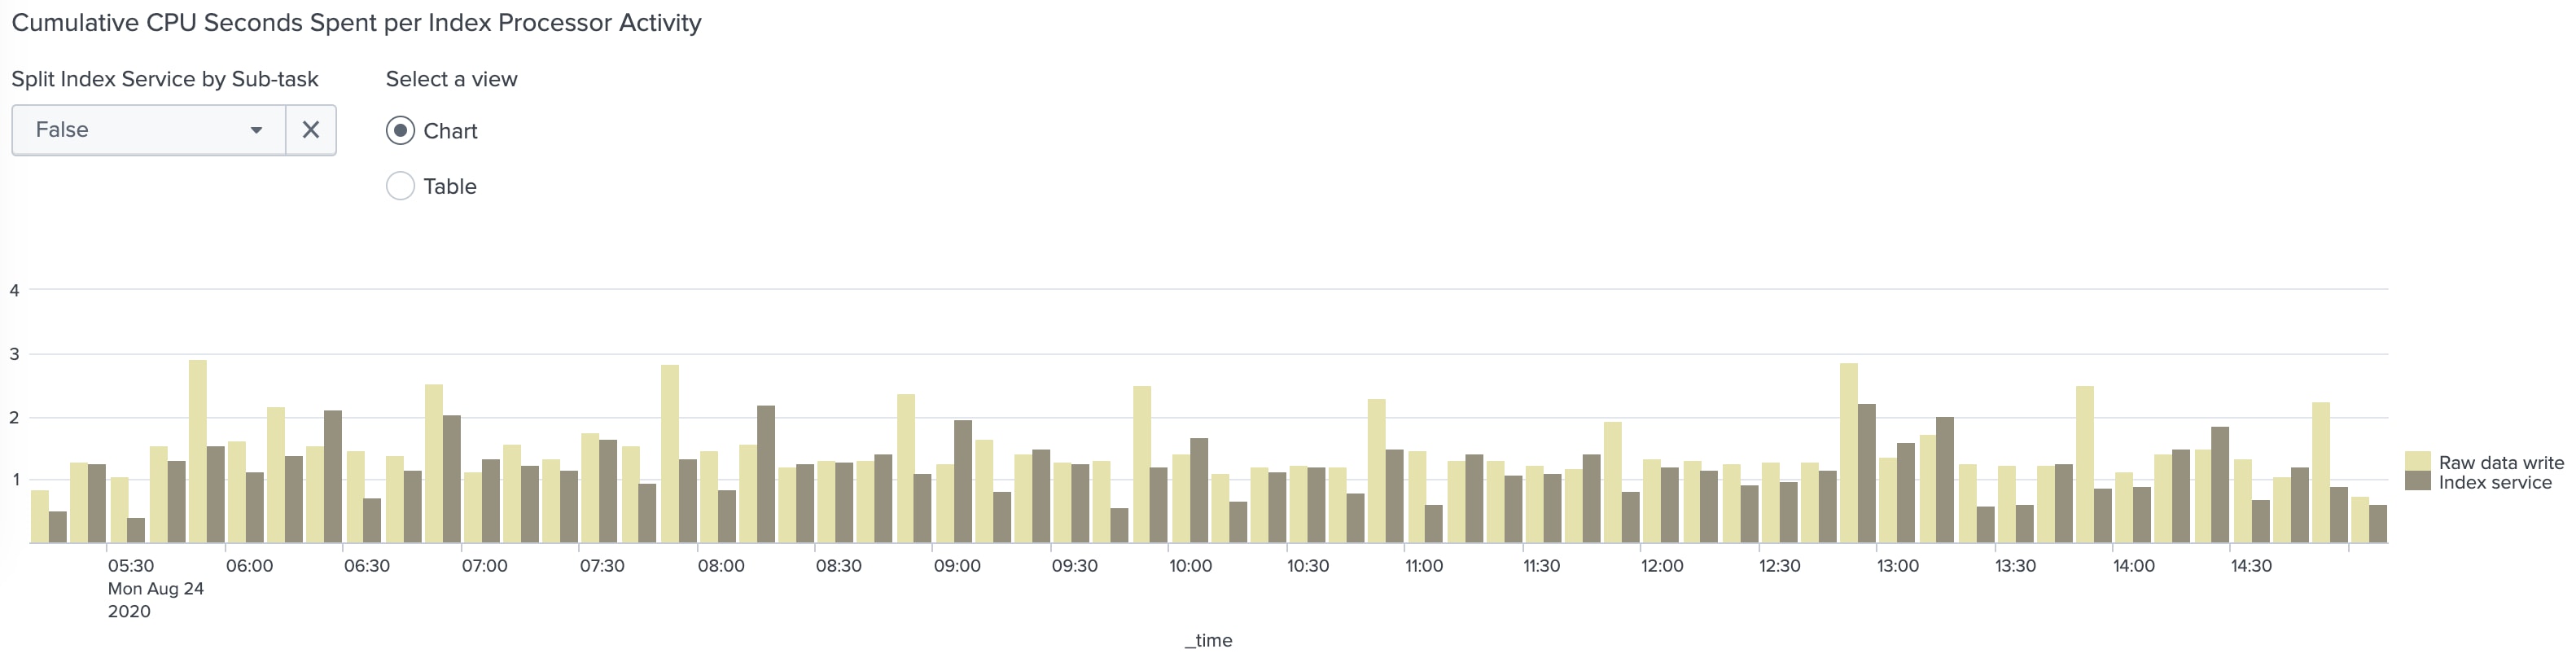
Example 2: Very low ingestion traffic and low write_cpu_seconds.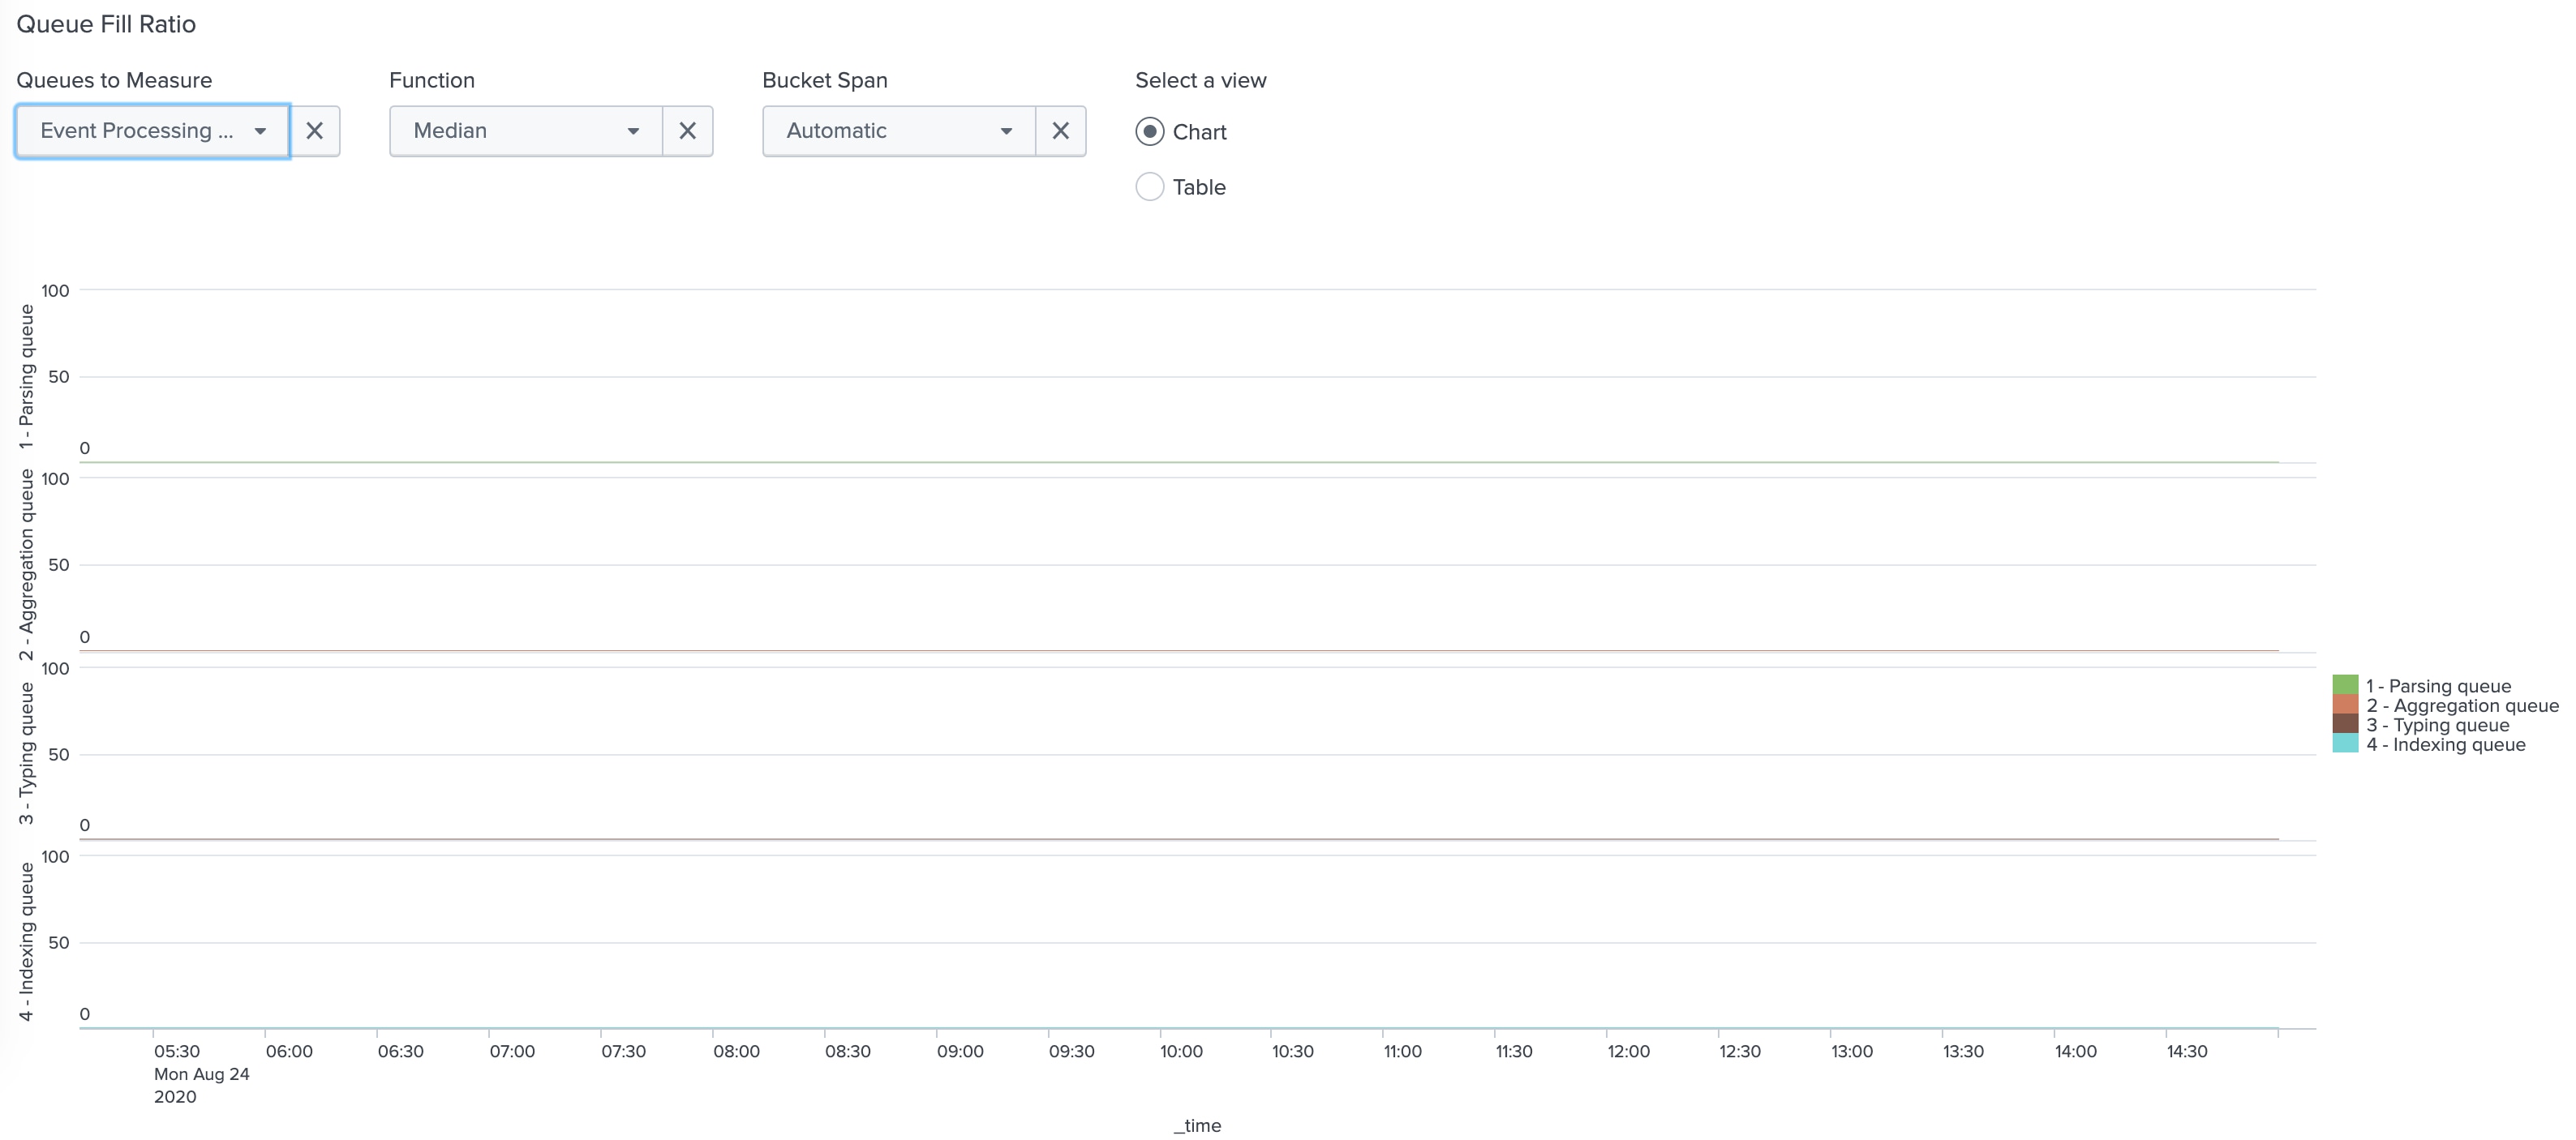
Resolution
1. If Splunk indexes are stored in SSD-based storage: Do not let the disk runs at or near capacity. The performance will degrade significantly due to write amplification. Follow the SSD vendor's best practice when deciding how much free space is needed for maximum performance. This applies to both physical disks and SSD-based cloud storage.
maxVolumeDataSizeMB (a parameter in indexes.conf) can be adjusted to ensure there is always plenty of free space.
2. Move Splunk indexes to faster storage.
3. Reduce ingestion load.
4. Add more indexer(s) to reduce the ingestion load on existing indexers.
Revision History
| Revision | Publish Date | Comments |
|---|---|---|
1.0 |
29-Sep-2026
|
Initial Release |
 Feedback
Contact Cisco
- Open a Support Case

- (Requires a Cisco Service Contract)