Data not expiring after retention period has passed
Available Languages
Applicability
Splunk Cloud Splunk Enterprise DDAA Storage Buckets Cloud Monitoring Console (CMC)Description
Accessing the SH WebUI -> Cloud Monitoring Console License usage -> 'Archive storage (DDAA)' dashboard the Archive storage usage amount was larger (had breached) the Archive storage entitlement value:

As data is moved to the archive when the index meets a configured size or time threshold, we reviewed the Indexes via SH WebUI -> Settings -> Indexes and found the earliest event was older than the searchable retention configured.
In this scenario the retention period for the index is 180 days and data should have expired after 31st October 2021.
The following search for last 182 days shows data past retention date of 31st October 2021
index=ms_winsecurity
Investigation
The purging of data from a bucket occurs only when all the data within that bucket has surpassed the retention period. If any data within the bucket has not exceeded the retention period, the purging process does not take place.
With a clear understanding of the above and using and index "ms_winsecurity" as an example we can check the buckets using dbinspect.
First step is to identify the bucket ID's with the following search:
index=ms_winsecurity | eval bktId=_bktIf you review the INTERESTING FIELDS, you will see the field called bktId and you can see all the buckets used in the above search
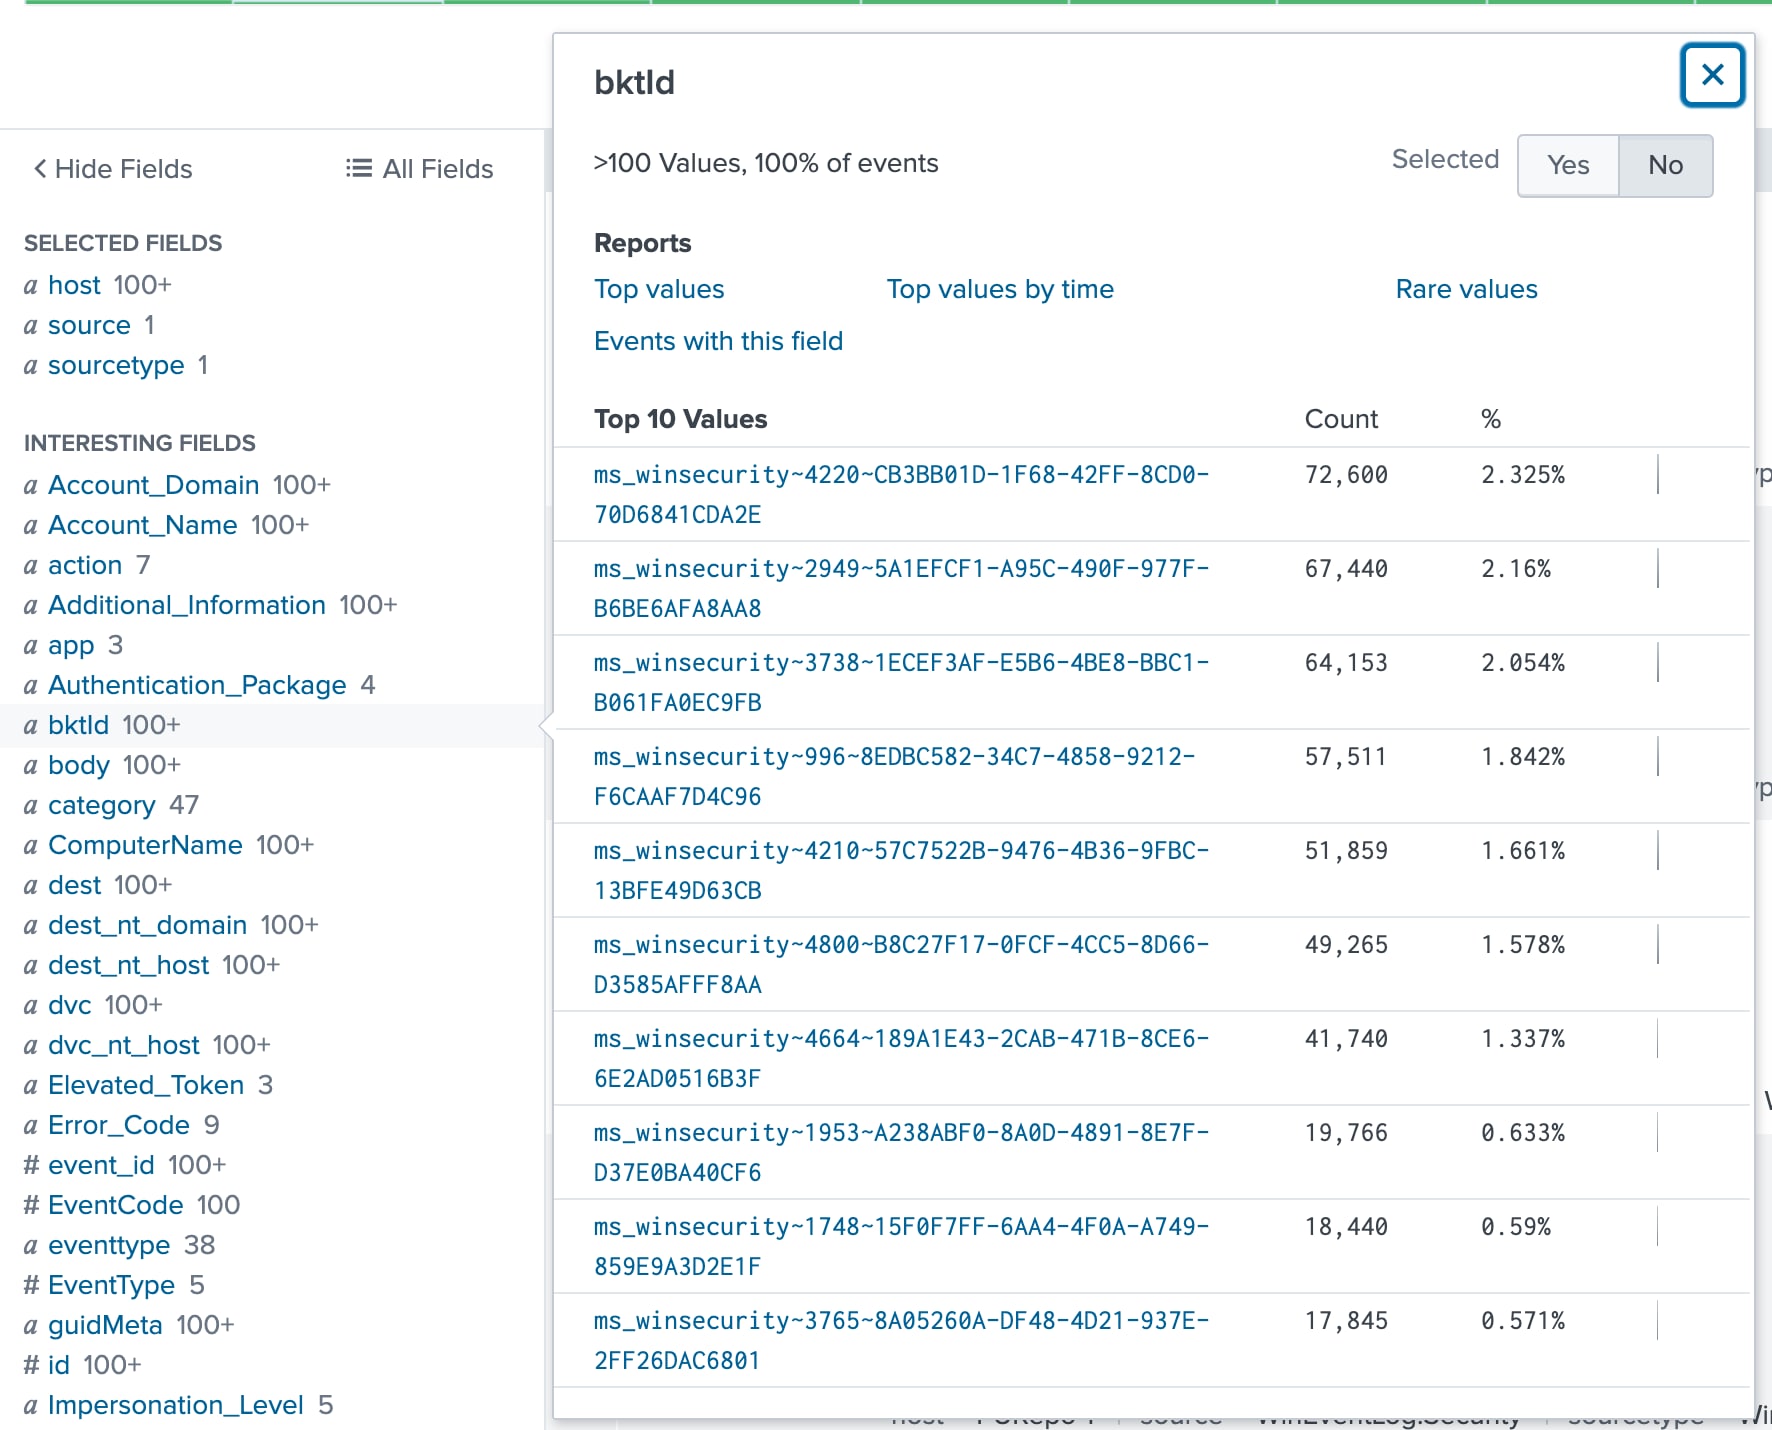
Now that we know the bucketID we can check what the EndEpoch time is of the latest event.
Using dbinspect and the bucketId, in this scenario: "ms_winsecurity~4220~CB3BB01D-1F68-42FF-8CD0-70D6841CDA2E" with the following search, we can confirm what the endEpoch time is of the last/latest event.
|dbinspect index=ms_winsecurity | search bucketId=ms_winsecurity~4220~CB3BB01D-1F68-42FF-8CD0-70D6841CDA2E | convert ctime(startEpoch) | convert ctime(endEpoch) | table bucketId endEpoch startEpoch
Note: The above search displays the latest event in the bucket, enabling us to confirm whether the event has not yet surpassed the retention time and, therefore the reason why the data remains in the index.
Resolution
In this scenario, from the output, the latest event in bucket is 11th November 2021:

What this means is there is still data within the retention period of 180 days, which is why the search still returns result past 180 days.
Regarding the CMC DDAA dashboard, the CMC 'Archive storage (DDAA)' dashboard does not provide real-time data, so recent data transfers to DDAA will not immediately reflect in the dashboard. If data has been purged for license purposes, please allow up to 24-48 hours for the Dashboard to display new value.
Additional Information:
Incorrect timestamps may also cause issues.
- Events contain two field values: _time & _indextime.
- _time represents the moment the event was created, while _indextime indicates when the event was indexed into Splunk.
- The difference between these two values should be within seconds, reflecting seamless data forwarding to Splunk.
- If the time difference between _time and _indextime extends to a span of several hours, days, months, or even years, this suggests an issue with timestamps.
- The below search will display both values in human readable format:
index="INDEX_NAME" source="SOURCE_NAME" sourcetype="SOURCETYPE_NAME" | eval indexed_time=strftime(_indextime,"%+") | eval latency=(_indextime-_time) | eval human=tostring(latency,"duration") | table _raw _time indexed_time latency human
Revision History
| Revision | Publish Date | Comments |
|---|---|---|
1.0 |
29-Sep-2026
|
Initial Release |
 Feedback
Contact Cisco
- Open a Support Case

- (Requires a Cisco Service Contract)