BPA User Guide Distributed Tracing Framework v5.1
Available Languages
- Introduction
- Key Components
- Prerequisites
- Docker Composes Deployment
- Enabling Tracing in Services
- Kubernetes and Helm deployment
- Access and Monitoring
- Tracers and Spans
Introduction
Zipkin
Zipkin is a distributed tracing system that helps gather timing data needed to troubleshoot latency problems in service architecture. This guide provides instructions for deploying Zipkin and enabling tracing across BPA platform services.
@opentelemetry/api
The @opentelemetry/api package is the core API for OpenTelemetry in Node.js. It provides interfaces and classes for creating and managing traces, spans, and context propagation. This package allows Developers to instrument their applications to collect telemetry data such as traces and metrics, which can then be exported to backends like Zipkin for analysis.
Key Components
Key components of Zipkin includes:
- Zipkin Server: Central tracing collector and User Interface (UI)
- OpenTelemetry: Instrumentation library for tracing
- Elasticsearch: Storage backend for trace data
- Secure Sockets Layer (SSL) and Transport Layer Security (TLS): Provides secure communication
Prerequisites
Network Requirements
To deploy Zipkin and enable tracing, the following network requirements are required:
- Port 9412: Zipkin Hypertext Transfer Protocol Secure (HTTPS) API endpoint
- Port 9411: Zipkin Hypertext Transfer Protocol (HTTP) management endpoint
- Port 9200: Access to Elasticsearch cluster
Docker Composes Deployment
Enabling Monitoring Profile
- Start the BPA 1-node docker from the following path:
cd /opt/bpa/bpa-{build_version}/scripts - Run the bash script with the monitoring option using the
following command:
./startbpa.1node.sh monitoring
Verifying Zipkin Container
- To check the container status, run the following command:
docker ps | grep tracers-zipkin - To view the logs of a Zipkin container. run the following
command:
docker logs tracers-zipkin -f
Enabling Tracing in Services
The BPA application supports flexible tracing configuration through “tracingConfig.json” files. The system implements a hierarchical configuration loading mechanism with three (3) levels of precedence to accommodate different deployment scenarios.
Configuration Loading Hierarchy
The application loads the tracing configurations in the following order based on precedence:
Pod Specific Configuration
Path: bpa-helm-chart/charts/<service name>/public_conf
Use Case
- Individual, pod-specific tracing configuration
- Allows different tracing settings for specific services or pods
- Manual Placement Required: Users must manually place this file in the pod’s folder path: bpa-helm-chart/charts/<service name>/public_conf
Example Scenario
- Enable detailed tracing for critical services only
- Different sampling rates for different microservices
- Debug-specific tracing for troubleshooting pods
Global Configuration
Path: bpa-helm-chart/bpa/conf/common/globals/tracingConfig.json
Use Case
- Global tracing configuration for all containers and pods
- Centralized tracing management
- Global Impact: Changes to this file affect all pods in the deployment
Example Scenario
- Enable and disable tracing across the entire BPA deployment
- Set uniform tracing policies for the production environment
- Centralized compliance and monitoring requirements
Fallback Configuration
Path: ../conf/tracingConfig.json (fallback)
Use Case
- Default tracing configuration bundled with the application
- Development environment defaults
- Ensures the application never fails due to a missing tracing configuration
If any configuration file is malformed or unreadable, the system:
- Logs the error
- Defaults to {enable: false} to prevent tracing failures
- Continues application startup
Setting Tracing Configuration
Create or update the “tracingConfig.json” file with the following content in the pod’s folder path:
bpa-helm-chart/charts/<service name>/public_conf/
Examples:
- To enable tracing
{ "enable": true } - To disable tracing:
{

      "enable": false

    }
Configuration Properties
- enable (boolean)(required): Controls whether tracing is enabled or disabled for the application
- true: Enables distributed tracing
- Application initializes the tracing helper
- Traces are collected and sent to the configured backend
- Performance monitoring and debugging capabilities activated
- false: Disables distributed tracing
- No tracing overhead on application performance
- No trace data collection or transmission
- Application runs without tracing instrumentation
Applying Configuration Changes
Helm Upgrade Command
After placing the “tracingConfig.json” files in the appropriate locations, apply the changes using the Helm upgrade command:
helm upgrade bpa-rel --namespace bpa-ns /opt/bpa-helm-chartCommand Breakdown:
- helm upgrade: Updates an existing Helm release
- bpa-rel: Name of the BPA Helm release
- --namespace bpa-ns: Specifies the Kubernetes namespace where BPA is deployed
- /opt/bpa-helm-chart: Path to the BPA Helm chart directory
Kubernetes and Helm deployment
Enabling Monitoring in Values
In the following Helm chart path, edit the Helm values in the “values.yaml” file to enable monitoring:
yaml
  global:
  enableMonitoring: true
Deploying Zipkin Service
Deploy the Zipkin service using the following Helm command:
helm install bpa-rel --create-namespace --namespace bpa-ns <helm chart absolute path>Verifying Deployment
Use the following commands to verify deployment:
kubectl get pods -n bpa-ns | grep tracers-zipkin
kubectl get svc -n bpa-ns | grep tracers-zipkin
Checking Service Status
To view pod logs, use the following command:
kubectl logs -n bpa-ns deployment/tracers-zipkin -fTo check service endpoints, use the following command:
kubectl describe svc tracers-zipkin -n bpa-nsAccess and Monitoring
1-Node Access to Zipkin Dashboard
URL: https://<SERVER IP>:9412/zipkin/
3-Node Kubernetes Access to Zipkin Dashboard
URL: https://<cluster-ip>:30900/zipkin/
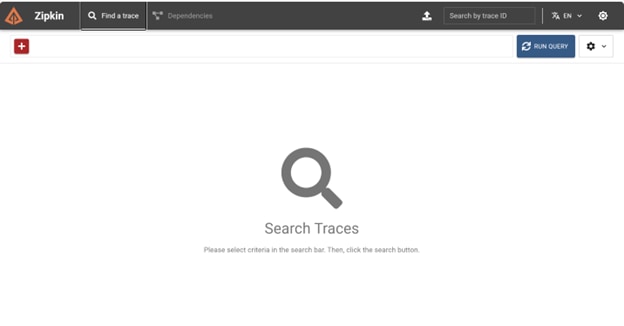
Using Zipkin UI
The Zipkin dashboard provides a UI to search and visualize traces. Key components include:
- Service Name Dropdown: Filter traces by service name
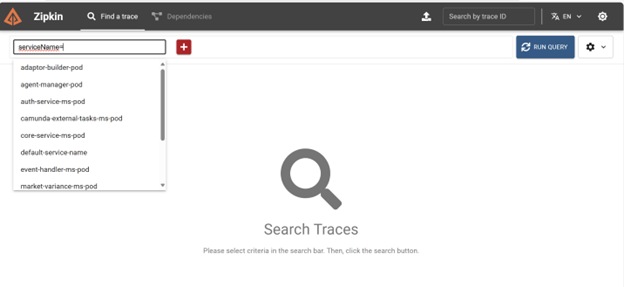
Service Name
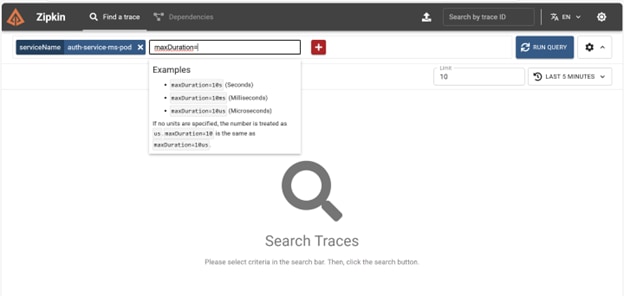
- Time Range Selector: Define the time window for the trace search
- Trace List: Displays a list of traces matching the search criteria
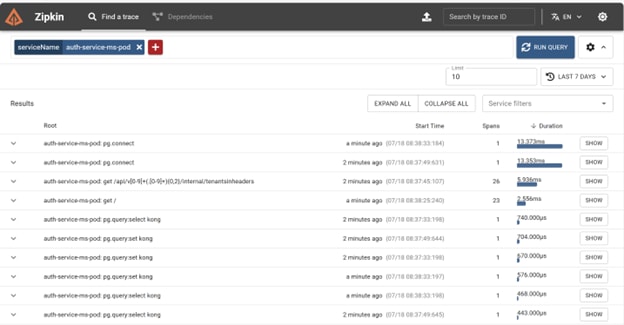
- Trace Timeline: Visual representation of time intervals (i.e., span) within a trace
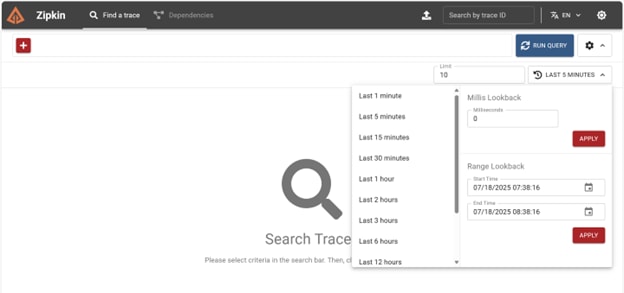
- Span Details: Detailed view of each span, including duration, tags, and logs.
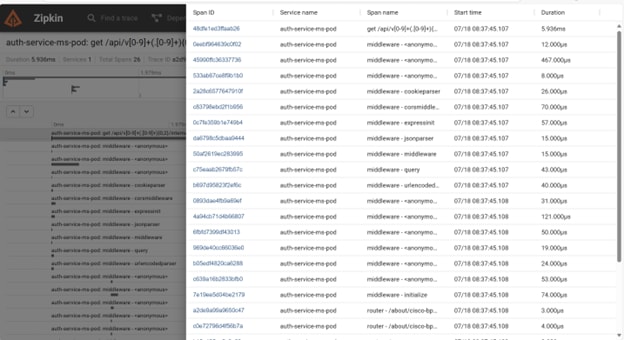
Tracers and Spans
Tracers are responsible for creating and managing spans. A tracer is associated with a specific service or application component. Spans represent a single unit of work or operation within a trace. Each span contains information such as operation name, start and end time, attributes, and parent-child relationships with other spans.
Revision History
| Revision | Publish Date | Comments |
|---|---|---|
1.0 |
24-Sep-2025
|
Initial Release |
 Feedback