
Keep your data, workloads, and applications connected and secure for exceptional efficiency across your global data-center networks.
Unify experiences across all data-center networks
Choose the best operational experience for the job, every time, with secure on-premises and cloud-managed data center networking. Configure with ease, operate with confidence, and analyze for predictability with one fabric experience.
Review, react, relax
Make it easier than ever to assess the situation, deliver a solution, and get to what's next with increased visibility, intelligent automation, and rapid troubleshooting.
Work sustainably
Embrace smart-energy data-center networking with visibility into actual usage of power and your carbon footprint, and enjoy the benefits of being at the forefront of the net-zero journey.
AI blueprint for networking
Boost cost efficiencies and performance with design best-practices and automation templates for AI data-center networking.
Cisco N9400 Series switches
These switches pack high performance and density plus improved telemetry into a compact, modular design.
Cisco N9500 Series Switches
Enterprise or high growth? Modular configurations can support you with ports from 1G to 400G.
Cisco N9800 Series switches
Get high-density switching that's designed for 800G adoption and beyond.
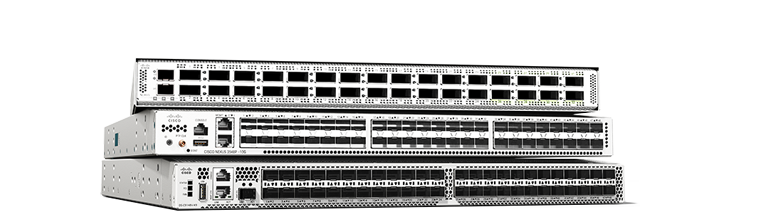
Cisco N9000 400G and 800G family
Bandwidth like you’ve never known. Adopt 400G with scalability to 800G with confidence in a family of 1-, 2-, and 4-RU switches.
Cisco Optics
Fiber-optic transceiver modules to accelerate your network connections.
Cisco N3500 Series portfolio
Design efficient, low-latency networks with programmable platforms, switches, and smart adapters.
Cisco N3550-T Series
FPGA-based programmable network platform for critical, ultra-low latency network applications.
Cisco Nexus SmartNICs
FPGA-based network interface cards (NICs). Ideal for ultra-low latency, high-resolution timestamping.
Cisco N3500 Series Switches
Low-latency, 1RU switches supporting 1G to 40G. Ideal for high-frequency trading (HFT) and big-data environments.
Cisco MDS 9700 Series
A SAN director with scale, performance, integrated analytics, and superior port density.
Cisco MDS 9300 Series
Next-generation high-density fabric switches with integrated analytics and telemetry.
Cisco MDS 9200 Series
High-performance SAN extension, disaster recovery, intelligent fabrics, and multiprotocol connectivity.
Cisco MDS 9100 Series
Flexible and agile, highly available and secure, and easy to use, with visibility to every flow.
Cisco SAN Analytics
Visibility and data-driven guidance, for faster troubleshooting and optimized infrastructure.
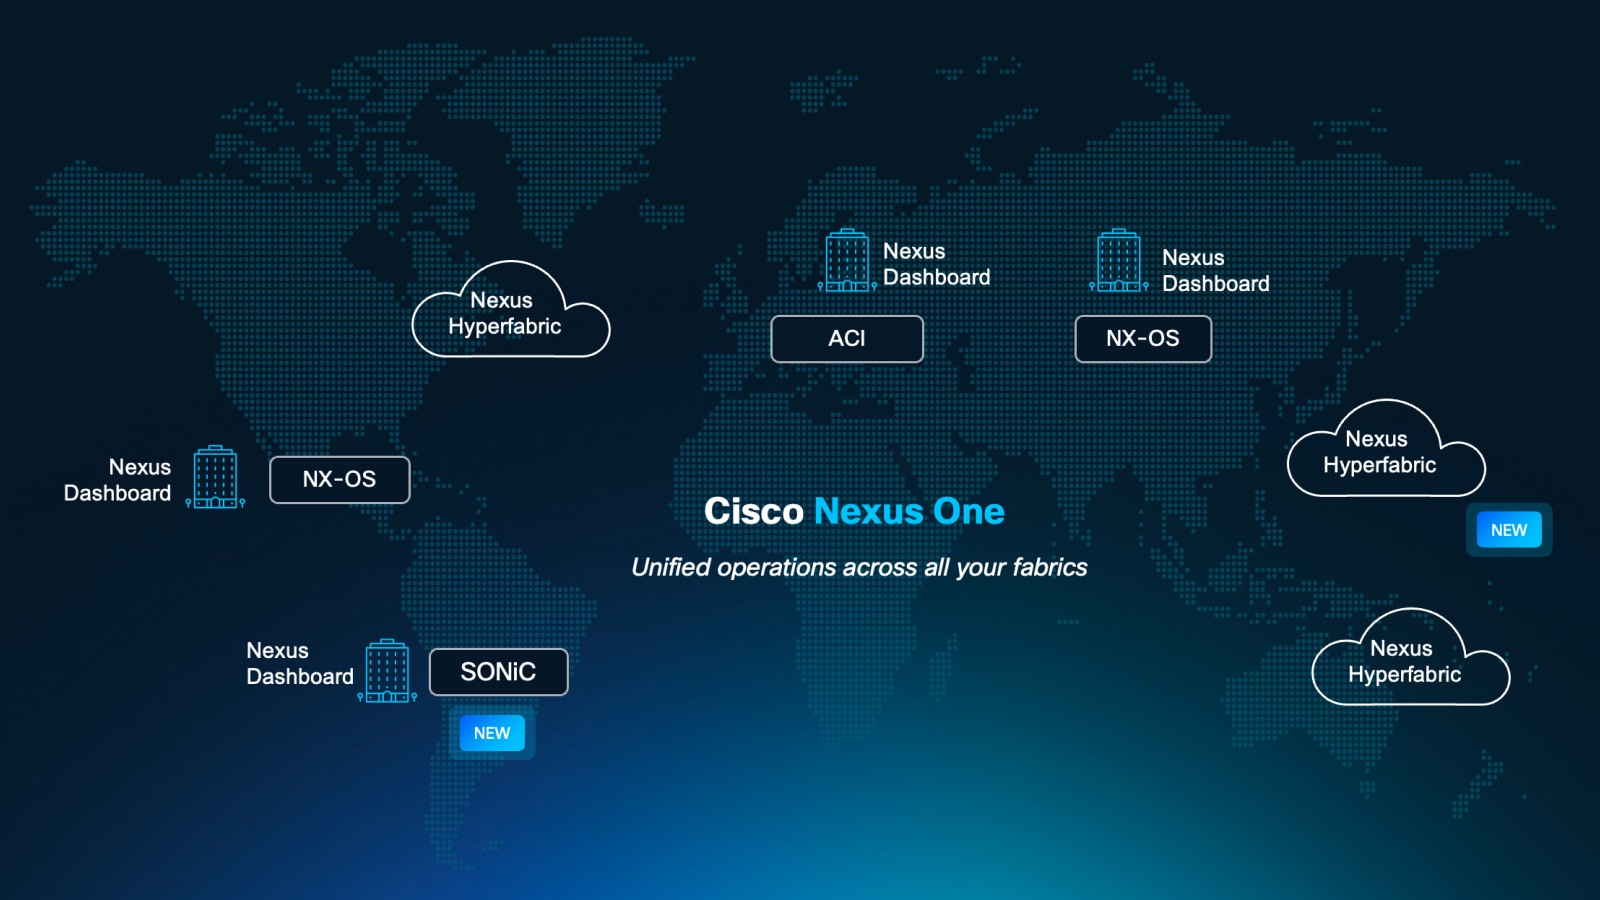
Cisco Nexus One
One architecture across silicon, systems, and software to scale AI factories and modernize enterprise workloads on a unified operating model—without fragmenting operations.
Cisco Application Centric Infrastructure (ACI)
Simplifies data center network management, boosts security with centralized application-centric approach with automation and policy-based control driving agile IT.
Cisco NX-OS
Make your network agile, easily scalable, and secure with simplified network operations and integrated automation.
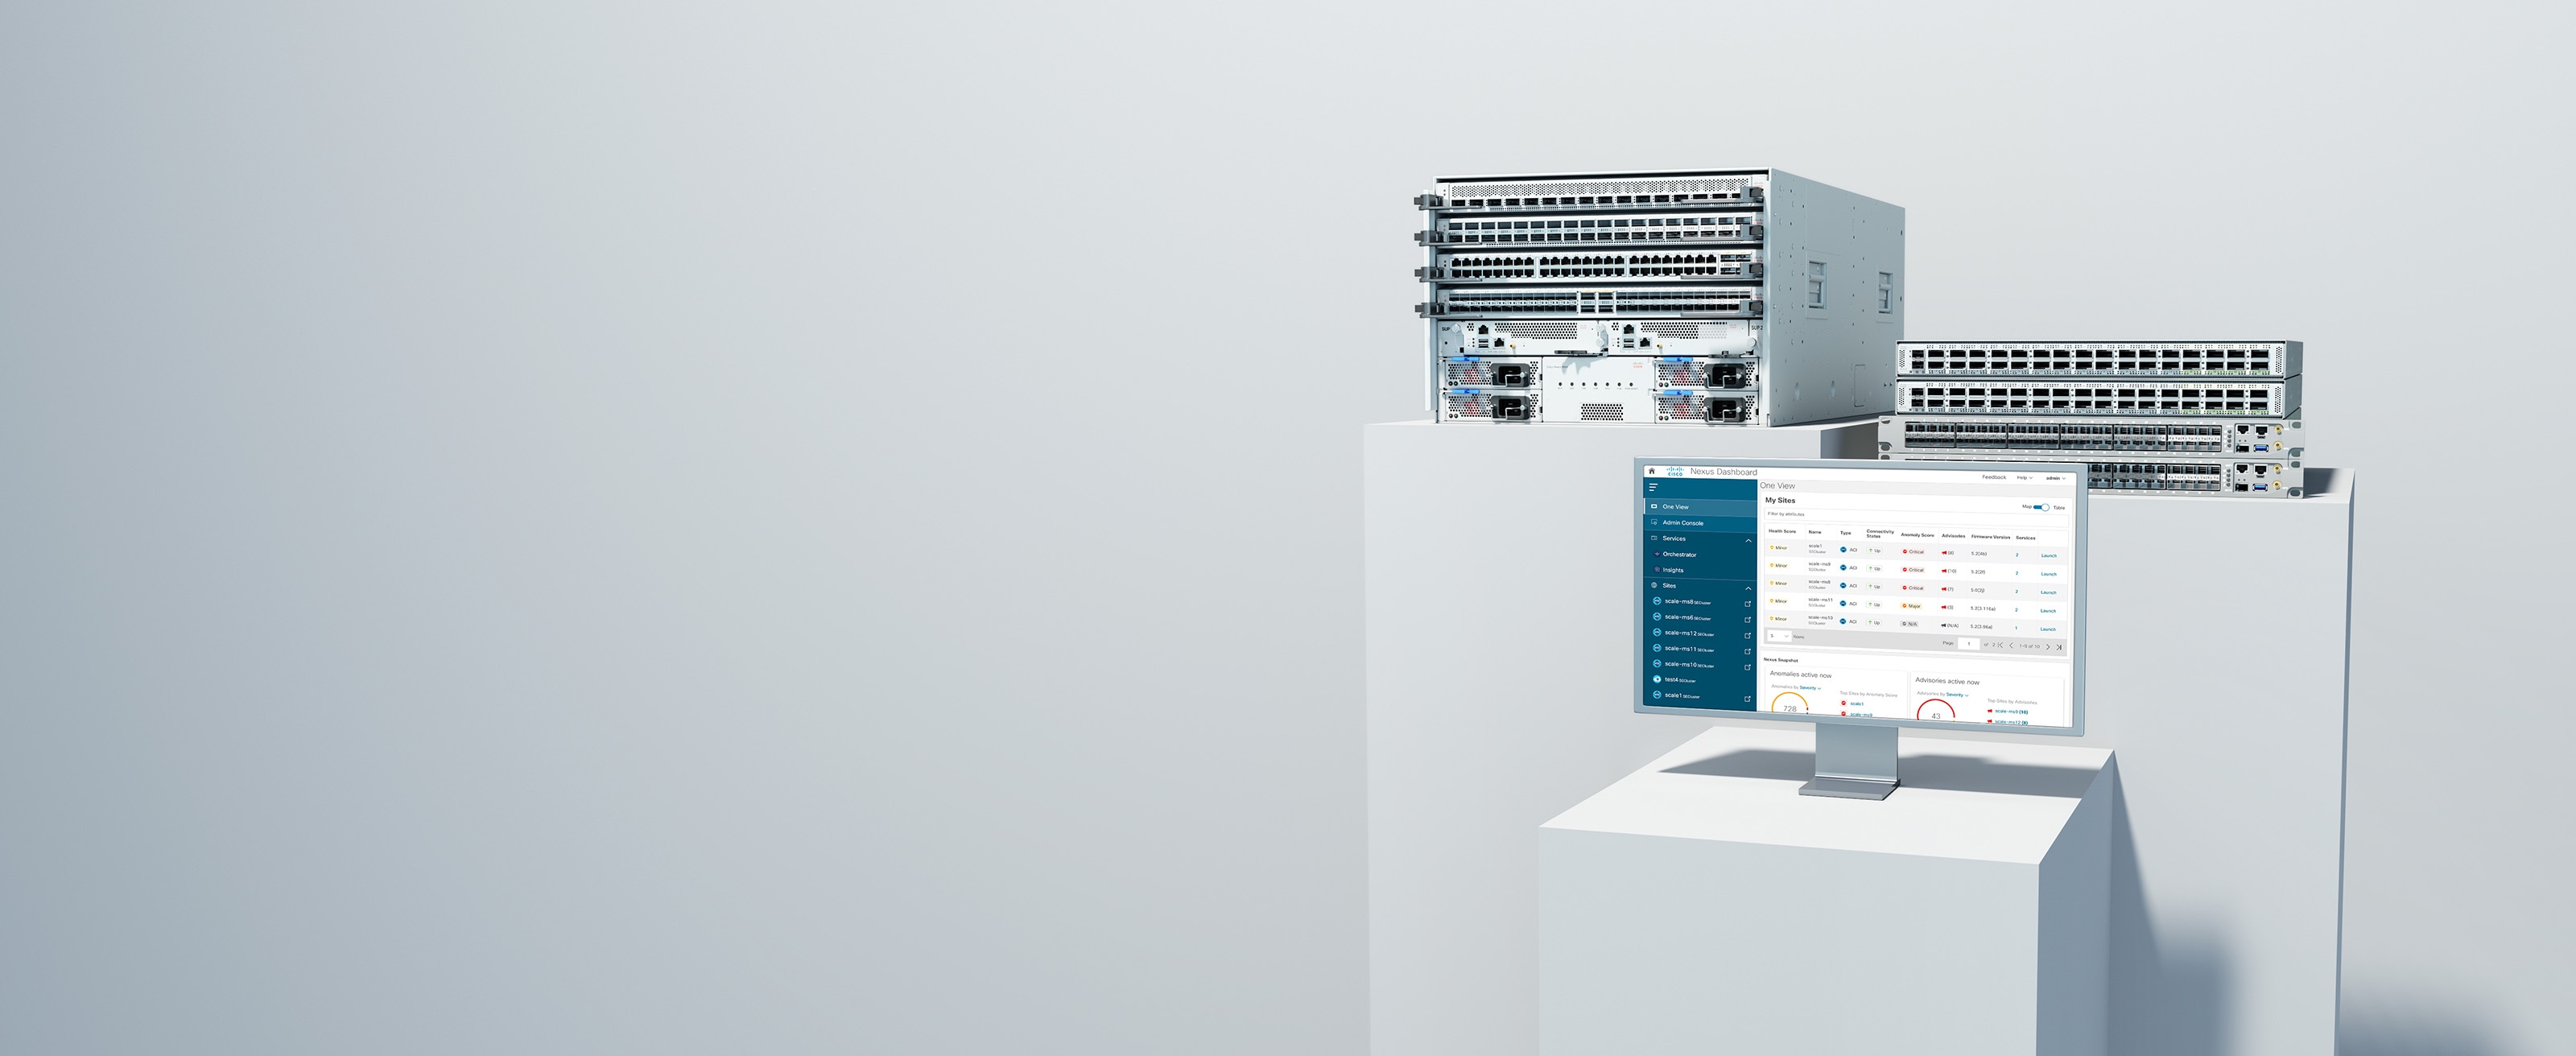
Cisco Nexus Dashboard
Configure, operate, and analyze, all from one place. Private cloud-managed across your data-center networks.
Cisco Nexus Hyperfabric
New plug-and-play, cloud-managed operations and validation of the full lifecycle of data-center networks.
Cisco N9300 Series Smart Switches
Cisco data-center smart switches with Cisco Hypershield fuses networking with security.
Cisco Live Protect
Mitigate common vulnerability and exposure (CVE) threats in real time and help ensure uninterrupted data-center security and operational stability with Cisco Live Protect.

Better together, built to perform

We've got your back
Cisco Services
With you at every step
Guide your data-center networking transformation journey with embedded services and expertise.
Cisco Hybrid Cloud
An exceptional consumption model
Ensure your energy expenditure remains balanced with flexible consumption for your hybrid cloud infrastructure.
Cisco Ecosystem
Joint solutions for increased productivity
Discover the extensible open APIs for today's modern data-center applications.
