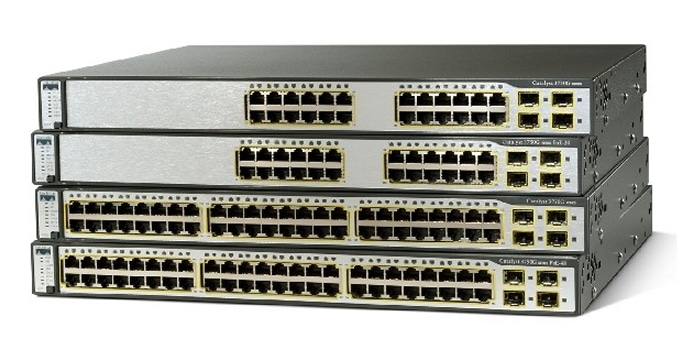
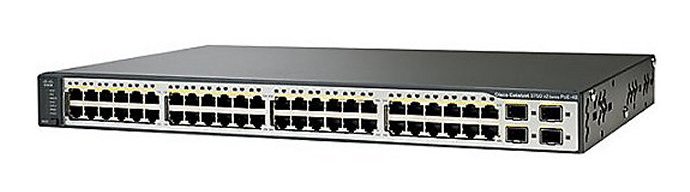
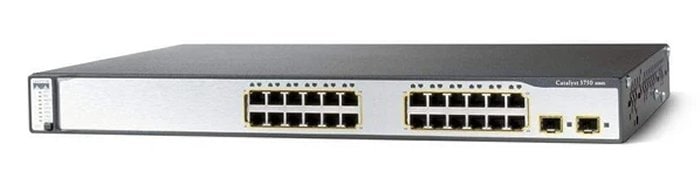
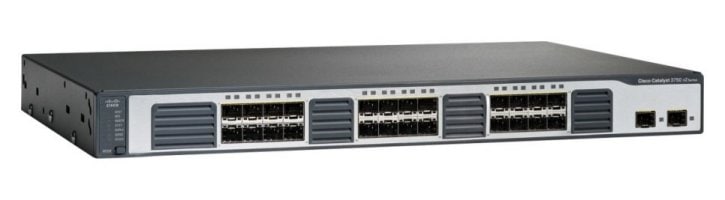
Table Of Contents
rmon collection stats
sdm prefer
service password-recovery
service-policy
session
set
setup
show access-lists
show boot
show class-map
show cluster
show cluster candidates
show cluster members
show controllers cpu-interface
show controllers ethernet-controller
show controllers tcam
show dot1x
show dtp
show env
show errdisable detect
show errdisable flap-values
show errdisable recovery
show etherchannel
show interfaces
show interfaces counters
show ip igmp profile
show ip igmp snooping
show ip igmp snooping mrouter
show ip igmp snooping multicast
show mac-address-table
show mac-address-table address
show mac-address-table aging-time
show mac-address-table count
show mac-address-table dynamic
show mac-address-table interface
show mac-address-table multicast
show mac-address-table notification
show mac-address-table static
show mac-address-table vlan
show mls qos
show mls qos aggregate-policer
show mls qos input-queue
show mls qos interface
show mls qos maps
show mls qos queue-set
show monitor
show mvr
show mvr interface
show mvr members
show pagp
show policy-map
show port-security
show running-config vlan
show sdm prefer
show spanning-tree
show storm-control
show switch
show system mtu
show udld
show version
show vlan
show vlan access-map
show vlan filter
show vmps
show vtp
shutdown
shutdown vlan
snmp-server enable traps
snmp-server host
snmp trap mac-notification
spanning-tree backbonefast
spanning-tree bpdufilter
spanning-tree bpduguard
spanning-tree cost
spanning-tree extend system-id
spanning-tree guard
spanning-tree loopguard default
spanning-tree mode
spanning-tree port-priority
spanning-tree portfast (global configuration)
spanning-tree portfast (interface configuration)
spanning-tree uplinkfast
spanning-tree vlan
speed
srr-queue bandwidth limit
srr-queue bandwidth shape
srr-queue bandwidth share
storm-control
switch priority
switch renumber
switchport
switchport access
switchport block
switchport host
switchport mode
switchport nonegotiate
switchport port-security
switchport port-security aging
switchport priority extend
switchport protected
switchport trunk
switchport voice vlan
system mtu
2
rmon collection stats
Use the rmon collection stats interface configuration command on the switch stack or on a standalone switch to collect Ethernet group statistics, which include utilization statistics about broadcast and multicast packets, and error statistics about Cyclic Redundancy Check (CRC) alignment errors and collisions. Use the no form of this command to return to the default setting.
rmon collection stats index [owner name]
no rmon collection stats index [owner name]
Syntax Description
index
|
Remote Network Monitoring (RMON) collection control index. The range is 1 to 65535.
|
owner name
|
(Optional) Owner of the RMON collection.
|
Defaults
The RMON statistics collection is disabled.
Command Modes
Interface configuration
Command History
Release
|
Modification
|
12.1(11)AX
|
This command was first introduced.
|
Usage Guidelines
The RMON statistics collection command is based on hardware counters.
Examples
This example shows how to collect RMON statistics for the owner root on Gigabit Ethernet interface 0/1 of stack member 2:
Switch(config)# interface gigabitethernet2/0/1
Switch(config-if)# rmon collection stats 2 owner root
You can verify your setting by entering the show rmon statistics privileged EXEC command.
Related Commands
Command
|
Description
|
show rmon statistics
|
Displays RMON statistics.
For syntax information, select Cisco IOS Configuration Fundamentals Command Reference for Release 12.1 > Cisco IOS System Management Commands > RMON Commands.
|
sdm prefer
Use the sdm prefer global configuration command on the switch stack or on a standalone switch to configure the template used in Switch Database Management (SDM) resource allocation. You can use a template to allocate system resources to best support the features being used in your application. Use a template to provide maximum system utilization for unicast routing or for VLAN configuration. Use the no form of this command to return to the default template.
sdm prefer {routing | vlan}
no sdm prefer
Syntax Description
routing
|
Provide maximum system utilization for unicast routing. You would typically use this template for a router or aggregator in the middle of a network.
|
vlan
|
Provide maximum system utilization for VLANs. This template maximizes system resources for use as a Layer 2 switch with no routing.
|
Defaults
The default template provides a balance to all features.
Command Modes
Global configuration
Command History
Release
|
Modification
|
12.1(11)AX
|
This command was first introduced.
|
Usage Guidelines
You must reload the switch for the configuration to take effect.
All stack members use the same SDM template, stored on the stack master. When a new switch member is added to a stack, as with the switch configuration file and VLAN database file, the SDM configuration that is stored on the stack master overrides the template configured on an individual switch.
Use the sdm prefer vlan global configuration command only on switches intended for Layer 2 switching with no routing. When you use the VLAN template, no system resources are reserved for routing entries and any routing is done through software. This overloads the central processing unit (CPU) and severely degrades routing performance.
Do not use the routing template if you do not have routing enabled on your switch. Entering the sdm prefer routing global configuration command prevents other features from using the memory allocated to unicast routing in the routing template (approximately 11 K).
Table 2-12 lists the approximate number of each resource supported in each of the three templates for a switch. The first seven rows in the tables (unicast MAC addresses through security ACEs) represent approximate hardware boundaries set when a template is selected. If a section of a hardware resource is full, all processing overflow is sent to the CPU, seriously impacting switch performance.
The last two rows, the total number of routed ports and SVIs and the number of Layer 2 VLANs, are guidelines used to calculate hardware resource consumption related to the other resource parameters.
.
Table 2-12 Approximate Number of Feature Resources Allowed by Each Template
Resource
|
Default Template
|
Routing Template
|
VLAN Template
|
Unicast MAC addresses
|
6 K
|
3 K
|
12 K
|
IGMP groups and multicast routes
|
1 K
|
1 K
|
1 K
|
Unicast routes
|
8 K
|
11 K
|
0
|
• Directly connected hosts
|
6 K
|
3 K
|
0
|
• Indirect routes
|
2 K
|
8 K
|
0
|
QoS classification ACEs
|
512
|
512
|
512
|
Security ACEs
|
1 K
|
1 K
|
1 K
|
Routed interfaces (routed ports and SVIs)
|
8
|
8
|
8
|
Layer 2 VLANs
|
1 K
|
1 K
|
1 K
|
The total number of routed interfaces is not limited by software and can be set to a number higher than shown in the tables. If the number of routed interfaces configured is lower or equal to the number in the tables, the number of entries in each category (Unicast MAC addresses, IGMP groups, and so on) for each template will be as shown. As the number of routed interfaces is increased, CPU utilization typically increases. If the number of routed interfaces is increased beyond the number shown in the tables, the number of supported entries in each category could decrease depending on other features that are enabled.
Examples
This example shows how to configure the routing template on the switch:
Switch(config)# sdm prefer routing
This example shows how to remove the routing template and to use the default template:
Switch(config)# no sdm prefer routing
You can verify your settings by entering the show sdm prefer privileged EXEC command.
Related Commands
Command
|
Description
|
show sdm prefer
|
Displays the current SDM template in use or displays the templates that can be used, with approximate resource allocation per feature.
|
service password-recovery
Use the service password-recovery global configuration command on the switch stack or on a standalone switch to enable the password-recovery mechanism (the default). This mechanism allows a user with physical access to the switch to hold down the Mode button and interrupt the boot process while the switch is powering up and to assign a new password. Use the no form of this command to disable part of the password-recovery functionality. When the password-recovery mechanism is disabled, interrupting the boot process is allowed only if the user agrees to set the system back to the default configuration.
service password-recovery
no service password-recovery
Syntax Description
This command has no arguments or keywords.
Defaults
The default action is for the password-recovery mechanism to be enabled.
Command Modes
Global configuration
Command History
Release
|
Modification
|
12.1(11)AX
|
This command was first introduced.
|
Usage Guidelines
As a system administrator, you can use the no service password-recovery command to disable some of the functionality of the password recovery feature by allowing an end user to reset a password only by agreeing to return to the default configuration.
The password-recovery mechanism has been triggered, but
is currently disabled. Access to the boot loader prompt
through the password-recovery mechanism is disallowed at
this point. However, if you agree to let the system be
reset back to the default system configuration, access
to the boot loader prompt can still be allowed.
Would you like to reset the system back to the default configuration (y/n)?
If the user chooses not to reset the system back to the default configuration, the normal boot process continues, as if the Mode button had not been pressed. If you choose to reset the system back to the default configuration, the configuration file in flash memory is deleted and the VLAN database file, flash:vlan.dat (if present) is deleted.
Note
If you use the no service password-recovery command to control end user access to passwords, we recommend that you save a copy of the config file in a location away from the switch in case the end user uses the password recovery procedure and sets the system back to defaults. Do not keep a backup copy of the config file on the switch.
If the switch is operating in VTP transparent mode, we recommend that you also save a copy of the vlan.dat file in a location away from the switch.
You can verify if password recovery is enabled or disabled by entering the show version privileged EXEC command.
Examples
This example shows how to disable password recovery on a switch or switch stack so that a user can only reset a password by agreeing to return to the default configuration.
Switch(config)# no service-password recovery
Related Commands
Command
|
Description
|
show version
|
Displays version information for the hardware and firmware.
|
service-policy
Use the service-policy interface configuration command on the switch stack or on a standalone switch to apply a policy map defined by the policy-map command to the input of a particular interface. Use the no form of this command to remove the policy map and interface association.
service-policy input policy-map-name
no service-policy input policy-map-name
Syntax Description
input policy-map-name
|
Apply the specified policy-map to the input of an interface.
|
Note
Though visible in the command-line help strings, the history keyword is not supported, and you should ignore the statistics it gathers. The output keyword is also not supported.
Defaults
No policy maps are attached to the interface.
Command Modes
Interface configuration
Command History
Release
|
Modification
|
12.1(11)AX
|
This command was first introduced.
|
Usage Guidelines
Only one policy map per ingress interface is supported.
Classification using a port trust state (for example, mls qos trust [cos | dscp | ip-precedence] and a policy map (for example, service-policy input policy-map-name) are mutually exclusive. The last one configured overwrites the previous configuration.
Examples
This example shows how to apply plcmap1 to an ingress interface on stack member 2:
Switch(config)# interface gigabitethernet2/0/1
Switch(config-if)# service-policy input plcmap1
This example shows how to detach plcmap2 from an interface on stack member 2:
Switch(config)# interface gigabitethernet2/0/2
Switch(config-if)# no service-policy input plcmap2
You can verify your settings by entering the show running-config privileged EXEC command.
Related Commands
Command
|
Description
|
policy-map
|
Creates or modifies a policy map that can be attached to multiple interfaces to specify a service policy.
|
show policy-map
|
Displays quality of service (QoS) policy maps.
|
session
Use the session privileged EXEC command on the stack master to access a specific stack member.
session stack-member-number
Syntax Description
stack-member-number
|
Specify the current stack member number. The stack member number is in the range from 1 through 9.
|
Defaults
No default is defined.
Command Modes
Global configuration
Command History
Release
|
Modification
|
12.1(11)AX
|
This command was first introduced.
|
Usage Guidelines
When you access the stack member, its stack member number is appended to the system prompt.
Examples
This example shows how to access stack member 6:
Switch(config)# session 6
Related Commands
Command
|
Description
|
reload
|
Saves the configuration change and restarts the stack member.
|
switch priority
|
Changes the stack member priority value.
|
switch renumber
|
Changes the stack member number.
|
show switch
|
Displays information about the switch stack and its stack members.
|
set
Use the set policy-map class configuration command on the switch stack or on a standalone switch to classify IP traffic by setting a Differentiated Services Code Point (DSCP) or IP-precedence value in the packet. Use the no form of this command to remove traffic classification.
set {ip dscp new-dscp | ip precedence new-precedence}
no set {ip dscp new-dscp | ip precedence new-precedence}
Syntax Description
ip dscp new-dscp
|
New DSCP value assigned to the classified traffic. The range is 0 to 63. You also can enter a mnemonic name for a commonly-used value.
|
ip precedence new-precedence
|
New IP-precedence value assigned to the classified traffic. The range is 0 to 7. You also can enter a mnemonic name for a commonly-used value.
|
Note
Though visible in the command-line help strings, the mpls keyword is not supported.
Defaults
No traffic classification is defined.
Command Modes
Policy-map class configuration
Command History
Release
|
Modification
|
12.1(11)AX
|
This command was first introduced.
|
Usage Guidelines
The set command is mutually exclusive with the trust policy-map class configuration command within the same policy map.
For the set ip dscp new-dscp or the set ip precedence new-precedence command, you can enter a mnemonic name for a commonly-used value. For example, you can enter the set ip dscp af11 command, which is the as same entering the set ip dscp 10 command. You can enter the set ip precedence critical command, which is the same as entering the set ip precedence 5 command. For a list of supported mnemonics, enter the set ip dscp ? or the set ip precedence ? command to see the command-line help strings.
To return to policy-map configuration mode, use the exit command. To return to privileged EXEC mode, use the end command.
Examples
This example shows how to assign DSCP 10 to all FTP traffic without any policers:
Switch(config)# policy-map policy_ftp
Switch(config-pmap)# class ftp_class
Switch(config-pmap-c)# set ip dscp 10
Switch(config-pmap)# exit
You can verify your settings by entering the show policy-map privileged EXEC command.
Related Commands
Command
|
Description
|
class
|
Defines a traffic classification match criteria (through the police, set, and trust policy-map class configuration commands) for the specified class-map name.
|
police
|
Defines a policer for classified traffic.
|
policy-map
|
Creates or modifies a policy map that can be attached to multiple interfaces to specify a service policy.
|
show policy-map
|
Displays quality of service (QoS) policy maps.
|
trust
|
Defines a trust state for traffic classified through the class policy-map configuration command or the class-map global configuration command.
|
setup
Use the setup privileged EXEC command to configure the switch with its initial configuration.
setup
Syntax Description
This command has no arguments or keywords.
Command Modes
Privileged EXEC
Command History
Release
|
Modification
|
12.1(11)AX
|
This command was first introduced.
|
Usage Guidelines
When you use the setup command, make sure that you have this information:
•
IP address and network mask
•
Password strategy for your environment
•
Whether the switch will be used as the cluster command switch and the cluster name
When you enter the setup command, an interactive dialog, called the System Configuration Dialog, appears. It guides you through the configuration process and prompts you for information. The values shown in brackets next to each prompt are the default values last set by using either the setup command facility or the configure privileged EXEC command.
Help text is provided for each prompt. To access help text, press the question mark (?) key at a prompt.
To return to the privileged EXEC prompt without making changes and without running through the entire System Configuration Dialog, press Ctrl-C.
When you complete your changes, the setup program shows you the configuration command script that was created during the setup session. You can save the configuration in nonvolatile RAM (NVRAM), return to the setup program without saving, or return to the command-line prompt without saving the configuration.
Examples
This is an example of output from the setup command:
--- System Configuration Dialog ---
Continue with configuration dialog? [yes/no]: yes
At any point you may enter a question mark '?' for help.
Use ctrl-c to abort configuration dialog at any prompt.
Default settings are in square brackets '[]'.
Basic management setup configures only enough connectivity
for management of the system, extended setup will ask you
to configure each interface on the system.
Would you like to enter basic management setup? [yes/no]: yes
Configuring global parameters:
Enter host name [Switch]:host-name
The enable secret is a password used to protect access to
privileged EXEC and configuration modes. This password, after
entered, becomes encrypted in the configuration.
Enter enable secret: enable-secret-password
The enable password is used when you do not specify an
enable secret password, with some older software versions, and
Enter enable password: enable-password
The virtual terminal password is used to protect
access to the router over a network interface.
Enter virtual terminal password: terminal-password
Configure SNMP Network Management? [no]: yes
Community string [public]:
Current interface summary
Any interface listed with OK? value "NO" does not have a valid configuration
Interface IP-Address OK? Method Status Protocol
Vlan1 172.20.135.202 YES NVRAM up up
GigabitEthernet6/0/1 unassigned YES unset up up
GigabitEthernet6/0/2 unassigned YES unset up down
GigabitEthernet6/0/3 unassigned YES unset administratively down down
GigabitEthernet6/0/4 unassigned YES unset up down
GigabitEthernet6/0/5 unassigned YES NVRAM up down
GigabitEthernet6/0/6 unassigned YES NVRAM up down
GigabitEthernet6/0/7 unassigned YES unset up down
GigabitEthernet6/0/8 unassigned YES unset up down
GigabitEthernet6/0/9 unassigned YES unset administratively down down
GigabitEthernet6/0/10 10.1.2.3 YES NVRAM up down
GigabitEthernet6/0/11 unassigned YES unset up down
GigabitEthernet6/0/12 unassigned YES unset up down
Port-channel1 unassigned YES unset up down
Enter interface name used to connect to the
management network from the above interface summary: vlan1
Configuring interface vlan1:
Configure IP on this interface? [yes]: yes
IP address for this interface: ip_address
Subnet mask for this interface [255.0.0.0]: subnet_mask
Would you like to enable as a cluster command switch? [yes/no]: yes
Enter cluster name: cluster-name
The following configuration command script was created:
enable secret 5 $1$LiBw$0Xc1wyT.PXPkuhFwqyhVi0
enable password enable-password
password terminal-password
snmp-server community public
interface GigabitEthernet6/0/1
interface GigabitEthernet6/0/2
interface GigabitEthernet6/0/12
cluster enable cluster-name
Use this configuration? [yes/no]: yes
[0] Go to the IOS command prompt without saving this config.
[1] Return back to the setup without saving this config.
[2] Save this configuration to nvram and exit.
Enter your selection [2]:
Related Commands
Command
|
Description
|
show running-config
|
Displays the running configuration on the switch. For syntax information, select Cisco IOS Configuration Fundamentals Command Reference for Release 12.1 > Cisco IOS File Management Commands > Configuration File Commands.
|
show version
|
Displays version information for the hardware and firmware.
|
show access-lists
Use the show access-lists privileged EXEC command to display access control lists (ACLs) configured on the switch.
show access-lists [name | number | hardware counters] [ | {begin | exclude | include} expression]
Syntax Description
name
|
(Optional) Name of the ACL.
|
number
|
(Optional) ACL number. The range is 1 to 2699.
|
hardware counters
|
(Optional) Display global hardware ACL statistics for switched and routed packets.
|
| begin
|
(Optional) Display begins with the line that matches the expression.
|
| exclude
|
(Optional) Display excludes lines that match the expression.
|
| include
|
(Optional) Display includes lines that match the specified expression.
|
expression
|
Expression in the output to use as a reference point.
|
Note
Though visible in the command-line help strings, the rate-limit keywords are not supported.
Command Modes
Privileged EXEC
Command History
Release
|
Modification
|
12.1(11)AX
|
This command was first introduced.
|
Usage Guidelines
The switch supports only IP standard and extended access lists. Therefore, the allowed numbers are only 1 to 199 and 1300 to 2699.
Expressions are case sensitive. For example, if you enter | exclude output, the lines that contain output are not displayed, but the lines that contain Output are displayed.
Examples
This is an example of output from the show access-lists command:
Switch# show access-lists
Standard IP access list 1
permit 0.255.255.255, wildcard bits 12.0.0.0
Standard IP access list videowizard_1-1-1-1
Standard IP access list videowizard_10-10-10-10
Extended IP access list 121
permit ahp host 10.10.10.10 host 20.20.10.10 precedence routine
Extended IP access list CMP-NAT-ACL
Dynamic Cluster-HSRP deny ip any any
deny ip any host 19.19.11.11
deny ip any host 10.11.12.13
Dynamic Cluster-NAT permit ip any any
permit ip host 10.99.100.128 any
permit ip host 10.46.22.128 any
permit ip host 10.45.101.64 any
permit ip host 10.45.20.64 any
permit ip host 10.213.43.128 any
permit ip host 10.91.28.64 any
permit ip host 10.99.75.128 any
permit ip host 10.38.49.0 any
This is an example of output from the show access-lists hardware counters command:
Switch# show access-lists hardware counters
Drop: All frame count: 855
Drop: All bytes count: 94143
Drop And Log: All frame count: 0
Drop And Log: All bytes count: 0
Bridge Only: All frame count: 0
Bridge Only: All bytes count: 0
Bridge Only And Log: All frame count: 0
Bridge Only And Log: All bytes count: 0
Forwarding To CPU: All frame count: 0
Forwarding To CPU: All bytes count: 0
Forwarded: All frame count: 2121
Forwarded: All bytes count: 180762
Forwarded And Log: All frame count: 0
Forwarded And Log: All bytes count: 0
Drop And Log: All frame count: 0
Drop And Log: All bytes count: 0
Bridge Only: All frame count: 0
Bridge Only: All bytes count: 0
Bridge Only And Log: All frame count: 0
Bridge Only And Log: All bytes count: 0
Forwarding To CPU: All frame count: 0
Forwarding To CPU: All bytes count: 0
Forwarded: All frame count: 13586
Forwarded: All bytes count: 1236182
Forwarded And Log: All frame count: 0
Forwarded And Log: All bytes count: 0
Drop And Log: All frame count: 0
Drop And Log: All bytes count: 0
Bridge Only: All frame count: 0
Bridge Only: All bytes count: 0
Bridge Only And Log: All frame count: 0
Bridge Only And Log: All bytes count: 0
Forwarding To CPU: All frame count: 0
Forwarding To CPU: All bytes count: 0
Forwarded: All frame count: 232983
Forwarded: All bytes count: 16825661
Forwarded And Log: All frame count: 0
Forwarded And Log: All bytes count: 0
Drop And Log: All frame count: 0
Drop And Log: All bytes count: 0
Bridge Only: All frame count: 0
Bridge Only: All bytes count: 0
Bridge Only And Log: All frame count: 0
Bridge Only And Log: All bytes count: 0
Forwarding To CPU: All frame count: 0
Forwarding To CPU: All bytes count: 0
Forwarded: All frame count: 514434
Forwarded: All bytes count: 39048748
Forwarded And Log: All frame count: 0
Forwarded And Log: All bytes count: 0
Related Commands
Command
|
Description
|
access-list
|
Configures a standard or extended numbered access list on the switch. For syntax information, select Cisco IOS IP and IP Routing Command Reference for IOS Release 12.1 > IP Addressing and Services > IP Services Commands.
|
ip access list
|
Configures a named IP access list on the switch. For syntax information, select Cisco IOS IP and IP Routing Command Reference for IOS Release 12.1 > IP Addressing and Services > IP Services Commands.
|
mac access-list extended
|
Configures a named or numbered MAC access list on the switch.
|
show boot
Use the show boot privileged EXEC command to display the settings of the boot environment variables.
show boot [ | {begin | exclude | include} expression]
Syntax Description
| begin
|
(Optional) Display begins with the line that matches the expression.
|
| exclude
|
(Optional) Display excludes lines that match the expression.
|
| include
|
(Optional) Display includes lines that match the specified expression.
|
expression
|
Expression in the output to use as a reference point.
|
Command Modes
Privileged EXEC
Command History
Release
|
Modification
|
12.1(11)AX
|
This command was first introduced.
|
Usage Guidelines
Expressions are case sensitive. For example, if you enter | exclude output, the lines that contain output are not displayed, but the lines that contain Output are displayed.
Examples
This is an example of output from the show boot command. Table 2-13 describes each field in the display.
BOOT path-list: flash:c3750-i5q3l2-mz-121.11.AX/c3750-i5q3l2-mz-121.11.AX.bin
Config file: flash:config.text
Private Config file: private-config
Table 2-13 show boot Field Descriptions
Field
|
Description
|
BOOT path-list
|
Displays a semicolon separated list of executable files to try to load and execute when automatically booting.
If the BOOT environment variable is not set, the system attempts to load and execute the first executable image it can find by using a recursive, depth-first search through the Flash file system. In a depth-first search of a directory, each encountered subdirectory is completely searched before continuing the search in the original directory.
If the BOOT variable is set but the specified images cannot be loaded, the system attempts to boot the first bootable file that it can find in the Flash file system.
|
Config file
|
Displays the filename that IOS uses to read and write a nonvolatile copy of the system configuration.
|
Private Config file
|
Displays the filename that IOS uses to read and write a nonvolatile copy of the system configuration.
|
Enable Break
|
Displays whether a break during booting is enabled or disabled. If it is set to yes, on, or 1, you can interrupt the automatic boot process by pressing the Break key on the console after the Flash file system is initialized.
|
Manual Boot
|
Displays whether the switch automatically or manually boots. If it is set to no or 0, the boot loader attempts to automatically boot the system. If it is set to anything else, you must manually boot the switch from the boot loader mode.
|
Helper path-list
|
Displays a semicolon separated list of loadable files to dynamically load during the boot loader initialization. Helper files extend or patch the functionality of the boot loader.
|
NVRAM/Config file buffer size
|
Displays the buffer size that IOS uses to hold a copy of the configuration file in memory. The configuration file cannot be larger than the buffer size allocation.
|
Related Commands
Command
|
Description
|
boot config-file
|
Specifies the filename that IOS uses to read and write a nonvolatile copy of the system configuration.
|
boot enable-break
|
Enables interrupting the automatic boot process.
|
boot manual
|
Enables manually booting the switch during the next boot cycle.
|
boot private-config-file
|
Specifies the filename that IOS uses to read and write a nonvolatile copy of the private configuration.
|
boot system
|
Specifies the IOS image to load during the next boot cycle.
|
show class-map
Use the show class-map user EXEC command to display quality of service (QoS) class maps, which define the match criteria to classify traffic.
show class-map [class-map-name] [ | {begin | exclude | include} expression]
Syntax Description
class-map-name
|
(Optional) Display the contents of the specified class map.
|
| begin
|
(Optional) Display begins with the line that matches the expression.
|
| exclude
|
(Optional) Display excludes lines that match the expression.
|
| include
|
(Optional) Display includes lines that match the specified expression.
|
expression
|
Expression in the output to use as a reference point.
|
Command Modes
User EXEC
Command History
Release
|
Modification
|
12.1(11)AX
|
This command was first introduced.
|
Usage Guidelines
Expressions are case sensitive. For example, if you enter | exclude output, the lines that contain output are not displayed, but the lines that contain Output are displayed.
Examples
This is an example of output from the show class-map command:
Class Map match-all videowizard_10-10-10-10 (id 2)
Match access-group name videowizard_10-10-10-10
Class Map match-any class-default (id 0)
Class Map match-all dscp5 (id 3)
Related Commands
show cluster
Use the show cluster user EXEC command to display the cluster status and a summary of the cluster to which the switch belongs. This command can be entered on the cluster command switch and cluster member switches.
show cluster [ | {begin | exclude | include} expression]
Syntax Description
| begin
|
(Optional) Display begins with the line that matches the expression.
|
| exclude
|
(Optional) Display excludes lines that match the expression.
|
| include
|
(Optional) Display includes lines that match the specified expression.
|
expression
|
Expression in the output to use as a reference point.
|
Command Modes
User EXEC
Command History
Release
|
Modification
|
12.1(11)AX
|
This command was first introduced.
|
Usage Guidelines
If you enter this command on a switch that is not a cluster member, the error message Not a management cluster member appears.
On a cluster member switch, this command displays the identity of the cluster command switch, the switch member number, and the state of its connectivity with the cluster command switch.
On a cluster command switch stack or cluster command switch, this command displays the cluster name and the total number of members. It also shows the cluster status and time since the status changed. If redundancy is enabled, it displays the primary and secondary command-switch information.
Expressions are case sensitive. For example, if you enter | exclude output, the lines that contain output are not displayed, but the lines that contain Output are displayed.
Examples
This is an example of output when the show cluster command is entered on the active cluster command switch:
Command switch for cluster "Ajang"
Total number of members: 7
Status: 1 members are unreachable
Time since last status change: 0 days, 0 hours, 2 minutes
Standby command switch: Member 1
Standby Group: Ajang_standby
Standby Group Number: 110
Extended discovery hop count: 3
This is an example of output when the show cluster command is entered on a cluster member switch:
Member switch for cluster "hapuna"
Management IP address: 192.192.192.192
Command switch mac address: 0000.0c07.ac14
This is an example of output when the show cluster command is entered on a cluster member switch that is configured as the standby cluster command switch:
Member switch for cluster "hapuna"
Member number: 3 (Standby command switch)
Management IP address: 192.192.192.192
Command switch mac address: 0000.0c07.ac14
This is an example of output when the show cluster command is entered on the cluster command switch that has lost connectivity with member 1:
Command switch for cluster "Ajang"
Total number of members: 7
Status: 1 members are unreachable
Time since last status change: 0 days, 0 hours, 5 minutes
Extended discovery hop count: 3
This is an example of output when the show cluster command is entered on a cluster member switch that has lost connectivity with the cluster command switch:
Member switch for cluster "hapuna"
Management IP address: 192.192.192.192
Command switch mac address: 0000.0c07.ac14
Related Commands
Command
|
Description
|
cluster enable
|
Enables a command-capable switch as the cluster command switch, assigns a cluster name, and optionally assigns a member number to it.
|
show cluster candidates
|
Displays a list of candidate switches.
|
show cluster members
|
Displays information about the cluster members.
|
show cluster candidates
Use the show cluster candidates privileged EXEC command on a switch stack or on a cluster command switch to display a list of candidate switches.
show cluster candidates [detail | mac-address H.H.H.] [ | {begin | exclude | include} expression]
Syntax Description
detail
|
(Optional) Display detailed information for all candidates.
|
mac-address H.H.H.
|
(Optional) MAC address of the cluster candidate.
|
| begin
|
(Optional) Display begins with the line that matches the expression.
|
| exclude
|
(Optional) Display excludes lines that match the expression.
|
| include
|
(Optional) Display includes lines that match the specified expression.
|
expression
|
Expression in the output to use as a reference point.
|
Command Modes
User EXEC
Command History
Release
|
Modification
|
12.1(11)AX
|
This command was first introduced.
|
Usage Guidelines
This command is available only on the cluster command switch stack or cluster command switch.
If the switch is not a cluster command switch, the command displays an empty line at the prompt.
The SN in the display means switch member number. If E appears in the SN column, it means that the switch is discovered through extended discovery. If E does not appear in the SN column, it means that the switch member number is the upstream neighbor of the candidate switch. The hop count is the number of devices the candidate is from the cluster command switch.
Expressions are case sensitive. For example, if you enter | exclude output, the lines that contain output are not displayed, but the lines that contain Output are displayed.
Examples
This is an example of output from the show cluster candidates command:
Switch> show cluster candidates
MAC Address Name Device Type PortIf FEC Hops SN PortIf FEC
00d0.7961.c4c0 StLouis-2 WS-C3750-12T Gi6/0/1 2 1 Fa0/11
00d0.bbf5.e900 ldf-dist-128 WS-C3524-XL Fa0/7 1 0 Fa0/24
00e0.1e7e.be80 1900_Switch 1900 3 0 1 0 Fa0/11
00e0.1e9f.7a00 Surfers-24 WS-C2924-XL Fa0/5 1 0 Fa0/3
00e0.1e9f.8c00 Surfers-12-2 WS-C2912-XL Fa0/4 1 0 Fa0/7
00e0.1e9f.8c40 Surfers-12-1 WS-C2912-XL Fa0/1 1 0 Fa0/9
This is an example of output from the show cluster candidates command that uses the MAC address of a cluster member switch directly connected to the cluster command switch:
Switch> show cluster candidates mac-address 00d0.7961.c4c0
Device 'Tahiti-12' with mac address number 00d0.7961.c4c0
Device type: cisco WS-C3750-12T
Upstream MAC address: 00d0.796d.2f00 (Cluster Member 0)
Local port: Gi6/0/1 FEC number:
Upstream port: GI6/0/11 FEC Number:
Hops from cluster edge: 1
Hops from command device: 1
This is an example of output from the show cluster candidates command that uses the MAC address of a cluster member switch three hops from the cluster edge:
Switch> show cluster candidates mac-address 0010.7bb6.1cc0
Device 'Ventura' with mac address number 0010.7bb6.1cc0
Device type: cisco WS-C2912MF-XL
Upstream MAC address: 0010.7bb6.1cd4
Local port: Fa2/1 FEC number:
Upstream port: Fa0/24 FEC Number:
Hops from cluster edge: 3
Hops from command device: -
This is an example of output from the show cluster candidates detail command:
Switch> show cluster candidates detail
Device 'Tahiti-12' with mac address number 00d0.7961.c4c0
Device type: cisco WS-C3512-XL
Upstream MAC address: 00d0.796d.2f00 (Cluster Member 1)
Local port: Fa0/3 FEC number:
Upstream port: Fa0/13 FEC Number:
Hops from cluster edge: 1
Hops from command device: 2
Device '1900_Switch' with mac address number 00e0.1e7e.be80
Upstream MAC address: 00d0.796d.2f00 (Cluster Member 2)
Local port: 3 FEC number: 0
Upstream port: Fa0/11 FEC Number:
Hops from cluster edge: 1
Hops from command device: 2
Device 'Surfers-24' with mac address number 00e0.1e9f.7a00
Device type: cisco WS-C2924-XL
Upstream MAC address: 00d0.796d.2f00 (Cluster Member 3)
Local port: Fa0/5 FEC number:
Upstream port: Fa0/3 FEC Number:
Hops from cluster edge: 1
Hops from command device: 2
Related Commands
Command
|
Description
|
show cluster
|
Displays the cluster status and a summary of the cluster to which the switch belongs.
|
show cluster members
|
Displays information about the cluster members.
|
show cluster members
Use the show cluster members privileged EXEC command on a switch stack or on a cluster command switch to display information about the cluster members.
show cluster members [n | detail] [ | {begin | exclude | include} expression]
Syntax Description
n
|
(Optional) Number that identifies a cluster member. The range is 0 to 15.
|
detail
|
(Optional) Display detailed information for all cluster members.
|
| begin
|
(Optional) Display begins with the line that matches the expression.
|
| exclude
|
(Optional) Display excludes lines that match the expression.
|
| include
|
(Optional) Display includes lines that match the specified expression.
|
expression
|
Expression in the output to use as a reference point.
|
Command Modes
Privileged EXEC
Command History
Release
|
Modification
|
12.1(11)AX
|
This command was first introduced.
|
Usage Guidelines
This command is available only on the cluster command switch stack or cluster command switch.
If the cluster has no members, this command displays an empty line at the prompt.
Expressions are case sensitive. For example, if you enter | exclude output, the lines that contain output are not displayed, but the lines that contain Output are displayed.
Examples
This is an example of output from the show cluster members command. The SN in the display means switch number.
Switch# show cluster members
SN MAC Address Name PortIf FEC Hops SN PortIf FEC State
0 0002.4b29.2e00 StLouis1 0 Up (Cmdr)
1 0030.946c.d740 tal-switch-1 Fa0/13 1 0 Gi0/1 Up
2 0002.b922.7180 nms-2820 10 0 2 1 Fa0/18 Up
3 0002.4b29.4400 SanJuan2 Gi0/1 2 1 Fa0/11 Up
4 0002.4b28.c480 GenieTest Gi0/2 2 1 Fa0/9 Up
This is an example of output from the show cluster members for cluster member 3:
Switch# show cluster members 3
Device 'SanJuan2' with member number 3
Device type: cisco WS-C3750-12T
MAC address: 0002.4b29.4400
Upstream MAC address: 0030.946c.d740 (Cluster member 1)
Local port: Gi6/0/1 FEC number:
Upstream port: GI6/0/11 FEC Number:
Hops from command device: 2
This is an example of output from the show cluster members detail command:
Switch# show cluster members detail
Device 'StLouis1' with member number 0 (Command Switch)
Device type: cisco WS-C3750-12T
MAC address: 0002.4b29.2e00
Upstream port: FEC Number:
Hops from command device: 0
Device 'tal-switch-14' with member number 1
Device type: cisco WS-C3548-XL
MAC address: 0030.946c.d740
Upstream MAC address: 0002.4b29.2e00 (Cluster member 0)
Local port: Fa0/13 FEC number:
Upstream port: Gi0/1 FEC Number:
Hops from command device: 1
Device 'nms-2820' with member number 2
MAC address: 0002.b922.7180
Upstream MAC address: 0030.946c.d740 (Cluster member 1)
Local port: 10 FEC number: 0
Upstream port: Fa0/18 FEC Number:
Hops from command device: 2
Device 'SanJuan2' with member number 3
Device type: cisco WS-C3750-12T
MAC address: 0002.4b29.4400
Upstream MAC address: 0030.946c.d740 (Cluster member 1)
Local port: Gi6/0/1 FEC number:
Upstream port: Fa6/0/11 FEC Number:
Hops from command device: 2
Device 'GenieTest' with member number 4
Device type: cisco SeaHorse
MAC address: 0002.4b28.c480
Upstream MAC address: 0030.946c.d740 (Cluster member 1)
Local port: Gi0/2 FEC number:
Upstream port: Fa0/9 FEC Number:
Hops from command device: 2
Device 'Palpatine' with member number 5
Device type: cisco WS-C2924M-XL
MAC address: 00b0.6404.f8c0
Upstream MAC address: 0002.4b29.2e00 (Cluster member 0)
Local port: Gi2/1 FEC number:
Upstream port: Gi0/7 FEC Number:
Hops from command device: 1
Related Commands
Command
|
Description
|
show cluster
|
Displays the cluster status and a summary of the cluster to which the switch belongs.
|
show cluster candidates
|
Displays a list of candidate switches.
|
show controllers cpu-interface
Use the show controllers cpu-interface privileged EXEC command to display the state of the CPU network interface application-specific integrated circuit (ASIC) and the send and receive statistics for packets reaching the CPU.
show controllers cpu-interface [ | {begin | exclude | include} expression]
Syntax Description
| begin
|
(Optional) Display begins with the line that matches the expression.
|
| exclude
|
(Optional) Display excludes lines that match the expression.
|
| include
|
(Optional) Display includes lines that match the specified expression.
|
expression
|
Expression in the output to use as a reference point.
|
Command Modes
Privileged EXEC
Command History
Release
|
Modification
|
12.1(11)AX
|
This command was first introduced.
|
Usage Guidelines
This display provides information that might be useful for Cisco technical support representatives troubleshooting the switch.
Expressions are case sensitive. For example, if you enter | exclude output, the lines that contain output are not displayed, but the lines that contain Output are displayed.
Examples
This is a partial output example from the show controllers cpu- interface command:
Switch# show controllers cpu-interface
cpu-queue-frames retrieved dropped invalid hol-block
----------------- ---------- ---------- ---------- ----------
routing protocol 96145 0 0 0
igmp snooping 68411 0 0 0
cpu heartbeat 1710501 0 0 0
Supervisor ASIC receive-queue parameters
----------------------------------------
queue 0 maxrecevsize 5EE pakhead 1419A20 paktail 13EAED4
queue 1 maxrecevsize 5EE pakhead 15828E0 paktail 157FBFC
queue 2 maxrecevsize 5EE pakhead 1470D40 paktail 1470FE4
queue 3 maxrecevsize 5EE pakhead 19CDDD0 paktail 19D02C8
Supervisor ASIC Mic Registers
------------------------------
MicDirectPollInfo 80000800
MicIndicationsReceived 00000000
MicInterruptsReceived 00000000
MicPlbMasterConfiguration 00000000
MicRxFifosAvailable 00000000
MicTimeOutPeriod: FrameTOPeriod: 00000EA6 DirectTOPeriod: 00004000
Fifo0: StartPtrs: 038C2800 ReadPtr: 038C2C38
WritePtrs: 038C2C38 Fifo_Flag: 8A800800
Fifo1: StartPtr: 03A9BC00 ReadPtr: 03A9BC60
WritePtrs: 03A9BC60 Fifo_Flag: 89800400
Fifo2: StartPtr: 038C8800 ReadPtr: 038C88E0
WritePtrs: 038C88E0 Fifo_Flag: 88800200
Fifo3: StartPtr: 03C30400 ReadPtr: 03C30638
WritePtrs: 03C30638 Fifo_Flag: 89800400
Fifo4: StartPtr: 03AD5000 ReadPtr: 03AD50A0
WritePtrs: 03AD50A0 Fifo_Flag: 89800400
Fifo5: StartPtr: 03A7A600 ReadPtr: 03A7A600
WritePtrs: 03A7A600 Fifo_Flag: 88800200
Fifo6: StartPtr: 03BF8400 ReadPtr: 03BF87F0
WritePtrs: 03BF87F0 Fifo_Flag: 89800400
Related Commands
Command
|
Description
|
show controllers ethernet-controller
|
Displays per-interface send and receive statistics read from the hardware or the interface internal registers.
|
show interfaces
|
Displays the administrative and operational status of all interfaces or a specified interface.
|
show controllers ethernet-controller
Use the show controllers ethernet-controller privileged EXEC command without keywords to display per-interface send and receive statistics read from the hardware. Use with the phy keyword to display the interface internal registers or the port-asic keyword to display information about the port application-specific integrated circuit (ASIC).
show controllers ethernet-controller [ [interface-id] [phy [detail] | port-asic {configuration |
statistics}] [ | {begin | exclude | include} expression]
Syntax Description
interface-id
|
The physical interface (including type, stack member, module, and port number).
|
phy
|
(Optional) Display the status of the internal registers on the switch physical layer device (PHY) for the device or the interface.
|
detail
|
(Optional) Display details about the PHY internal registers.
|
port-asic
|
(Optional) Display information about the port ASIC internal registers.
|
configuration
|
Display port ASIC internal register configuration.
|
statistics
|
Display port ASIC statistics, including the Rx/Sup Queue and miscellaneous statistics.
|
| begin
|
(Optional) Display begins with the line that matches the expression.
|
| exclude
|
(Optional) Display excludes lines that match the expression.
|
| include
|
(Optional) Display includes lines that match the specified expression.
|
expression
|
Expression in the output to use as a reference point.
|
Command Modes
Privileged EXEC
Command History
Release
|
Modification
|
12.1(11)AX
|
This command was first introduced.
|
Usage Guidelines
This display without keywords provides traffic statistics, basically the RMON statistics for all interfaces or for the specified interface.
When you enter the phy or port-asic keywords, the displayed information is useful primarily for Cisco technical support representatives troubleshooting the switch.
Expressions are case sensitive. For example, if you enter | exclude output, the lines that contain output are not displayed, but the lines that contain Output are displayed.
Examples
This is an example of output from the show controllers ethernet-controller command for an interface:
Switch# show controllers ethernet-controller GigabitEthernet6/0/1
Transmit GigabitEthernet6/0/1 Receive
0 Unicast frames 0 Unicast frames
0 Multicast frames 0 Multicast frames
0 Broadcast frames 0 Broadcast frames
0 Too old frames 0 Unicast bytes
0 Deferred frames 0 Multicast bytes
0 MTU exceeded frames 0 Broadcast bytes
0 1 collision frames 0 Alignment errors
0 2 collision frames 0 FCS errors
0 3 collision frames 0 Oversize frames
0 4 collision frames 0 Undersize frames
0 5 collision frames 0 Collision fragments
0 7 collision frames 0 Minimum size frames
0 8 collision frames 0 65 to 127 byte frames
0 9 collision frames 0 128 to 255 byte frames
0 10 collision frames 0 256 to 511 byte frames
0 11 collision frames 0 512 to 1023 byte frames
0 12 collision frames 0 1024 to 1518 byte frames
0 13 collision frames 0 Overrun frames
0 14 collision frames 0 Pause frames
0 15 collision frames 0 Symbol error frames
0 Late collisions 0 Invalid frames, too large
0 VLAN discard frames 0 Valid frames, too large
0 Excess defer frames 0 Invalid frames, too small
0 64 byte frames 0 Valid frames, too small
0 255 byte frames 0 Too old frames
0 511 byte frames 0 Valid oversize frames
0 1023 byte frames 0 System FCS error frames
0 1518 byte frames 0 RxPortFifoFull drop frame
This is an example of output from the show controllers ethernet-controller phy command:
Switch# show controllers ethernet-controller phy
GigabitEthernet1/0/1 (gpn: 3, port-number: 1)
-----------------------------------------------------------
Control Register : 0001 0001 0100 0000
Control STATUS : 0111 1001 0100 1001
Phy ID 1 : 0000 0001 0100 0001
Phy ID 2 : 0000 1100 0010 0100
Auto-Negotiation Advertisement : 0000 0011 1110 0001
Auto-Negotiation Link Partner : 0000 0000 0000 0000
Auto-Negotiation Expansion Reg : 0000 0000 0000 0100
Next Page Transmit Register : 0010 0000 0000 0001
Link Partner Next page Registe : 0000 0000 0000 0000
1000BASE-T Control Register : 0000 1111 0000 0000
1000BASE-T Status Register : 0100 0000 0000 0000
Extended Status Register : 0011 0000 0000 0000
PHY Specific Control Register : 0000 0000 0011 1000
PHY Specific Status Register : 1000 0001 0100 0000
Interrupt Enable : 0000 0000 0000 0000
Interrupt Status : 0000 0000 0100 0000
Extended PHY Specific Control : 0000 1100 1110 0000
Receive Error Counter : 0000 0000 0000 0000
Reserved Register 1 : 0000 0000 0000 0000
Global Status : 0000 0000 0000 0000
LED Control : 0100 0001 0000 0000
Manual LED Override : 0000 1000 0010 1010
Extended PHY Specific Control : 0000 0000 0000 1010
Disable Receiver 1 : 0000 0000 0000 00GigabitEthernet1/0/2 (gpn: 4,
port-number: 2)
-----------------------------------------------------------
Control Register : 0011 0001 0000 0000
Control STATUS : 0111 1000 0000 1001
Phy ID 1 : 0000 0000 0001 0011
Phy ID 2 : 0111 1000 1111 1011
Auto-Negotiation Advertisement : 0000 0011 1110 0001
Auto-Negotiation Link Partner : 0000 0000 0000 0000
Auto-Negotiation Expansion Reg : 0000 0000 0000 0100
Next Page Transmit Register : 0010 0000 0000 0001
Auto-Negotiation Expansion Reg : 0000 0000 0000 0100
This is an example of output from the show controllers ethernet-controller port-asic configuration command:
Switch# show controllers ethernet-controller port-asic configuration
========================================================================
Switch 4, PortASIC 0 Registers
------------------------------------------------------------------------
SupervisorReceiveFifoSramInfo : 000007D0 000007D0 40000000
SupervisorTransmitFifoSramInfo : 000001D0 000001D0 40000000
IndicationStatus : 00000000
IndicationStatusMask : FFFFFFFF
InterruptStatus : 00000000
InterruptStatusMask : 01FFE800
SupervisorDiag : 00000000
SupervisorFrameSizeLimit : 000007C8
SupervisorBroadcast : 000A0F01
GeneralIO : 000003F9 00000000 00000004
StackPcsInfo : FFFF1000 860329BD 5555FFFF FFFFFFFF
FF0FFF00 86020000 5555FFFF 00000000
StackRacInfo : 73001630 00000003 7F001644 00000003
24140003 FD632B00 18E418E0 FFFFFFFF
StackControlStatus : 18E418E0
stackControlStatusMask : FFFFFFFF
TransmitBufferFreeListInfo : 00000854 00000800 00000FF8 00000000
0000088A 0000085D 00000FF8 00000000
TransmitRingFifoInfo : 00000016 00000016 40000000 00000000
0000000C 0000000C 40000000 00000000
TransmitBufferInfo : 00012000 00000FFF 00000000 00000030
TransmitBufferCommonCount : 00000F7A
TransmitBufferCommonCountPeak : 0000001E
TransmitBufferCommonCommonEmpty : 000000FF
NetworkActivity : 00000000 00000000 00000000 02400000
DroppedStatistics : 00000000
FrameLengthDeltaSelect : 00000001
SneakPortFifoInfo : 00000000
MacInfo : 0EC0801C 00000001 0EC0801B 00000001
00C0001D 00000001 00C0001E 00000001
This is an example of output from the show controllers ethernet-controller port-asic statistics command:
Switch# show controllers ethernet-controller port-asic statistics
===========================================================================
Switch 1, PortASIC 0 Statistics
---------------------------------------------------------------------------
0 RxQ-0, wt-0 enqueue frames 0 RxQ-0, wt-0 drop frames
4118966 RxQ-0, wt-1 enqueue frames 0 RxQ-0, wt-1 drop frames
0 RxQ-0, wt-2 enqueue frames 0 RxQ-0, wt-2 drop frames
0 RxQ-1, wt-0 enqueue frames 0 RxQ-1, wt-0 drop frames
296 RxQ-1, wt-1 enqueue frames 0 RxQ-1, wt-1 drop frames
2836036 RxQ-1, wt-2 enqueue frames 0 RxQ-1, wt-2 drop frames
0 RxQ-2, wt-0 enqueue frames 0 RxQ-2, wt-0 drop frames
0 RxQ-2, wt-1 enqueue frames 0 RxQ-2, wt-1 drop frames
158377 RxQ-2, wt-2 enqueue frames 0 RxQ-2, wt-2 drop frames
0 RxQ-3, wt-0 enqueue frames 0 RxQ-3, wt-0 drop frames
0 RxQ-3, wt-1 enqueue frames 0 RxQ-3, wt-1 drop frames
0 RxQ-3, wt-2 enqueue frames 0 RxQ-3, wt-2 drop frames
15 TxBufferFull Drop Count 0 Rx Fcs Error Frames
0 TxBufferFrameDesc BadCrc16 0 Rx Invalid Oversize Frames
0 TxBuffer Bandwidth Drop Cou 0 Rx Invalid Too Large Frames
0 TxQueue Bandwidth Drop Coun 0 Rx Invalid Too Large Frames
0 TxQueue Missed Drop Statist 0 Rx Invalid Too Small Frames
74 RxBuffer Drop DestIndex Cou 0 Rx Too Old Frames
0 SneakQueue Drop Count 0 Tx Too Old Frames
0 Learning Queue Overflow Fra 0 System Fcs Error Frames
0 Learning Cam Skip Count
15 Sup Queue 0 Drop Frames 0 Sup Queue 8 Drop Frames
0 Sup Queue 1 Drop Frames 0 Sup Queue 9 Drop Frames
0 Sup Queue 2 Drop Frames 0 Sup Queue 10 Drop Frames
0 Sup Queue 3 Drop Frames 0 Sup Queue 11 Drop Frames
0 Sup Queue 4 Drop Frames 0 Sup Queue 12 Drop Frames
0 Sup Queue 5 Drop Frames 0 Sup Queue 13 Drop Frames
0 Sup Queue 6 Drop Frames 0 Sup Queue 14 Drop Frames
0 Sup Queue 7 Drop Frames 0 Sup Queue 15 Drop Frames
===========================================================================
Switch 1, PortASIC 1 Statistics
---------------------------------------------------------------------------
0 RxQ-0, wt-0 enqueue frames 0 RxQ-0, wt-0 drop frames
52 RxQ-0, wt-1 enqueue frames 0 RxQ-0, wt-1 drop frames
0 RxQ-0, wt-2 enqueue frames 0 RxQ-0, wt-2 drop frames
Related Commands
Command
|
Description
|
show boot
|
Displays the state of the CPU network ASIC and send and receive statistics for packets reaching the CPU.
|
show controllers tcam
|
Displays the state of registers for all ternary content addressable memory (TCAM) and TCAM ASICs.
|
show controllers tcam
Use the show controllers tcam privileged EXEC command to display the state of the registers for all ternary content addressable memory (TCAM) in the system and for all TCAM interface application-specific integrated circuits (ASICs) that are CAM controllers.
show controllers tcam [detail] [ | {begin | exclude | include} expression]
Syntax Description
detail
|
(Optional) Display detailed TCAM register information.
|
| begin
|
(Optional) Display begins with the line that matches the expression.
|
| exclude
|
(Optional) Display excludes lines that match the expression.
|
| include
|
(Optional) Display includes lines that match the specified expression.
|
expression
|
Expression in the output to use as a reference point.
|
Command Modes
Privileged EXEC
Command History
Release
|
Modification
|
12.1(11)AX
|
This command was first introduced.
|
Usage Guidelines
This display provides information that might be useful for Cisco technical support representatives troubleshooting the switch.
Expressions are case sensitive. For example, if you enter | exclude output, the lines that contain output are not displayed, but the lines that contain Output are displayed.
Examples
This is an example of output from the show controllers tcam command:
Switch# show controllers tcam
------------------------------------------------------------------------
------------------------------------------------------------------------
GMR31: FF_FFFFFFFF_FFFFFFFF
GMR32: FF_FFFFFFFF_FFFFFFFF
GMR33: FF_FFFFFFFF_FFFFFFFF
=============================================================================
TCAM related PortASIC 1 registers
=============================================================================
LookupType: 89A1C67D_24E35F00
ForwardingRamBaseAddress:
00022A00 0002FE00 00040600 0002FE00 0000D400
00000000 003FBA00 00009000 00009000 00040600
00000000 00012800 00012900
Related Commands
show dot1x
Use the show dot1x privileged EXEC command to display 802.1X statistics, administrative status, and operational status for the switch or for the specified interface.
show dot1x [interface interface-id | statistics [interface interface-id]] [ | {begin | exclude |
include} expression]
Syntax Description
interface interface-id
|
(Optional) Display the 802.1X status for the specified interface (including type, stack member, module, and port number).
|
statistics [interface interface-id]
|
(Optional) Display 802.1X statistics for the switch or the specified interface (including type, stack member, module, and port number).
|
| begin
|
(Optional) Display begins with the line that matches the expression.
|
| exclude
|
(Optional) Display excludes lines that match the expression.
|
| include
|
(Optional) Display includes lines that match the specified expression.
|
expression
|
Expression in the output to use as a reference point.
|
Command Modes
Privileged EXEC
Command History
Release
|
Modification
|
12.1(11)AX
|
This command was first introduced.
|
Usage Guidelines
If you do not specify an interface, global parameters and a summary are displayed. If you specify an interface, details for that interface are displayed.
If you specify the statistics keyword without the interface interface-id option, statistics are displayed for all interfaces. If you specify the statistics keyword with the interface interface-id option, statistics are displayed for the specified interface.
Expressions are case sensitive. For example, if you enter | exclude output, the lines that contain output are not displayed, but the lines that contain Output are displayed.
Examples
This is an example of output from the show dot1x privileged EXEC command:
Port Name Status Mode Authorized
Gi1/0/2 enabled Auto (negotiate) yes
Gi2/0/3 enabled Auto (negotiate) yes
802.1X is disabled on GigabitEthernet1/0/1
802.1X is enabled on GigabitEthernet1/0/2
Supplicant 0060.b0f8.fbfb
Multiple Hosts Disallowed
Authenticator State Machine
Reauthentication State Machine
802.1X is disabled on GigabitEthernet1/0/3
802.1X is disabled on GigabitEthernet1/0/4
Note
In the previous display, the supp-timeout, server-timeout, and reauth-max values in the Global 802.1X Parameters section are not configurable. When relaying a request from the RADIUS authentication server to the client, the supp-timeout is the amount of time the switch waits for a response before it resends the request. When relaying a response from the client to the RADIUS authentication server, the server-timeout is the amount of time the switch waits for a reply before it resends the response. The reauth-max parameter is the maximum number of times that the switch tries to authenticate the client without receiving any response before the switch resets the port and restarts the authentication process.
In the 802.1X Port Summary section of the display, the Status column shows whether the port is enabled for 802.1X (the dot1x port-control interface configuration command is set to auto or force-unauthorized). The Mode column shows the operational status of the port. For example, if you configure the dot1x port-control interface configuration command to force-unauthorized, but the port has not transitioned to that state, the Mode column displays auto. If you disable 802.1X, the Mode column displays n/a.
The Authorized column shows the authorization state of the port. For information about port states, refer to the "Configuring 802.1X Port-Based Authentication" chapter in the software configuration guide for this release.
This is an example of output from the show dot1x interface gigabitethernet1/0/2 privileged EXEC command. Table 2-14 describes the fields in the display.
Switch# show dot1x interface gigabitethernet1/0/2
802.1X is enabled on GigabitEthernet1/0/2
Supplicant 0060.b0f8.fbfb
Multiple Hosts Disallowed
Authenticator State Machine
Reauthentication State Machine
Table 2-14 show dot1x interface Field Description
Field
|
Description
|
802.1X is enabled on GigabitEthernet1/0/2
|
|
Status
|
Status of the port (authorized or unauthorized). The status of a port is displayed as authorized if the dot1x port-control interface configuration command is set to auto and has successfully completed authentication.
|
Port-control
|
Setting of the dot1x port-control interface configuration command.
|
Supplicant
|
Ethernet MAC address of the client, if one exists. If the switch has not discovered the client, this field displays Not set.
|
Multiple Hosts
|
Setting of the dot1x multiple-hosts interface configuration command (allowed or disallowed).
|
Current Identifier1
|
Each exchange between the switch and the client includes an identifier, which matches requests with responses. This number is incremented with each exchange and can be reset by the authentication server.
|
This is an example of output from the show dot1x statistics interface gigabitethernet2/0/3 command. Table 2-15 describes the fields in the display.
Switch# show dot1x statistics interface gigabitethernet2/0/3
Rx: EAPOL EAPOL EAPOL EAPOL EAP EAP EAP
Start Logoff Invalid Total Resp/Id Resp/Oth LenError
Table 2-15 show dot1x statistics Field Descriptions
Field
|
Description
|
RX EAPOL Start
|
Number of valid EAPOL-start frames that have been received
|
RX EAPOL Logoff
|
Number of EAPOL-logoff frames that have been received
|
RX EAPOL Invalid
|
Number of EAPOL frames that have been received and have an unrecognized frame type
|
RX EAPOL Total
|
Number of valid EAPOL frames of any type that have been received
|
RX EAP Resp/ID
|
Number of EAP-response/identity frames that have been received
|
RX EAP Resp/Oth
|
Number of valid EAP-response frames (other than response/identity frames) that have been received
|
RX EAP LenError
|
Number of EAPOL frames that have been received in which the packet body length field is invalid
|
Last EAPOLVer
|
Protocol version number carried in the most recently received EAPOL frame
|
LAST EAPOLSrc
|
Source MAC address carried in the most recently received EAPOL frame
|
TX EAPOL Total
|
Number of EAPOL frames of any type that have been sent
|
TX EAP Req/Id
|
Number of EAP-request/identity frames that have been sent
|
TX EAP Req/Oth
|
Number of EAP-request frames (other than request/identity frames) that have been sent
|
Related Commands
Command
|
Description
|
dot1x default
|
Resets the configurable 802.1X parameters to their default values.
|
show dtp
Use the show dtp privileged EXEC command to display Dynamic Trunking Protocol (DTP) information for the switch or for a specified interface.
show dtp [interface interface-id] [ | {begin | exclude | include} expression]
Syntax Description
interface interface-id
|
(Optional) Display port security settings for the specified interface. Valid interfaces include physical ports (including type, stack member, module, and port number).
|
| begin
|
(Optional) Display begins with the line that matches the expression.
|
| exclude
|
(Optional) Display excludes lines that match the expression.
|
| include
|
(Optional) Display includes lines that match the specified expression.
|
expression
|
Expression in the output to use as a reference point.
|
Command Modes
User EXEC
Command History
Release
|
Modification
|
12.1(11)AX
|
This command was first introduced.
|
Usage Guidelines
Expressions are case sensitive. For example, if you enter | exclude output, the lines that contain output are not displayed, but the lines that contain Output are displayed.
Examples
This is an example of output from the show dtp command:
Sending DTP Hello packets every 30 seconds
Dynamic Trunk timeout is 300 seconds
This is an example of output from the show dtp interface command:
Switch# show dtp interface gigabitethernet1/0/1
DTP information for GigabitEthernet1/0/1:
TOS/TAS/TNS: ACCESS/AUTO/ACCESS
TOT/TAT/TNT: NATIVE/NEGOTIATE/NATIVE
Neighbor address 1: 000943A7D081
Neighbor address 2: 000000000000
Hello timer expiration (sec/state): 1/RUNNING
Access timer expiration (sec/state): never/STOPPED
Negotiation timer expiration (sec/state): never/STOPPED
Multidrop timer expiration (sec/state): never/STOPPED
3160 packets received (3160 good)
0 nonegotiate, 0 bad version, 0 domain mismatches, 0 bad TLVs, 0 other
6320 packets output (6320 good)
3160 native, 3160 software encap isl, 0 isl hardware native
1 link ups, last link up on Mon Mar 01 1993, 01:02:29
Related Commands
Command
|
Description
|
show interfaces trunk
|
Displays interface trunking information.
|
show env
Use the show env user EXEC command to display fan, temperature, redundant power system (RPS) availability, and power information for the switch being accessed (standalone switch or stack master or stack member). Use with the stack keyword to display all information for the stack or for a specified switch in the stack.
show env {all | fan | power | rps | stack [switch-number] | temperature} [ | {begin | exclude |
include} expression]
Syntax Description
all
|
Display both fan and temperature environmental status.
|
fan
|
Display the switch fan status.
|
power
|
Display the switch power status.
|
rps
|
Display whether an RPS 300 Redundant Power System is connected to the switch.
|
stack [switch-number]
|
Display all environmental status for each switch in the stack or for the specified switch. The range is 1 to 9, depending on the switch member numbers in the stack.
|
temperature
|
Display the switch temperature status.
|
| begin
|
(Optional) Display begins with the line that matches the expression.
|
| exclude
|
(Optional) Display excludes lines that match the expression.
|
| include
|
(Optional) Display includes lines that match the specified expression.
|
expression
|
Expression in the output to use as a reference point.
|
Command Modes
User EXEC
Command History
Release
|
Modification
|
12.1(11)AX
|
This command was first introduced.
|
Usage Guidelines
Use the show access-lists privileged EXEC command to access information from a specific switch other than the master.
You can use the show env stack [switch-number] command to display information about any switch in the stack from any switch member.
Expressions are case sensitive. For example, if you enter | exclude output, the lines that contain output are not displayed, but the lines that contain Output are displayed.
Examples
This is an example of output from the show env all command issued from the master switch or a standalone switch:
This is an example of output from the show env fan command:
This is an example of output from the show env stack command:
This example shows how to display information about stack member 3 from the master switch:
show errdisable detect
Use the show errdisable detect user EXEC command to display error-disable detection status.
show errdisable detect [ | {begin | exclude | include} expression]
Syntax Description
| begin
|
(Optional) Display begins with the line that matches the expression.
|
| exclude
|
(Optional) Display excludes lines that match the expression.
|
| include
|
(Optional) Display includes lines that match the specified expression.
|
expression
|
Expression in the output to use as a reference point.
|
Command Modes
User EXEC
Command History
Release
|
Modification
|
12.1(11)AX
|
This command was first introduced.
|
Usage Guidelines
Expressions are case sensitive. For example, if you enter | exclude output, the lines that contain output are not displayed, but the lines that contain Output are displayed.
On the Catalyst 3750 switch, a displayed gbic-invalid error reason refers to an invalid small form-factor pluggable (SFP) interface.
Examples
This is an example of output from the show errdisable detect command:
Switch> show errdisable detect
ErrDisable Reason Detection status
----------------- ----------------
Related Commands
show errdisable flap-values
Use the show errdisable flap-values user EXEC command to display conditions that cause an error to be recognized for a cause.
show errdisable flap-values [ | {begin | exclude | include} expression]
Syntax Description
| begin
|
(Optional) Display begins with the line that matches the expression.
|
| exclude
|
(Optional) Display excludes lines that match the expression.
|
| include
|
(Optional) Display includes lines that match the specified expression.
|
expression
|
Expression in the output to use as a reference point.
|
Command Modes
User EXEC
Command History
Release
|
Modification
|
12.1(11)AX
|
This command was first introduced.
|
Usage Guidelines
The Flaps column in the display shows how many changes to the state within the specified time interval will cause an error to be detected and a port to be disabled. For example, the display shows that an error will be assumed and the port shut down if three Dynamic Trunking Protocol (DTP)-state (port mode access/trunk) or Port Aggregation Protocol (PAgP) flap changes occur during a 30-second interval, or if 5 link-state (link up/down) changes occur during a 10-second interval.
ErrDisable Reason Flaps Time (sec)
----------------- ------ ----------
Expressions are case sensitive. For example, if you enter | exclude output, the lines that contain output are not displayed, but the lines that contain Output are displayed.
Examples
This is an example of output from the show errdisable flap-values command:
Switch> show errdisable flap-values
ErrDisable Reason Flaps Time (sec)
----------------- ------ ----------
Related Commands
show errdisable recovery
Use the show errdisable recovery user EXEC command to display the error-disable recovery timer information.
show errdisable recovery [ | {begin | exclude | include} expression]
Syntax Description
| begin
|
(Optional) Display begins with the line that matches the expression.
|
| exclude
|
(Optional) Display excludes lines that match the expression.
|
| include
|
(Optional) Display includes lines that match the specified expression.
|
expression
|
Expression in the output to use as a reference point.
|
Command Modes
User EXEC
Command History
Release
|
Modification
|
12.1(11)AX
|
This command was first introduced.
|
Usage Guidelines
Expressions are case sensitive. For example, if you enter | exclude output, the lines that contain output are not displayed, but the lines that contain Output are displayed.
On the Catalyst 3750 switch, a gbic-invalid error-disable reason refers to an invalid small form-factor pluggable (SFP) interface.
Examples
This is an example of output from the show errdisable recovery command:
Switch> show errdisable recovery
ErrDisable Reason Timer Status
----------------- --------------
channel-misconfig Disabled
psecure-violation Disabled
Timer interval:300 seconds
Interfaces that will be enabled at the next timeout:
Interface Errdisable reason Time left(sec)
--------- ----------------- --------------
Related Commands
show etherchannel
Use the show etherchannel user EXEC command to display EtherChannel information for a channel.
show etherchannel [channel-group-number] {brief | detail | load-balance | port | port-channel |
summary} [ | {begin | exclude | include} expression]
Syntax Description
channel-group-number
|
(Optional) Number of the channel group. The range is 1 to 12.
|
brief
|
Display a summary of EtherChannel information.
|
detail
|
Display detailed EtherChannel information.
|
load-balance
|
Display the load-balance or frame-distribution scheme among ports in the port channel.
|
port
|
Display EtherChannel port information.
|
port-channel
|
Display port-channel information.
|
summary
|
Display a one-line summary per channel-group.
|
| begin
|
(Optional) Display begins with the line that matches the expression.
|
| exclude
|
(Optional) Display excludes lines that match the expression.
|
| include
|
(Optional) Display includes lines that match the specified expression.
|
expression
|
Expression in the output to use as a reference point.
|
Command Modes
User EXEC
Command History
Release
|
Modification
|
12.1(11)AX
|
This command was first introduced.
|
Usage Guidelines
If you do not specify a channel-group, all channel groups are displayed.
In the output, the Passive port list field is displayed only for Layer 3 port channels. This field means that the physical interface, which is still not up, is configured to be in the channel group (and indirectly is in the only port channel in the channel group).
Expressions are case sensitive. For example, if you enter | exclude output, the lines that contain output are not displayed, but the lines that contain Output are displayed.
Examples
This is an example of output from the show etherchannel 1 detail command:
Switch> show etherchannel 1 detail
Port-channels: 1 Max Port-channels = 1
Port state = Up Mstr In-Bndl
Channel group = 1 Mode = Desirable-Sl Gcchange = 0
Port-channel = Po1 GC = 0x00010001 Pseudo port-channel = Po1
Port index = 0 Load = 0x00
Flags: S - Device is sending Slow hello. C - Device is in Consistent state.
A - Device is in Auto mode. P - Device learns on physical port.
Timers: H - Hello timer is running. Q - Quit timer is running.
S - Switching timer is running. I - Interface timer is running.
Hello Partner PAgP Learning Group
Port Flags State Timers Interval Count Priority Method Ifindex
Gi1/0/1 SC U6/S7 H 30s 1 128 Any 16
Partner Partner Partner Partner Group
Port Name Device ID Port Age Flags Cap.
Gi0/1 vegas-p2 0002.4b29.4600 Gi0/1 9s SC 10001
Age of the port in the current state: 00d:00h:07m:52s
Port state = Up Mstr In-Bndl
Channel group = 1 Mode = Desirable-Sl Gcchange = 0
Port-channel = Po1 GC = 0x00010001 Pseudo port-channel = Po1
Port index = 0 Load = 0x00
Flags: S - Device is sending Slow hello. C - Device is in Consistent state.
A - Device is in Auto mode. P - Device learns on physical port.
Timers: H - Hello timer is running. Q - Quit timer is running.
S - Switching timer is running. I - Interface timer is running.
Hello Partner PAgP Learning Group
Port Flags State Timers Interval Count Priority Method Ifindex
Gi1/0/2 SC U6/S7 H 30s 1 128 Any 16
Partner Partner Partner Partner Group
Port Name Device ID Port Age Flags Cap.
Gi0/2 vegas-p2 0002.4b29.4600 Gi0/2 4s SC 10001
Age of the port in the current state: 00d:00h:07m:55s
Port-channels in the group:
Age of the Port-channel = 00d:00h:08m:28s
Logical slot/port = 1/0 Number of ports = 2
GC = 0x00010001 HotStandBy port = null
Port state = Port-channel Ag-Inuse
Ports in the Port-channel:
------+------+------+--------------------
0 00 Gi1/0/1 desirable-sl
0 00 Gi1/0/2 desirable-sl
Time since last port bundled: 00d:00h:07m:56s Gi1/0/1
This is an example of output from the show etherchannel 1 summary command:
Switch> show etherchannel 1 summary
Flags: D - down P - in port-channel
I - stand-alone s - suspended
-----+------------+-----------------------------------------------------------
1 Po1(SU) Gi1/0/1(P) Gi1/0/2(P)
This is an example of output from the show etherchannel 1 brief command:
Switch> show etherchannel 1 brief
Port-channels: 1 Max Port-channels = 1
This is an example of output from the show etherchannel 1 port-channel command:
Switch> show etherchannel 1 port-channel
Port-channels in the group:
Age of the Port-channel = 00d:00h:10m:41s
Logical slot/port = 1/0 Number of ports = 2
GC = 0x00010001 HotStandBy port = null
Port state = Port-channel Ag-Inuse
Ports in the Port-channel:
------+------+------+-------------------
0 00 Gi1/0/1 desirable-sl
0 00 Gi1/0/2 desirable-sl
Time since last port bundled: 00d:00h:10m:08s Gi1/0/1
Related Commands
show interfaces
Use the show interfaces privileged EXEC command to display the administrative and operational status of all interfaces or a specified interface.
show interfaces [interface-id | vlan vlan-id] [accounting | counters | description | etherchannel |
flowcontrol | pruning | stats | status [err-disabled] | switchport | trunk] [ | {begin | exclude
| include} expression]
Syntax Description
interface-id
|
(Optional) Valid interfaces include physical ports (including type, stack member, module, and port number) and port channels. The valid port-channel range is 1 to 12.
|
vlan vlan-id
|
(Optional) VLAN identification. The range is 1 to 4094.
|
accounting
|
(Optional) Display accounting information on the interface, including active protocols and input and output packets and octets.
|
counters
|
(Optional) See the show interfaces counters command.
|
description
|
(Optional) Display the administrative status and description set for an interface.
|
etherchannel
|
(Optional) Display interface EtherChannel information.
|
flowcontrol
|
(Optional) Display interface flowcontrol information
|
pruning
|
(Optional) Display interface trunk VTP pruning information.
|
stats
|
(Optional) Display the input and output packets by switching path for the interface.
|
status
|
(Optional) Display the status of the interface.
|
err-disabled
|
(Optional) Display interfaces in error-disabled state.
|
switchport
|
(Optional) Display the administrative and operational status of a switching (nonrouting) port, including port blocking and port protection settings.
|
trunk
|
Display interface trunk information. If you do not specify an interface, information for only active trunking ports is displayed.
|
| begin
|
(Optional) Display begins with the line that matches the expression.
|
| exclude
|
(Optional) Display excludes lines that match the expression.
|
| include
|
(Optional) Display includes lines that match the specified expression.
|
expression
|
Expression in the output to use as a reference point.
|

Note
Though visible in the command-line help strings, the capabilities, crb, fair-queue, irb, mac-accounting, precedence, private-vlan mapping, random-detect, rate-limit, and shape keywords are not supported.
Command Modes
Privileged EXEC
Command History
Release
|
Modification
|
12.1(11)AX
|
This command was first introduced.
|
Usage Guidelines
Expressions are case sensitive. For example, if you enter | exclude output, the lines that contain output are not displayed, but the lines that contain Output are displayed.
Examples
This is an example of output from the show interfaces command for Gigabit Ethernet interface 3 on stack member 3:
Switch# show interfaces gigabitethernet 3/0/3
GigabitEthernet3/0/3 is down, line protocol is down
Hardware is Gigabit Ethernet, address is 0009.43a7.d085 (bia 0009.43a7.d085)
MTU 1500 bytes, BW 10000 Kbit, DLY 1000 usec,
reliability 255/255, txload 1/255, rxload 1/255
Encapsulation ARPA, loopback not set
input flow-control is off, output flow-control is off
ARP type: ARPA, ARP Timeout 04:00:00 Last input never, output never, output hang never
Last clearing of "show interface" counters never
Input queue: 0/75/0/0 (size/max/drops/flushes); Total output drops: 0
Output queue :0/40 (size/max)
5 minute input rate 0 bits/sec, 0 packets/sec
5 minute output rate 0 bits/sec, 0 packets/sec
2 packets input, 1040 bytes, 0 no buffer
Received 0 broadcasts, 0 runts, 0 giants, 0 throttles
0 input errors, 0 CRC, 0 frame, 0 overrun, 0 ignored
0 watchdog, 0 multicast, 0 pause input
0 input packets with dribble condition detected
4 packets output, 1040 bytes, 0 underruns
0 output errors, 0 collisions, 3 interface resets
0 babbles, 0 late collision, 0 deferred
0 lost carrier, 0 no carrier, 0 PAUSE output
0 output buffer failures, 0 output buffers swapped out
This is an example of output from the show interfaces accounting command.
Switch# show interfaces accounting
Protocol Pkts In Chars In Pkts Out Chars Out
IP 1094395 131900022 559555 84077157
Spanning Tree 283896 17033760 42 2520
ARP 63738 3825680 231 13860
Interface Vlan2 is disabled
Protocol Pkts In Chars In Pkts Out Chars Out
No traffic sent or received on this interface.
Protocol Pkts In Chars In Pkts Out Chars Out
No traffic sent or received on this interface.
Protocol Pkts In Chars In Pkts Out Chars Out
No traffic sent or received on this interface.
Protocol Pkts In Chars In Pkts Out Chars Out
No traffic sent or received on this interface.
Protocol Pkts In Chars In Pkts Out Chars Out
No traffic sent or received on this interface.
This is an example of output from the show interfaces gigabitethernet 1/0/4 description command when the interface has been described as Connects to Marketing by using the description interface configuration command.
Switch# show interfaces gigabitethernet1/0/4 description
Interface Status Protocol Description
Gi1/0/4 up down Connects to Marketing
This is an example of output from the show interfaces etherchannel command when port channels are configured on the switch:
Switch# show interfaces etherchannel
Age of the Port-channel = 03d:20h:17m:29s
Logical slot/port = 10/1 Number of ports = 0
GC = 0x00000000 HotStandBy port = null
Port state = Port-channel Ag-Not-Inuse
Age of the Port-channel = 03d:20h:17m:29s
Logical slot/port = 10/2 Number of ports = 0
GC = 0x00000000 HotStandBy port = null
Port state = Port-channel Ag-Not-Inuse
Age of the Port-channel = 03d:20h:17m:29s
Logical slot/port = 10/3 Number of ports = 0
GC = 0x00000000 HotStandBy port = null
Port state = Port-channel Ag-Not-Inuse
This is an example of output from the show interfaces gigabitethernet1/0/6 pruning command when pruning is enabled in the VTP domain:
Switch# show interfaces gigibitethernet1/0/6 pruning
Port Vlans pruned for lack of request by neighbor
Port Vlans traffic requested of neighbor
This is an example of output from the show interfaces stats command for a specified interface.
Switch# show interfaces vlan 1 stats
Switching path Pkts In Chars In Pkts Out Chars Out
Processor 1165354 136205310 570800 91731594
Total 1165354 136205310 570800 91731594
This is an example of partial output from the show interfaces status command. It displays the status of all interfaces.
Switch# show interfaces status
Port Name Status Vlan Duplex Speed Type
Fa1/0/1 notconnect 1 auto auto 10/100BaseTX
Fa1/0/2 notconnect 1 auto auto 10/100BaseTX
Fa1/0/3 notconnect 1 auto auto 10/100BaseTX
Fa1/0/4 Test notconnect 1 auto auto 10/100BaseTX
Fa1/0/5 notconnect 1 auto auto 10/100BaseTX
This is an example of output from the show interfaces status err-disabled command. It displays the status of interfaces in the error-disabled state.
Switch# show interfaces status err-disabled
Gi2/0/26 err-disabled gbic-invalid
This is an example of output from the show interfaces switchport command for a single interface. Table 2-16 describes the fields in the display.
Note
Private VLANs are not supported in this release, so those fields are not applicable.
Switch# show interfaces gigabitethernet 1/0/3 switchport
Administrative Mode: dynamic desirable
Administrative Trunking Encapsulation: negotiate
Negotiation of Trunking: On
Access Mode VLAN: 1 (default)
Trunking Native Mode VLAN: 1 (default)
Administrative private-vlan host-association: none
Administrative private-vlan mapping: none
Operational private-vlan: none
Trunking VLANs Enabled: ALL
Pruning VLANs Enabled: 2-1001
Unknown unicast blocked: disabled
Unknown multicast blocked: disabled
Voice VLAN: none (Inactive)
Table 2-16 show interfaces switchport Field Descriptions
Field
|
Description
|
Name
|
Displays the port name.
|
Switchport
|
Displays the administrative and operational status of the port. In this display, the port is in switchport mode.
|
Administrative Mode
Operational Mode
|
Displays the administrative and operational modes.
|
Administrative Trunking Encapsulation
Operational Trunking Encapsulation
Negotiation of Trunking
|
Displays the administrative and operational encapsulation method and whether trunking negotiation is enabled.
|
Access Mode VLAN
|
Displays the VLAN ID to which the port is configured.
|
Trunking Native Mode VLAN
Trunking VLANs Enabled
Trunking VLANs Active
|
Lists the VLAN ID of the trunk that is in native mode. Lists the allowed VLANs on the trunk. Lists the active VLANs on the trunk.
|
Pruning VLANs Enabled
|
Lists the VLANs that are pruning-eligible.
|
Protected
|
Displays whether or not protected port is enabled (True) or disabled (False) on the interface.
|
Unknown unicast blocked
Unknown multicast blocked
|
Displays whether or not unknown multicast and unknown unicast traffic is blocked on the interface.
|
Voice VLAN
|
Displays the VLAN ID on which voice VLAN is enabled.
|
Appliance trust
|
Displays the CoS setting of the data packets of the IP phone.
|
This is an example of output from the show interfaces interface trunk command. It displays trunking information for the interface.
Switch# show interfaces fastethernet 1/0/47 trunk
Port Mode Encapsulation Status Native vlan
Fa1/0/47 desirable n-isl trunking 1
Port Vlans allowed on trunk
Port Vlans allowed and active in management domain
Fa1/0/47 1-4,20,34-36,38-55,57-58,66-67,100,139,200-201,1000
Port Vlans in spanning tree forwarding state and not pruned
Fa1/0/47 1-4,20,34-36,38-55,57-58,66-67,100,139,200-201,1000
Related Commands
Command
|
Description
|
switchport access
|
Configures a port as a static-access or dynamic-access port.
|
switchport block
|
Blocks unknown unicast or multicast traffic on an interface.
|
switchport mode
|
Configures the VLAN membership mode of a port.
|
switchport protected
|
Isolates unicast, multicast, and broadcast traffic at Layer 2 from other protected ports on the same switch.
|
switchport trunk pruning
|
Configures the VLAN pruning-eligible list for ports in trunking mode.
|
show interfaces counters
Use the show interfaces counters privileged EXEC command to display various counters for the switch or for a specific interface.
show interfaces [interface-id | vlan vlan-id] counters [broadcast | errors | module switch- number
| multicast | trunk | unicast] [ | {begin | exclude | include} expression]
Syntax Description
interface-id
|
(Optional) ID of the physical interface, including type, stack member, module, and port number.
|
vlan vlan-id
|
(Optional) VLAN number of the management VLAN. The range is 1 to 4094.
|
broadcast
|
(Optional) Display discarded broadcast traffic.
|
errors
|
(Optional) Display error counters.
|
module switch- number
|
(Optional) Display counters for the specified stack member. The range is from 1 to 9, depending upon the switch numbers in the stack.
Note In this command, the module keyword refers to the stack member number (1-9). In other commands that contain an interface ID, the module number is always zero.
|
multicast
|
(Optional) Display discarded multicast traffic.
|
trunk
|
(Optional) Display trunk counters.
|
unicast
|
(Optional) Display discarded unicast traffic.
|
| begin
|
(Optional) Display begins with the line that matches the expression.
|
| exclude
|
(Optional) Display excludes lines that match the expression.
|
| include
|
(Optional) Display includes lines that match the specified expression.
|
expression
|
Expression in the output to use as a reference point.
|
s
Command Modes
Privileged EXEC
Command History
Release
|
Modification
|
12.1(11)AX
|
This command was first introduced.
|
Usage Guidelines
If you do not enter any keywords, all counters for all interfaces are included.
Expressions are case sensitive. For example, if you enter | exclude output, the lines that contain output are not displayed, but the lines that contain Output are displayed.
Examples
This is an example of partial output from the show interfaces counters command. It displays all counters for the switch.
Switch# show interfaces counters
Port InOctets InUcastPkts InMcastPkts InBcastPkts
This is an example of partial output from the show interfaces counters broadcast command. It displays dropped broadcast traffic for all interfaces.
Switch# show interfaces counters broadcast
This is an example of partial output from the show interfaces counters module command for stack member 2. It displays all counters for the specified switch in the stack.
Switch# show interfaces counters module 2
Sauron#show interface counters
Port InOctets InUcastPkts InMcastPkts InBcastPkts
This is an example of output from the show interfaces counters trunk command. It displays trunk counters for all interfaces.
Switch# show interfaces counters trunk
Port TrunkFramesTx TrunkFramesRx WrongEncap
Related Commands
Command
|
Description
|
show interfaces
|
Displays additional interface characteristics.
|
show storm-control
|
Displays storm-control settings for an interface or all interfaces.
|
storm-control
|
Sets storm-control broadcast, multicast, and unicast suppression levels for an interface.
|
show ip igmp profile
Use the show ip igmp profile privileged EXEC command to view all configured Internet Group Management Protocol (IGMP) profiles or a specified IGMP profile.
show ip igmp profile [profile number] [ | {begin | exclude | include} expression]
Syntax Description
profile number
|
(Optional) The IGMP profile number to be displayed. The range is 1 to 4294967295. If no profile number is entered, all IGMP profiles are displayed.
|
| begin
|
(Optional) Display begins with the line that matches the expression.
|
| exclude
|
(Optional) Display excludes lines that match the expression.
|
| include
|
(Optional) Display includes lines that match the specified expression.
|
expression
|
Expression in the output to use as a reference point.
|
Command Modes
Privileged EXEC
Command History
Release
|
Modification
|
12.1(11)AX
|
This command was first introduced.
|
Usage Guidelines
Expressions are case sensitive. For example, if you enter | exclude output, the lines that contain output are not displayed, but the lines that contain Output are displayed.
Examples
These are examples of output from the show ip igmp profile privileged EXEC command, with and without specifying a profile number. If no profile number is entered, the display includes all profiles configured on the switch.
Switch# show ip igmp profile 40
range 233.1.1.1 233.255.255.255
Switch# show ip igmp profile
range 230.9.9.0 230.9.9.0
range 229.9.9.0 229.255.255.255
Related Commands
Command
|
Description
|
ip igmp profile
|
Configures the specified IGMP profile number.
|
show ip igmp snooping
Use the show ip igmp snooping privileged EXEC command to display the Internet Group Management Protocol (IGMP) snooping configuration of the switch or the VLAN.
show ip igmp snooping [mrouter] [multicast] [vlan vlan-id] [ | {begin | exclude | include}
expression]
Syntax Description
mrouter
|
(Optional) See the show ip igmp snooping mrouter command.
|
multicast
|
(Optional) See the show ip igmp snooping multicast command.
|
vlan vlan-id
|
(Optional) Specify a VLAN; the range is 1 to 4094.
|
| begin
|
(Optional) Display begins with the line that matches the expression.
|
| exclude
|
(Optional) Display excludes lines that match the expression.
|
| include
|
(Optional) Display includes lines that match the specified expression.
|
expression
|
Expression in the output to use as a reference point.
|
Command Modes
Privileged EXEC
Command History
Release
|
Modification
|
12.1(11)AX
|
This command was first introduced.
|
Usage Guidelines
Use this command to display snooping configuration for the switch or for a specific VLAN.
Expressions are case sensitive. For example, if you enter | exclude output, the lines that contain output are not displayed, but the lines that contain Output are displayed.
Examples
This is an example of output from the show ip igmp snooping command. It shows how to display snooping characteristics for all VLANs on the switch.
Switch# show ip igmp snooping
IGMP snooping is globally enabled
IGMP snooping is enabled on this Vlan
IGMP snooping immediate-leave is disabled on this Vlan
IGMP snooping mrouter learn mode is pim-dvmrp on this Vlan
IGMP snooping is running in IGMP_ONLY mode on this Vlan
IGMP snooping is globally enabled
IGMP snooping is enabled on this Vlan
IGMP snooping immediate-leave is disabled on this Vlan
IGMP snooping mrouter learn mode is pim-dvmrp on this Vlan
IGMP snooping is running in IGMP_ONLY mode on this Vlan
This is an example of output from the show ip igmp snooping vlan 1 command. It shows how to display snooping characteristics for a specific VLAN.
Switch# show ip igmp snooping vlan 1
IGMP snooping is globally enabled
IGMP snooping is enabled on this Vlan
IGMP snooping immediate-leave is disabled on this Vlan
IGMP snooping mrouter learn mode is pim-dvmrp on this Vlan
IGMP snooping is running in IGMP_ONLY mode on this Vlan
Related Commands
show ip igmp snooping mrouter
Use the show ip igmp snooping mrouter privileged EXEC command to display the Internet Group Management Protocol (IGMP) snooping dynamically learned and manually configured multicast router ports for the switch or for the specified multicast VLAN.
show ip igmp snooping mrouter [vlan vlan-id] [ | {begin | exclude | include} expression]
Syntax Description
vlan vlan-id
|
(Optional) Specify a VLAN; the range is 1 to 4094.
|
| begin
|
(Optional) Display begins with the line that matches the expression.
|
| exclude
|
(Optional) Display excludes lines that match the expression.
|
| include
|
(Optional) Display includes lines that match the specified expression.
|
expression
|
Expression in the output to use as a reference point.
|
Command Modes
Privileged EXEC
Command History
Release
|
Modification
|
12/1(11)AX
|
This command was first introduced.
|
Usage Guidelines
Use this command to display multicast router ports on the switch or for a specific VLAN.
When multicast VLAN registration (MVR) is enabled, the show ip igmp snooping mrouter command displays MVR multicast router information and IGMP snooping information.
Expressions are case sensitive. For example, if you enter | exclude output, the lines that contain output are not displayed, but the lines that contain Output are displayed.
Examples
This is an example of output from the show ip igmp snooping mrouter command. It shows how to display multicast router ports on the switch.
Switch# show ip igmp snooping mrouter
Related Commands
show ip igmp snooping multicast
Use the show ip igmp snooping multicast privileged EXEC command to display the Internet Group Management Protocol (IGMP) snooping multicast table for the switch or multicast information for the selected parameter. Use with the vlan keyword to display the multicast table for a specified multicast VLAN or information about the selected parameter for the VLAN.
show ip igmp snooping multicast [vlan vlan-id] [count | dynamic [count | group ip_address] |
group ip_address | user [count | group ip_address]] [ | {begin | exclude | include} expression]
Syntax Description
vlan vlan-id
|
(Optional) Specify a VLAN; the range is 1 to 4094.
|
count
|
(Optional) Display the total number of entries for the specified command
options instead of the actual entries.
|
dynamic
|
(Optional) Display entries learned through IGMP snooping.
|
group ip_address
|
(Optional) Display characteristics of the multicast group with the specified group IP address.
|
user
|
(Optional) Display only the user-configured multicast entries.
|
| begin
|
(Optional) Display begins with the line that matches the expression.
|
| exclude
|
(Optional) Display excludes lines that match the expression.
|
| include
|
(Optional) Display includes lines that match the specified expression.
|
expression
|
Expression in the output to use as a reference point.
|
Command Modes
Privileged EXEC
Command History
Release
|
Modification
|
12.1(11)AX
|
This command was first introduced.
|
Usage Guidelines
Use this command to display multicast information and the multicast table for specified parameters.
Expressions are case sensitive. For example, if you enter | exclude output, the lines that contain output are not displayed, but the lines that contain Output are displayed.
Examples
This is an example of output from the show ip igmp snooping multicast command without any keywords. It displays the multicast table for the switch.
Switch# show ip igmp snooping multicast
Vlan Group Address Type Ports
---- ------------- ---- -----
1 224.1.2.30 IGMP Fa3/0/31, Fa4/0/1
1 224.1.2.1 IGMP Fa3/0/31, Fa4/0/1
1 224.4.4.4 USER Fa1/0/4, Fa4/0/1
This is an example of output from the show ip igmp snooping multicast count command. It displays the total number of multicast groups on the switch.
Switch# show ip igmp snooping multicast count
Total number of multicast groups: 3
This is an example of output from the show ip igmp snooping multicast dynamic command. It shows only the entries learned through IGMP snooping.
Switch# show ip igmp snooping multicast dynamic
Vlan Group Address Type Ports
---- ------------- ---- -----
1 224.1.2.30 IGMP Fa4/0/1, Fa4/0/37
1 224.1.2.1 IGMP Fa4/0/1, Fa4/0/37
This is an example of output from the show ip igmp snooping multicast group command. It shows the entries for the group with the specified IP address.
Switch# show ip igmp snooping multicast group 224.1.2.30
Vlan Group Address Type Ports
---- ------------- ---- -----
1 224.1.2.30 IGMP Fa4/0/1, Fa4/0/37
This is an example of output from the show ip igmp snooping multicast vlan command. It displays all entries belonging to the specified VLAN.
Switch# show ip igmp snooping multicast vlan 1
Vlan Group Address Type Ports
---- ------------- ---- -----
1 224.1.2.30 IGMP Fa4/0/1, Fa4/0/37
1 224.1.2.1 IGMP Fa4/0/1, Fa4/0/37
Related Commands
show mac-address-table
Use the show mac-address-table user EXEC command to display a specific MAC address table static and dynamic entry or the MAC address table static and dynamic entries on a specific interface or VLAN.
show mac-address-table [ | {begin | exclude | include} expression]
Syntax Description
| begin
|
(Optional) Display begins with the line that matches the expression.
|
| exclude
|
(Optional) Display excludes lines that match the expression.
|
| include
|
(Optional) Display includes lines that match the specified expression.
|
expression
|
Expression in the output to use as a reference point.
|
Command Modes
User EXEC
Command History
Release
|
Modification
|
12.1(11)AX
|
This command was first introduced.
|
Usage Guidelines
Expressions are case sensitive. For example, if you enter | exclude output, the lines that contain output are not displayed, but the lines that contain Output are displayed.
Examples
This is an example of output from the show mac-address-table command:
Switch> show mac-address-table
------------------------------------------
Vlan Mac Address Type Ports
---- ----------- ---- -----
All 0000.0000.0001 STATIC CPU
All 0000.0000.0002 STATIC CPU
All 0000.0000.0003 STATIC CPU
All 0000.0000.0009 STATIC CPU
All 0000.0000.0012 STATIC CPU
All 0180.c200.000b STATIC CPU
All 0180.c200.000c STATIC CPU
All 0180.c200.000d STATIC CPU
All 0180.c200.000e STATIC CPU
All 0180.c200.000f STATIC CPU
All 0180.c200.0010 STATIC CPU
1 0030.9441.6327 DYNAMIC Gi6/0/23
Total Mac Addresses for this criterion: 12
Related Commands
show mac-address-table address
Use the show mac-address-table address user EXEC command to display MAC address table information for the specified MAC address.
show mac-address-table address mac-address [interface interface-id] [vlan vlan-id] [ | {begin |
exclude | include} expression]
Syntax Description
mac-address
|
Specify the 48-bit MAC address; the valid format is H.H.H.
|
interface interface-id
|
(Optional) Display information for a specific interface. Valid interfaces include physical ports and port channels.
|
vlan vlan-id
|
(Optional) Display entries for the specific VLAN only. The range is 1 to 4094.
|
| begin
|
(Optional) Display begins with the line that matches the expression.
|
| exclude
|
(Optional) Display excludes lines that match the expression.
|
| include
|
(Optional) Display includes lines that match the specified expression.
|
expression
|
Expression in the output to use as a reference point.
|
Command Modes
User EXEC
Command History
Release
|
Modification
|
12.1(11)AX
|
This command was first introduced.
|
Usage Guidelines
Expressions are case sensitive. For example, if you enter | exclude output, the lines that contain output are not displayed, but the lines that contain Output are displayed.
Examples
This is an example of output from the show mac-address-table address command:
Switch# show mac-address-table address 0002.4b28.c482
------------------------------------------
Vlan Mac Address Type Ports
---- ----------- ---- -----
All 0002.4b28.c482 STATIC CPU
Total Mac Addresses for this criterion: 1
Related Commands
show mac-address-table aging-time
Use the show mac-address-table aging-time user EXEC command to display the aging time of a specific address table instance, all address table instances on a specified VLAN or, if a specific VLAN is not specified, on all VLANs.
show mac-address-table aging-time [vlan vlan-id] [ | {begin | exclude | include} expression]
Syntax Description
vlan vlan-id
|
(Optional) Display aging time information for a specific VLAN. The range is 1 to 4094.
|
| begin
|
(Optional) Display begins with the line that matches the expression.
|
| exclude
|
(Optional) Display excludes lines that match the expression.
|
| include
|
(Optional) Display includes lines that match the specified expression.
|
expression
|
Expression in the output to use as a reference point.
|
Command Modes
User EXEC
Command History
Release
|
Modification
|
12.1(11)AX
|
This command was first introduced.
|
Usage Guidelines
If no VLAN number is specified, then the aging time for all VLANs is displayed.
Expressions are case sensitive. For example, if you enter | exclude output, the lines that contain output are not displayed, but the lines that contain Output are displayed.
Examples
This is an example of output from the show mac-address-table aging-time command:
Switch> show mac-address-table aging-time
This is an example of output from the show mac-address-table aging-time vlan 10 command:
Switch> show mac-address-table aging-time vlan 10
Related Commands
show mac-address-table count
Use the show mac-address-table count user EXEC command to display the number of addresses present in all VLANs or the specified VLAN.
show mac-address-table count [vlan vlan-id] [ | {begin | exclude | include} expression]
Syntax Description
vlan vlan-id
|
(Optional) Display the number of addresses for a specific VLAN. The range is 1 to 4094.
|
| begin
|
(Optional) Display begins with the line that matches the expression.
|
| exclude
|
(Optional) Display excludes lines that match the expression.
|
| include
|
(Optional) Display includes lines that match the specified expression.
|
expression
|
Expression in the output to use as a reference point.
|
Command Modes
User EXEC
Command History
Release
|
Modification
|
12.1(11)AX
|
This command was first introduced.
|
Usage Guidelines
If no VLAN number is specified, the address count for all VLANs is displayed.
Expressions are case sensitive. For example, if you enter | exclude output, the lines that contain output are not displayed, but the lines that contain Output are displayed.
Examples
This is an example of output from the show mac-address-table count command:
Switch# show mac-address-table count
---------------------------
Dynamic Address Count : 2
Related Commands
show mac-address-table dynamic
Use the show mac-address-table dynamic user EXEC command to display only dynamic MAC address table entries.
show mac-address-table dynamic [address mac-address] [interface interface-id] [vlan vlan-id]
[ | {begin | exclude | include} expression]
Syntax Description
address mac-address
|
(Optional) Specify a 48-bit MAC address; the valid format is H.H.H (available in privileged EXEC mode only).
|
interface interface-id
|
(Optional) Specify an interface to match; valid interfaces include physical ports and port channels.
|
vlan vlan-id
|
(Optional) Display entries for a specific VLAN; the range is 1 to 4094.
|
| begin
|
(Optional) Display begins with the line that matches the expression.
|
| exclude
|
(Optional) Display excludes lines that match the expression.
|
| include
|
(Optional) Display includes lines that match the specified expression.
|
expression
|
Expression in the output to use as a reference point.
|
Command Modes
User EXEC; address keyword available only in privileged EXEC mode.
Command History
Release
|
Modification
|
12.1(11)AX
|
This command was first introduced.
|
Usage Guidelines
Expressions are case sensitive. For example, if you enter | exclude output, the lines that contain output are not displayed, but the lines that contain Output are displayed.
Examples
This is an example of output from the show mac-address-table dynamic command:
Switch> show mac-address-table dynamic
------------------------------------------
Vlan Mac Address Type Ports
---- ----------- ---- -----
1 0030.b635.7862 DYNAMIC Gi6/0/2
1 00b0.6496.2741 DYNAMIC Gi6/0/2
Total Mac Addresses for this criterion: 2
Related Commands
show mac-address-table interface
Use the show mac-address-table interface user command to display the MAC address table information for the specified interface in the specified VLAN.
show mac-address-table interface interface-id [vlan vlan-id] [ | {begin | exclude | include}
expression]
Syntax Description
interface-id
|
Specify an interface type; valid interfaces include physical ports and port channels.
|
vlan vlan-id
|
(Optional) Display entries for a specific VLAN; the range is 1 to 4094.
|
| begin
|
(Optional) Display begins with the line that matches the expression.
|
| exclude
|
(Optional) Display excludes lines that match the expression.
|
| include
|
(Optional) Display includes lines that match the specified expression.
|
expression
|
Expression in the output to use as a reference point.
|
Command Modes
User EXEC
Command History
Release
|
Modification
|
12.1(11)AX
|
This command was first introduced.
|
Usage Guidelines
Expressions are case sensitive. For example, if you enter | exclude output, the lines that contain output are not displayed, but the lines that contain Output are displayed.
Examples
This is an example of output from the show mac-address-table interface command:
Switch> show mac-address-table interface gigabitethernet6/0/2
------------------------------------------
Vlan Mac Address Type Ports
---- ----------- ---- -----
1 0030.b635.7862 DYNAMIC Gi6/0/2
1 00b0.6496.2741 DYNAMIC Gi6/0/2
Total Mac Addresses for this criterion: 2
Related Commands
show mac-address-table multicast
Use the show mac-address-table multicast user EXEC command to display the Layer 2 multicast entries for all VLANs. Use the command in privileged EXEC mode to display specific multicast entries.
show mac-address-table multicast [vlan-id] [count | user [count]] [ | {begin | exclude | include}
expression]
Syntax Description
vlan vlan-id
|
(Optional) Display addresses for a specific VLAN. The range is 1 to 4094.
|
count
|
(Optional) Display the total number of entries for the specified command options instead of the actual entries.
|
user
|
(Optional) Display only the user-configured multicast entries.
|
| begin
|
(Optional) Display begins with the line that matches the expression.
|
| exclude
|
(Optional) Display excludes lines that match the expression.
|
| include
|
(Optional) Display includes lines that match the specified expression.
|
expression
|
Expression in the output to use as a reference point.
|
Note
Though visible in the command-line help string, the igmp-snooping keyword is not supported. Use the show ip igmp snooping multicast privileged EXEC command to display the Internet Group Management Protocol (IGMP) snooping multicast table.
Command Modes
User EXEC
Command History
Release
|
Modification
|
12.1(11)AX
|
This command was first introduced.
|
Usage Guidelines
Expressions are case sensitive. For example, if you enter | exclude output, the lines that contain output are not displayed, but the lines that contain Output are displayed.
Examples
This is an example of output from the show mac-address-table multicast command. It shows how to display all multicast entries for the switch.
Switch> show mac-address-table multicast
Vlan Mac Address Type Ports
---- ----------- ---- -----
1 0100.5e00.0128 IGMP Gi1/0/1
This is an example of output from the show mac-address-table multicast count command. It shows how to display a total count of MAC address entries for the switch.
Switch> show mac-address-table multicast count
Multicast MAC Entries for all vlans: 10
This is an example of output from the show mac-address-table multicast vlan 1 count command. It shows how to display a total count of MAC address entries for a VLAN.
Switch> show mac-address-table multicast vlan 1 count
Multicast MAC Entries for vlan 1: 4
Related Commands
show mac-address-table notification
Use the show mac-address-table notification user EXEC command to display the MAC address notification settings for all interfaces or the specified interface.
show mac-address-table notification [interface [interface-id] [ | {begin | exclude | include}
expression]
Syntax Description
interface
|
(Optional) Display information for all interfaces. Valid interfaces include physical ports and port channels.
|
interface-id
|
(Optional) Display information for the specified interface. Valid interfaces include physical ports and port channels.
|
| begin
|
(Optional) Display begins with the line that matches the expression.
|
| exclude
|
(Optional) Display excludes lines that match the expression.
|
| include
|
(Optional) Display includes lines that match the specified expression.
|
expression
|
Expression in the output to use as a reference point.
|
Command Modes
User EXEC
Command History
Release
|
Modification
|
12.1(8)AX
|
This command was first introduced.
|
Usage Guidelines
Use the show mac-address-table notification command without any keywords to display whether the feature is enabled or disabled, the MAC notification interval, the maximum number of entries allowed in the history table, and the history table contents.
Use the interface keyword to display the flags for all interfaces. If the interface-id is included, only the flags for that interface are displayed.
Expressions are case sensitive. For example, if you enter | exclude output, the lines that contain output are not displayed, but the lines that contain Output are displayed.
Examples
This is an example of output from the show mac-address-table notification command:
Switch> show mac-address-table notification
MAC Notification Feature is Enabled on the switch
Interval between Notification Traps : 60 secs
Number of MAC Addresses Added : 4
Number of MAC Addresses Removed : 4
Number of Notifications sent to NMS : 3
Maximum Number of entries configured in History Table : 100
Current History Table Length : 3
MAC Notification Traps are Enabled
History Index 0, Entry Timestamp 1032254, Despatch Timestamp 1032254
Operation: Added Vlan: 2 MAC Addr: 0000.0000.0001 Module: 0 Port: 1
History Index 1, Entry Timestamp 1038254, Despatch Timestamp 1038254
Operation: Added Vlan: 2 MAC Addr: 0000.0000.0000 Module: 0 Port: 1
Operation: Added Vlan: 2 MAC Addr: 0000.0000.0002 Module: 0 Port: 1
Operation: Added Vlan: 2 MAC Addr: 0000.0000.0003 Module: 0 Port: 1
History Index 2, Entry Timestamp 1074254, Despatch Timestamp 1074254
Operation: Deleted Vlan: 2 MAC Addr: 0000.0000.0000 Module: 0 Port: 1
Operation: Deleted Vlan: 2 MAC Addr: 0000.0000.0001 Module: 0 Port: 1
Operation: Deleted Vlan: 2 MAC Addr: 0000.0000.0002 Module: 0 Port: 1
Operation: Deleted Vlan: 2 MAC Addr: 0000.0000.0003 Module: 0 Port: 1
Related Commands
show mac-address-table static
Use the show mac-address-table static user EXEC command to display static MAC address table entries only.
show mac-address-table static [address mac-address] [interface interface-id] [vlan vlan-id]
[ | {begin | exclude | include} expression]
Syntax Description
address mac-address
|
(Optional) Specify a 48-bit MAC address; the valid format is H.H.H (available in privileged EXEC mode only).
|
interface interface-id
|
(Optional) Specify an interface to match; valid interfaces include physical ports and port channels.
|
vlan vlan-id
|
(Optional) Display addresses for a specific VLAN. The range is 1 to 4094.
|
| begin
|
(Optional) Display begins with the line that matches the expression.
|
| exclude
|
(Optional) Display excludes lines that match the expression.
|
| include
|
(Optional) Display includes lines that match the specified expression.
|
expression
|
Expression in the output to use as a reference point.
|
Command Modes
User EXEC; address keyword available only in privileged EXEC mode.
Command History
Release
|
Modification
|
12.1(11)AX
|
This command was first introduced.
|
Usage Guidelines
Expressions are case sensitive. For example, if you enter | exclude output, the lines that contain output are not displayed, but the lines that contain Output are displayed.
Examples
This is an example of output from the show mac-address-table static command:
Switch> show mac-address-table static
------------------------------------------
Vlan Mac Address Type Ports
---- ----------- ---- -----
All 0100.0ccc.cccc STATIC CPU
All 0180.c200.0000 STATIC CPU
All 0100.0ccc.cccd STATIC CPU
All 0180.c200.0001 STATIC CPU
All 0180.c200.0002 STATIC CPU
All 0180.c200.0003 STATIC CPU
All 0180.c200.0004 STATIC CPU
All 0180.c200.0005 STATIC CPU
All 0180.c200.0006 STATIC CPU
All 0180.c200.0007 STATIC CPU
Total Mac Addresses for this criterion: 10
Related Commands
show mac-address-table vlan
Use the show mac-address-table vlan user EXEC command to display the MAC address table information for the specified VLAN.
show mac-address-table vlan vlan-id [ | {begin | exclude | include} expression]
Syntax Description
vlan-id
|
(Optional) Display addresses for a specific VLAN. The range is 1 to 4094.
|
| begin
|
(Optional) Display begins with the line that matches the expression.
|
| exclude
|
(Optional) Display excludes lines that match the expression.
|
| include
|
(Optional) Display includes lines that match the specified expression.
|
expression
|
Expression in the output to use as a reference point.
|
Command Modes
User EXEC
Command History
Release
|
Modification
|
12.1(11)AX
|
This command was first introduced.
|
Usage Guidelines
Expressions are case sensitive. For example, if you enter | exclude output, the lines that contain output are not displayed, but the lines that contain Output are displayed.
Examples
This is an example of output from the show mac-address-table vlan 1 command:
Switch> show mac-address-table vlan 1
------------------------------------------
Vlan Mac Address Type Ports
---- ----------- ---- -----
1 0100.0ccc.cccc STATIC CPU
1 0180.c200.0000 STATIC CPU
1 0100.0ccc.cccd STATIC CPU
1 0180.c200.0001 STATIC CPU
1 0180.c200.0002 STATIC CPU
1 0180.c200.0003 STATIC CPU
1 0180.c200.0004 STATIC CPU
1 0180.c200.0005 STATIC CPU
1 0180.c200.0006 STATIC CPU
1 0180.c200.0007 STATIC CPU
Total Mac Addresses for this criterion: 10
Related Commands
show mls qos
Use the show mls qos user EXEC command to display global quality of service (QoS) configuration information.
show mls qos [ | {begin | exclude | include} expression]
Syntax Description
| begin
|
(Optional) Display begins with the line that matches the expression.
|
| exclude
|
(Optional) Display excludes lines that match the expression.
|
| include
|
(Optional) Display includes lines that match the specified expression.
|
expression
|
Expression in the output to use as a reference point.
|
Command Modes
User EXEC
Command History
Release
|
Modification
|
12.1(11)AX
|
This command was first introduced.
|
Usage Guidelines
Expressions are case sensitive. For example, if you enter | exclude output, the lines that contain output are not displayed, but the lines that contain Output are displayed.
Examples
This is an example of output from the show mls qos command:
Related Commands
Command
|
Description
|
mls qos
|
Enables quality of service (QoS) for the entire switch.
|
show mls qos aggregate-policer
Use the show mls qos aggregate-policer user EXEC command to display the quality of service (QoS) aggregate policer configuration. A policer defines a maximum permissible rate of transmission, a maximum burst size for transmissions, and an action to take if either maximum is exceeded.
show mls qos aggregate-policer [aggregate-policer-name] [ | {begin | exclude | include}
expression]
Syntax Description
aggregate-policer-name
|
(Optional) Display the policer configuration for the specified name.
|
| begin
|
(Optional) Display begins with the line that matches the expression.
|
| exclude
|
(Optional) Display excludes lines that match the expression.
|
| include
|
(Optional) Display includes lines that match the specified expression.
|
expression
|
Expression in the output to use as a reference point.
|
Command Modes
User EXEC
Command History
Release
|
Modification
|
12.1(11)AX
|
This command was first introduced.
|
Usage Guidelines
Expressions are case sensitive. For example, if you enter | exclude output, the lines that contain output are not displayed, but the lines that contain Output are displayed.
Examples
This is an example of output from the show mls qos aggregate-policer command:
Switch> show mls qos aggregate-policer policer1
aggregate-policer policer1 88000 2000000 exceed-action drop
Not used by any policy map
Related Commands
Command
|
Description
|
mls qos aggregate-policer
|
Defines policer parameters that can be shared by multiple classes within a policy map.
|
show mls qos input-queue
Use the show mls qos input-queue user EXEC command to display quality of service (QoS) settings for the ingress queues.
show mls qos input-queue [ | {begin | exclude | include} expression]
Syntax Description
| begin
|
(Optional) Display begins with the line that matches the expression.
|
| exclude
|
(Optional) Display excludes lines that match the expression.
|
| include
|
(Optional) Display includes lines that match the specified expression.
|
expression
|
Expression in the output to use as a reference point.
|
Command Modes
User EXEC
Command History
Release
|
Modification
|
12.1(11)AX
|
This command was first introduced.
|
Usage Guidelines
Expressions are case sensitive. For example, if you enter | exclude output, the lines that contain output are not displayed, but the lines that contain Output are displayed.
Examples
This is an example of output from the show mls qos input-queue command:
Switch> show mls qos input-queue
----------------------------------------------
Related Commands
show mls qos interface
Use the show mls qos interface user EXEC command to display quality of service (QoS) information at the interface level.
show mls qos interface [interface-id] [buffers | queueing | statistics]
[ | {begin | exclude | include} expression]
Syntax Description
interface-id
|
(Optional) Display QoS information for the specified interface. Valid interfaces include physical ports.
|
buffers
|
(Optional) Display the buffer allocation among the queues.
|
queueing
|
(Optional) Display the queueing strategy (shared or shaped) and the weights corresponding to the queues.
|
statistics
|
(Optional) Display statistics for sent and received Differentiated Services Code Points (DSCPs) and class of service (CoS) values, the number of packets enqueued or dropped per egress queue, and the number of in-profile and out-of-profile packets for each policer.
|
| begin
|
(Optional) Display begins with the line that matches the expression.
|
| exclude
|
(Optional) Display excludes lines that match the expression.
|
| include
|
(Optional) Display includes lines that match the specified expression.
|
expression
|
Expression in the output to use as a reference point.
|
Note
Though visible in the command-line help string, the policers keyword is not supported.
Command Modes
User EXEC
Command History
Release
|
Modification
|
12.1(11)AX
|
This command was first introduced.
|
Usage Guidelines
Expressions are case sensitive. For example, if you enter | exclude output, the lines that contain output are not displayed, but the lines that contain Output are displayed.
Examples
This is an example of output from the show mls qos interface command:
Switch# show mls qos interface fastethernet1/0/7
Attached policy-map for Ingress: videowizard_policy
DSCP Mutation Map: Default DSCP Mutation Map
This is an example of output from the show mls qos interface fastethernet1/0/7 buffers command:
Switch> show mls qos interface fastethernet1/0/7 buffers
The port is mapped to qset : 1
The allocations between the queues are : 25 25 25 25
This is an example of output from the show mls qos interface fastethernet1/0/7 queueing command:
Switch> show mls qos interface fastethernet1/0/7 queueing
Shaped queue weights (absolute) : 25 0 0 0
Shared queue weights : 25 25 25 25
The port bandwidth is limited to: 100%
The port is mapped to qset : 1
This is an example of output from the show mls qos interface fastethernet1/0/7 statistics command. Table 2-17 describes the fields in this display.
Switch> show mls qos interface fastethernet1/0/7 statistics
-------------------------------
-------------------------------
-------------------------------
-------------------------------
Policer: Inprofile: 0 OutofProfile: 0
Table 2-17 show mls qos interface statistics Field Descriptions
Field
|
|
Description
|
DSCP
|
incoming
|
Number of received packets for each DSCP value.
|
| |
outgoing
|
Number of sent packets for each DSCP value.
|
CoS
|
incoming
|
Number of received packets for each CoS value.
|
| |
outgoing
|
Number of sent packets for each CoS value.
|
Policer
|
Inprofile
|
Number of in profile packets for each policer.
|
| |
Outofprofile
|
Number of out of profile packets for each policer.
|
Related Commands
show mls qos maps
Use the show mls qos maps user EXEC command to display quality of service (QoS) mapping information. During classification, QoS uses the mapping tables to represent the priority of the traffic and to derive a corresponding class of service (CoS) or Differentiated Services Code Point (DSCP) value from the received CoS, DSCP, or IP precedence value.
show mls qos maps [cos-dscp | cos-input-q | cos-output-q | dscp-cos | dscp-input-q |
dscp-mutation dscp-mutation-name | dscp-output-q | ip-prec-dscp | policed-dscp] [ | {begin
| exclude |