-
Cisco MDS 9000 Family Fabric Manager Configuration Guide, Release 1.3 (from Release 1.3(1) through Release 1.3(6))
-
Index
-
New and Changed Information
-
Preface
-
Product Overview
-
Getting Started with Cisco Fabric Manager
-
Overview of Fabric Manager Components
-
Before You Begin
-
Obtaining and Installing Licenses
-
Initial Configuration
-
Configuring High Availability
-
Software Images
-
Managing Modules
-
Managing System Hardware
-
Configuring and Managing VSANs
-
Configuring Interfaces
-
Configuring Trunking
-
Configuring PortChannels
-
Configuring and Managing Zones
-
Configuring Inter-VSAN Routing
-
Managing FLOGI, Name Server, FDMI, and RSCN Databases
-
Configuring Switch Security
-
Configuring Fabric Security
-
Configuring Port Security
-
Configuring Fibre Channel Routing Services and Protocols
-
Configuring IP Services
-
Configuring FICON
-
Configuring IP Storage
-
Configuring Call Home
-
Configuring Domain Parameters
-
Configuring Traffic Management
-
Configuring System Message Logging
-
Discovering SCSI Targets
-
Monitoring Network Traffic Using SPAN
-
Advanced Features and Concepts
-
Configuring Fabric Configuration Servers
-
Monitoring System Processes and Logs
-
Troubleshooting the Fabric
-
Troubleshooting Fabric Manager Issues
-
 Feedback
Table Of Contents
Launching Cisco Fabric Manager
Menu Bar, Toolbars, and Status Bar
Discovering and Viewing the Network Fabric
Controlling Administrator Access with Users and Roles
Setting Fabric Manager Preferences
Viewing Reports in Fabric Manager
Launching Device Manager from Fabric Manager
Comparing Device Manager to Fabric Manager
Setting Device Manager Preferences
Performance Manager Architecture
Creating a PM Configuration File
Integration with Cisco Traffic Analyzer
Configuring PM for Use with Cisco Traffic Analyzer
Exporting Data Collection to XML Files
Removing Data Collection Files from the List
Overview of Fabric Manager
This chapter contains descriptions of, and instructions for using, the Cisco MDS 9000 Fabric Manager.
This chapter contains the following topics:
•
Launching Cisco Fabric Manager
•
•
•
•
•
•
•
Launching Cisco Fabric Manager
When you click on the Fabric Manager icon, the dialog box allows you to enter the IP address of a computer running the FMServer component. If the server component is running on your local machine, leave "localhost" in that field. If you try to run Fabric Manager without specifying a valid server, you are prompted to start the FMServer.
On a Windows PC, you install the FMServer as a service. This service can then be administered using the Service Panel in the Control Panel. The default setting for the FMServer service is that the server is automatically started when the machine is rebooted. You can change this behavior by modifying the properties in the Service panel.
Note
Using Fabric Manager
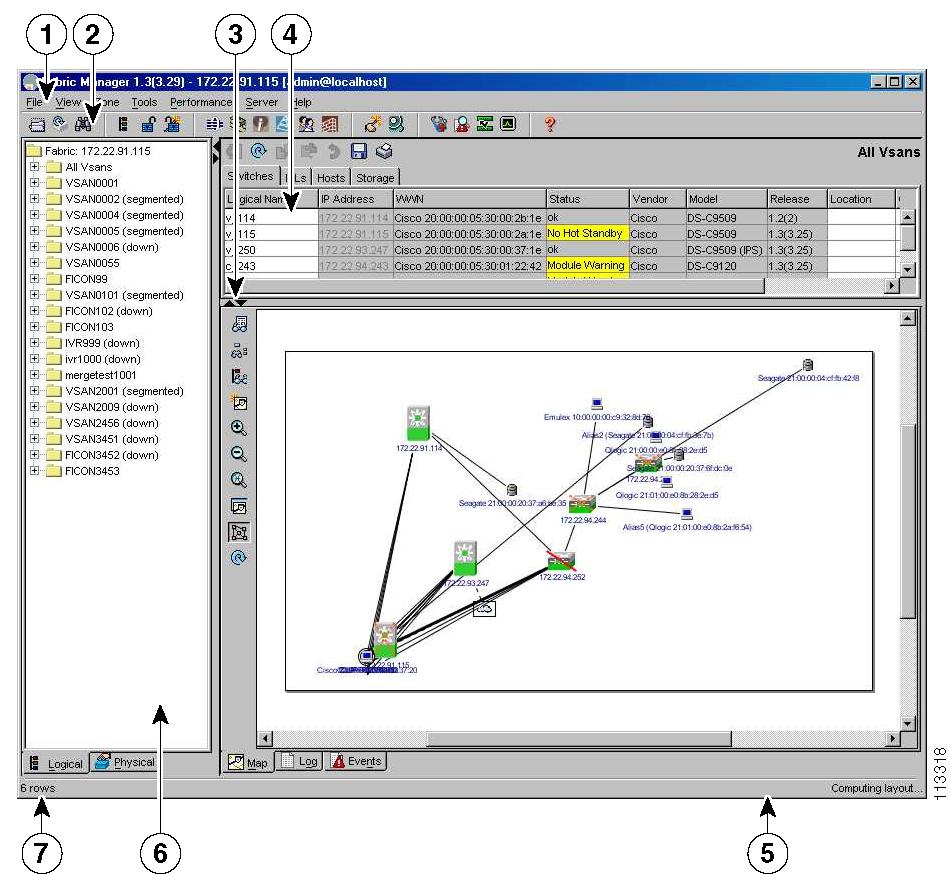
The Fabric Manager displays a view of your network fabric, including Cisco MDS 9000 and third-party switches and end devices. To launch the Fabric Manager from your desktop, double-click the Fabric Manager icon and follow the instructions described in the "Launching the Applications" section. The figure below shows the Fabric Manager main window.
Note
Figure 3-1 Fabric Manager Main Window
The menu bar at the top of the Fabric Manager window provides access to options, that are organized by menus (see Number 1, Figure 3-1). The toolbar provides icons that duplicate the most commonly used options on the File, Tools, and Help menus (see Number 2, Figure 3-1).
The main window has a menu bar, toolbar, message bar, status bar, and three panes:
•
•
•
You can resize each pane by dragging the boundaries between each region or by clicking the Minimize or Maximize controls.
Menu Bar, Toolbars, and Status Bar
The menu bar at the top of the Fabric Manager main window provides options for managing and troubleshooting the current fabric and for controlling the display of information on the Map pane. The menu bar provides the following menus:
•
•
•
•
•
•
•
The Fabric Manager main toolbar provides buttons for accessing the most commonly used menu bar options. The Map pane toolbar provides buttons for managing the appearance of the map. The Information pane toolbar provides buttons for editing and managing the Information pane.
The status bar shows the last entry displayed by the discovery process, and the possible error message on the right side. It displays a dialog stating that something has changed in the fabric and a new discovery is needed. The status bar shows both short-term, transient messages (such as the number of rows displayed in the table), and long-term discovery issues.
Logical/Physical Pane
Use the Logical tab on the Logical/Physical pane to manage virtual SAN attributes (e.g., zones) in the currently discovered fabric.
To manage zones, right-click one of the folders in the VSAN tree and click Edit Local Zone Database from the pop-up menu. You see the Edit Local Zone Database dialog box.
Use the Physical tab on the Logical/Physical pane to display a menu tree of the options available for managing the switches in the currently discovered fabric.
To select an option, click a folder to display the options available and then click the option. You see the dialog box for the selected option in the Information pane.
The Physical tree provides the following main folders:
•
•
•
•
•
•
•
Information Pane
The Information pane displays tables or other information associated with the option selected from the menu tree. The Information pane toolbar provides buttons for performing one or more of the following operations:
•
•
•
•
•
•
•
Note
Note
Map Pane
The Map pane shows the graphical representation of your fabric.Table 3-1 explains the graphics you may see displayed, depending on which devices you have in your fabric.
There are three tabs on the bottom of the Map pane:
•
•
•
When viewing large fabrics in the Map pane, it is helpful to:
•
•
•
•
When you right-click an icon, you see a pop-up menu with options that vary depending on the type of icon selected. The various options available for different objects include the following:
•
•
•
•
•
•
•
•
•
The Map pane has its own toolbar with options for saving, printing, and changing the appearance of the map. When you right-click on the map, a pop-up menu appears that provides options (duplicated on the toolbar) for changing the appearance of the map.
Note
Discovering and Viewing the Network Fabric
Cisco Fabric Manager collects information on the fabric topology through SNMP queries to the switches connected to Fabric Manager. The switch replies after having discovered all devices connected to the fabric by using the information coming from its FSPF technology database and the Name Server database, and collected using the Fabric Configuration Server's request/response mechanisms defined by the FC-GS3/4 standard. When you start the Fabric Manager, you enter the IP address (or host name) of a "seed" switch for discovery.
After you start Fabric Manager and discovery completes, Fabric Manager presents you with a view of your network fabric, including all discovered switches, hosts, and storage devices.
Controlling Administrator Access with Users and Roles
Cisco MDS 9000 Family switches support role-based management access whether using the CLI or the Cisco Fabric Manager. This lets you assign specific management privileges to particular roles and then assign one or more users to each role.
Cisco Fabric Manager uses SNMPv3 to establish role-based management access. After completing the setup routine, a single role, user name, and password are established. The role assigned to this user allows the highest level of privileges, which includes creating new users and roles. Use the Cisco Fabric Manager to create roles and users, and to assign passwords as required for secure management access in your network.
Modifying Device Grouping
Because of not all the devices are capable of responding to FC-GS3 requests, different ports of a single server or storage subsystem may be displayed as individual end devices on the Fabric Manager map.
To group end devices in a single enclosure in order to have them represented by a single icon on the map, follow these steps:
Step 1
The end devices appear in the Information pane.
Step 2
Step 3
Step 4
Step 5
Step 6
Note
Setting Fabric Manager Preferences
To set your preferences for the behavior of the Fabric Manager, choose File > Preferences from the Fabric Manager menu bar. The Preferences dialog box appears.
This dialog box has the following tabs, which let you set your preferences for different components of the application:
•
•
•
The default General preferences for Fabric Manager are:
•
•
•
•
•
•
•
•
The default SNMP preferences for Fabric Manager are:
•
•
•
•
The default Map preferences for Fabric Manager are:
•
•
•
•
•
•
•
•
•
•
Viewing Reports in Fabric Manager
The Fabric Manager provides a series of reports, showing various information in tabular form. When you select one of these options, you see the available information in tabular form in the Information pane of the Fabric Manager main window. The table below describes the reports provided by each option.
Table 3-2 Fabric Manager Reports
ISL Statistics
Click on Connectivity > ISLs > Statistics in the Physical tab of the Fabric Manager Logical/Physical pane to display information about the Inter-Switch Links in the currently discovered fabric. You can use the controls at the top of the table to change the Poll Interval and Scale parameters.
ISL
Choose Connectivity > ISLs in the Physical tab of the Fabric Manager Logical/Physical pane to display information about the Inter-Switch links in the currently discovered fabric.
Switches
Choose Switches in the Physical tab of the Fabric Manager Logical/Physical pane to display information about the switches in the currently discovered fabric.
Hosts
Choose Connectivity > Hosts in the Physical tab of the Fabric Manager Logical/Physical pane to display information about the hosts in the currently discovered fabric.
Storage
Choose Connectivity > Storage in the Physical tab of the Fabric Manager Logical/Physical pane to display information about the links to hosts and storage in the currently discovered fabric.
LUNs
Choose Connectivity > Storage > LUNs in the Physical tab of the Fabric Manager Logical/Physical pane to display information about the LUNs in the currently discovered fabric.
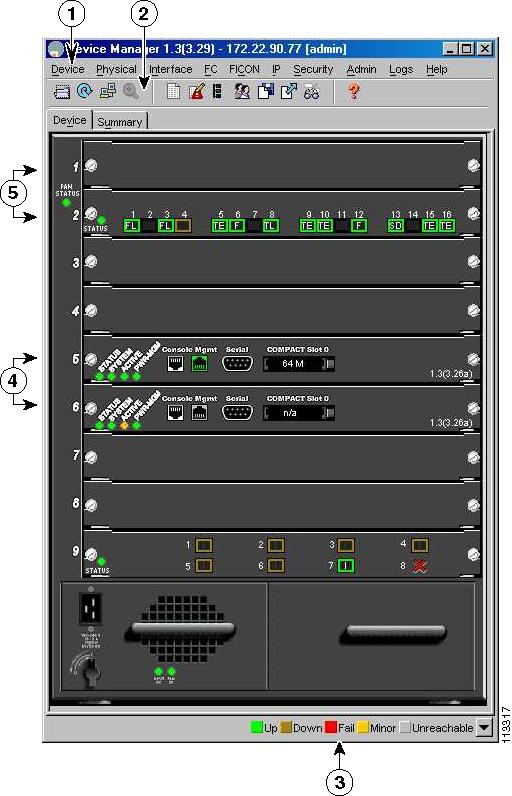
Using Device Manager
Device Manager provides a physical representation of your switch chassis, with the modules, ports, power supplies, and fan assemblies. The menu bar at the top of the Device Manager window provides access to options, organized into menus that correspond to the menu tree in Fabric Manager.
The legend at the bottom right of the Device Manager indicates port status, as follows:
•
•
•
•
Launching Device Manager from Fabric Manager
Device Manager gives a graphic representation of a Cisco MDS 9000 Family switch, including the installed switching modules, the supervisor modules, the power supplies, and the status of each port within each module.
To launch the Device Manager from your desktop, double-click the Device Manager icon and follow the instructions described in the "Launching the Applications" section.
To launch Device Manager from Fabric Manager, right-click the switch you want to manage on the Fabric Manager map and click Device Manager from the pop-up menu that appears. The Device Manager main window is shown below.
Device Manager can also be started by double-clicking on a switch in the Fabric Manager topology view, or by selecting a switch in the Fabric Manager Map page and choosing the Device Manager option from the Tools menu.
Figure 3-2 Device Manager, Device Tab
Using Summary View
Click the Summary tab on the Device Manager main window to see a summary of enabled interfaces on a single switch, as well as FC and IP neighbor devices. All logical interfaces are shown in a dropdown list at the top of the Summary view.
The Summary View displays attributes for a single switch, such as port speed, link utilization, and other traffic statistics. It has the same menu bar and toolbar buttons as the Device View.
To monitor traffic for selected objects, click the Monitor icon. To display detailed statistics for selected objects, click the Detailed Statistics icon.
The Summary View provides the same menus and options that are available from the Device View.
Note
Comparing Device Manager to Fabric Manager
The menu bar at the top of the Device Manager contains the same menus as the Fabric Manager menu tree.
For information about the options provided by these menus, see the "Logical/Physical Pane" section. The Device menu provides the following options:
•
•
•
•
•
•
The tables in the Fabric Manager roughly correspond to the dialog boxes that appear in Device Manager. However, the Fabric Manager tables show values for multiple switches and so the first column identifies the specific switch. The Device Manager dialog box shows values for a single switch, while the Fabric Manager shows the same values for one or more switches.
The toolbar on the Device Manager dialog box provides the same options as the toolbar on the Information pane in Fabric Manager, as summarized here:
•
•
•
•
•
•
•
•
Tip
When you click the Create button, you see a dialog box that lets you enter the values required for the specific table. As you can see the fields and options are the same from both views, but the appearance of the window may vary slightly. For instance, the dialog box from Fabric Manager may have an option for selecting a specific switch, while the dialog box from Device Manager may have additional port-level detail.
Performing Device Management
Most tasks that you can perform with Device Manager can also be performed for multiple switches using the Fabric Manager. However, Device Manager may be more convenient to use when you are working with a single switch. Also, the Device Manager provides more detailed information for verifying or troubleshooting device-specific configuration than what is available from the Fabric Manager.
The Device View provides a graphic representation of a Cisco MDS 9000 switch, including the installed switching modules, services modules, supervisor modules, and the status of each port within each module. You can use the Device View to perform any switch-level configuration tasks including the following:
•
•
•
•
•
•
•
Summary View provides a way of monitoring all of the ports on the switch, categorized by operative modes (Fx-Ports and E-Ports).
When you click the Summary tab on the Device Manager window, you see the Summary View, which provides summary information about the interfaces on a single switch.
Managing Ports
Tip
To enable or disable a port, right-click the port and click Enable or Disable from the pop-up menu. To enable or disable multiple ports, drag the mouse to select the ports and then right-click the selected ports. Then click Enable or Disable from the pop-up menu.
To manage trunking on one or more ports, right-click the ports and click Configure. On the dialog box that appears, in the Trunk column, right-click the current value and click nonTrunk, trunk, or auto from the pull-down list.
To create PortChannels using Device Manager, click PortChannels from the Interface menu. For detailed instructions, see the"About PortChanneling and Trunking" section. You can also use Fabric Manager to conveniently create a PortChannel.
Note
Setting Device Manager Preferences
From the Device menu, choose Preferences to set your preferences for the behavior of the Device Manager application.
Note
Using Performance Manager
Performance Manager monitors network device statistics historically, and provide this information graphically using a web browser. It presents recent statistics in detail and older statistics in summary. Performance Manager also integrates with external tools, such as Cisco Traffic Analyzer.
Performance Manager Architecture
The Performance Manager has three parts:
•
•
•
Creating a PM Configuration File
Performance Manager has a Configuration File Wizard, which steps you through the process of creating configuration files.
To create a configuration file, perform the following steps:
Step 1
Step 2
Step 3
Step 4
Step 5
Step 6
Step 7
Step 8
Note
Collecting the Data
One year's worth of data for two variables (Rx and Tx Bytes) requires an rrd file size of 76K. The default internal values are:
•
•
•
•
A 1000-port SAN requires 76MB for a year's worth of historical data. If there were 20 switches in this SAN with equal distribution of fabric ports, about 2-3 SNMP packets per switch would be sent every 5 minutes for a total of about 100 total request/response SNMP packets required to monitor the data.
Flows, because of their variable counter requests, are more difficult to predict. But as a rule of thumb, each extra variable adds another 38K.
The Performance Manager collector is designed to run as a background process on the various supported OSs. On Microsoft Windows, it runs as a service.
Presenting the Collected Data
The Summary page presents the top 10 Hosts, ISLs, Storage, and Flows by average throughput for the last 24 hour period. This period changes on every polling interval ñ this is unlikely to change the average significantly, but it could affect the maximum value. The intention is to provide a quick summary of the fabric's bandwidth consumption and highlight any hotspots.
•
•
•
Exporting and Importing Data
You can export an rrd file to XML with the command:
pm xport <rrdFile> <xmlFile>This will produce an XML format that rrdtool is capable of reading with the command:
rrdtool restore filename.xml filename.rrdYou can import an XML with the command:
pm restore <xmlFile> <rrdFile>This will read the XML export format that rrdtool is capable of writing with the command:
rrdtool xport filename.xml filename.rrdIntegration with Cisco Traffic Analyzer
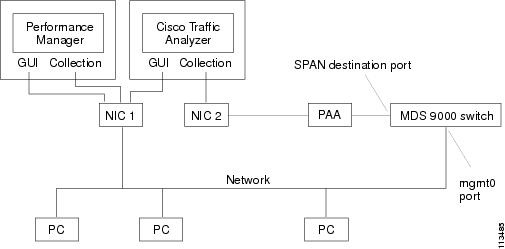
SNMP and Performance Manager can only provide a top-level view of what data the fabric is carrying. The Cisco MDS 9000 switch has no LUN-level flow counters, and cannot count SCSI commands. In order to view this detailed information, it is necessary to look at the data on a SPAN destination port with the help of the Cisco Traffic Analyzer, which uses the Cisco Port Adapter Analyzer.
Cisco Traffic Analyzer must be downloaded and installed separately.
Caution
Configuring PM for Use with Cisco Traffic Analyzer
Performance Manager works in conjunction with the Cisco Traffic Analyzer to allow you to monitor and manager the traffic on your fabric. The figure below is a graphic representation of how Performance Manager works with the Cisco Traffic Analyzer to monitor traffic on your fabric.
Figure 3-3 Overview of Performance Manager/Cisco Traffic Analyzer Configuration
Note
For information on setting up the Cisco Traffic Analyzer, refer to the Cisco MDS 9000 Family Port Analyzer Adapter 2 Installation and Configuration Note.To configure Performance Manager to work with the Cisco Traffic Analyzer, perform these steps:
Step 1
Step 2
•
•
•
Step 3
1.
2.
http://<ip address>:<port number>where:
<ip address> is the address of the management workstation on which you have installed the Cisco Traffic Analyzer, and
:<port number> is the port that is used by Cisco Traffic Analyzer (the default is :3000).
3.
4.
5.
D:\<directory>\ntop.batwhere:
D: is the drive letter for the disk drive where the Cisco Traffic Analyzer is installed, and
<directory> is the directory containing the ntop.bat file.
6.
Step 4
Step 5
1.
2.
3.
http://<ip address>/<directory>where:
<ip address> is the address of the management workstation on which you have installed the Cisco Traffic Analyzer, and
<directory> is the path to the directory where the Cisco Traffic Analyzer is installed.
4.
5.
6.
Note
Step 6
You see a list of XML files. These files are the data collection files you specified in the Performance Manager Configuration Wizard.
Note
Step 7
In about five minutes, an HTML report appears in your default web browser.
Step 8
Note
Note
For information on viewing and interpreting your Cisco Traffic Analyzer data, refer to the Cisco MDS 9000 Family Port Analyzer Adapter 2 Installation and Configuration Note.
Stopping Data Collection
You can stop a data collection process in Windows using the services panel. Right click on the Cisco Performance Manager service and select Stop.
On a Unix machine, enter the following command:
$HOME/.ciscomds9000/bin/pm.sh stopExporting Data Collection to XML Files
To export the collection to an XML file, enter the following command at the operating system command line prompt:
$HOME/.ciscomds9000/bin/pm.bat xport xxx yyyRemoving Data Collection Files from the List
To remove a data collection file from the list, edit the pm.txt file and comment out the line (#), or remove the line entirely.