Monitor Faults

This chapter describes the tasks to view alarms and create alarm profiles.

Fault Monitoring

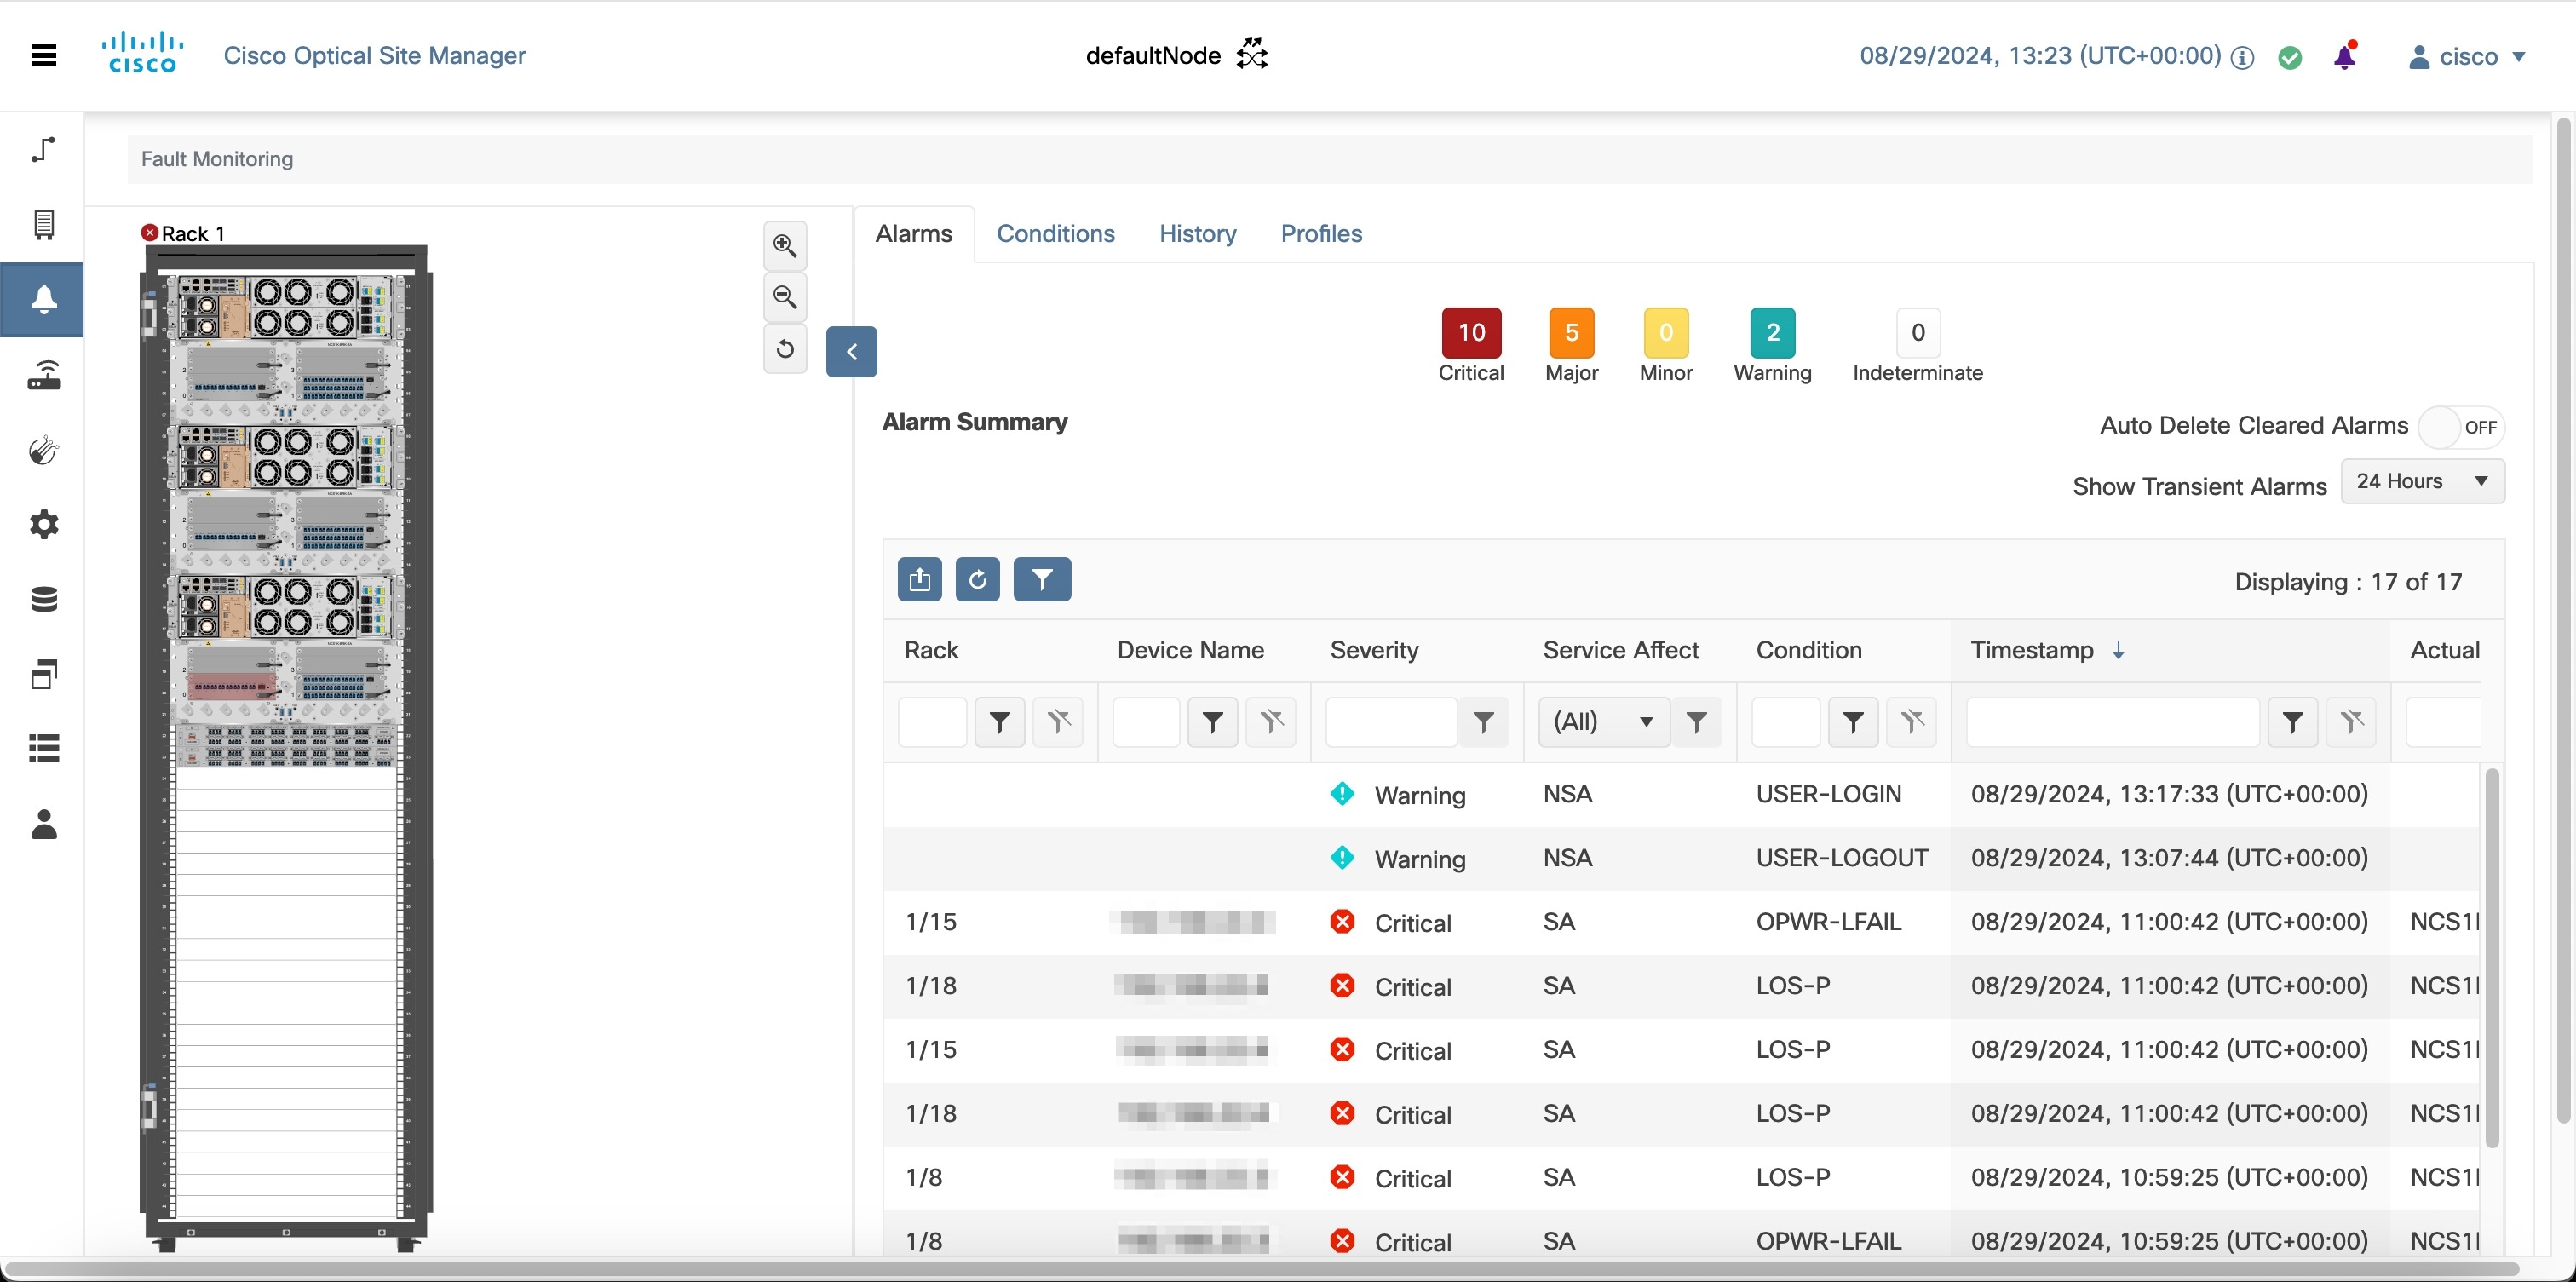
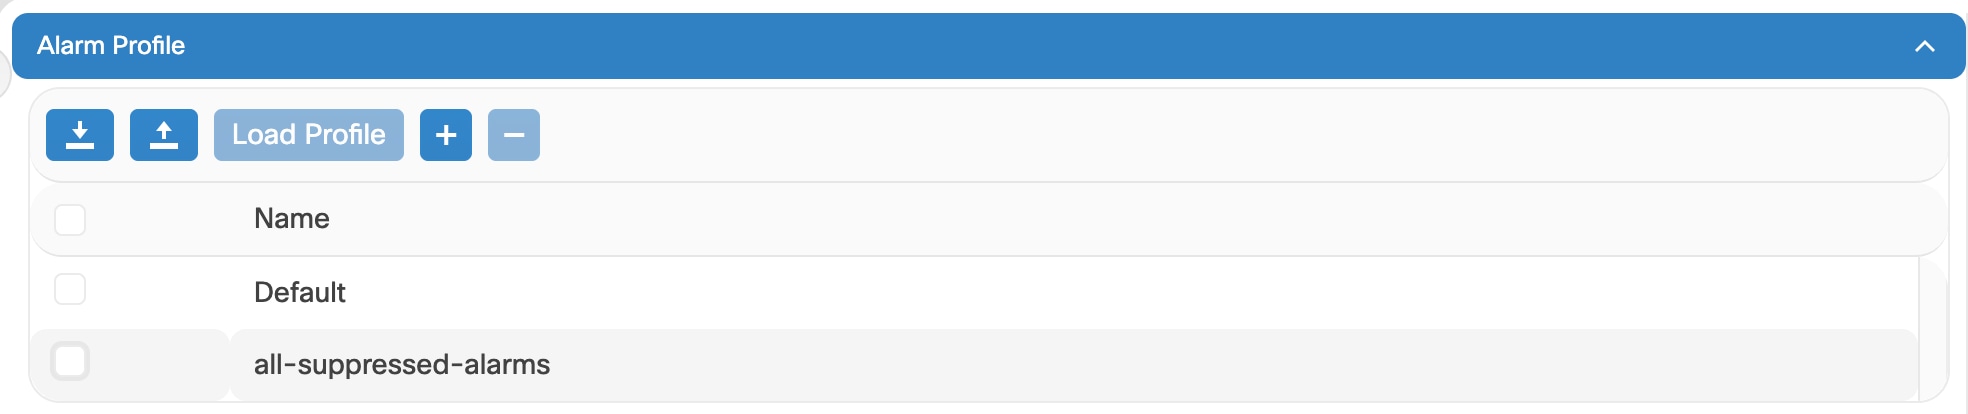
The Fault Monitoring panel displays a summary of all encountered alarms and conditions. It displays the number of Critical (CR), Major (MJ), Minor (MN), Warnings (W), and Non-applicable (NA) alarms. It displays the alarms, transient conditions, and historical alarms that are related to chassis, passive devices, pluggables, line cards, amplifier cards, and control cards. You can also create custom alarm profiles and apply them on the node using this pane.

Figure 1. Fault Monitoring

View rack, chassis, or card alarms

You can view the alarms raised on a rack, chassis, or card from the Alarms tab.

Follow these steps to view the alarms raised on a rack, chassis, or card.

Before you begin

Log into Cisco Optical Site Manager

Procedure


Step 1

Click Topology in the left panel.

The Topology page appears.

Step 2

Perform one of the following steps to view alarms for a rack, chassis or card:

  • Click the rack name from the Rack view to view alarms for a rack.

  • Right-click the chassis screws from the Rack view and select Open to view alarms for a chassis.

  • Right-click the card from the Rack view and select Open to view alarms for a card.

The Alarms tab displays alarms with various severities, each indicated by a different color:

  • Critical

  • Major

  • Minor

  • Warning

  • Intermediate

Step 3

(Optional) Select a sepcific time slot from the Show Transient Alarms drop-down list to view alarms for a specific time slot.

Step 4

(Optional) Click the Auto Delete Cleared Alarms toggle button to automatically delete the cleared alarms.

Step 5

(Optional) Click the Excel Export button to export and download the alarms to an Excel sheet.


You can view, filter, manage, and export alarms by severity for specific racks, chassis, or cards.

View all alarms and conditions

You can view all alarms for all components such as racks, chassis, cards, and ports to monitor system-wide status and detect issues.

Follow these steps to view all alarms and transient conditions:

Before you begin

Log into Cisco Optical Site Manager

Procedure


Step 1

Click Fault Monitoring in the left panel.

Alternatively, you can also click the bell icon on the top-right corner.

Step 2

Click the Alarms tab to view all the alarms.

Alarms are displayed with several severities, such as Critical, Major, Minor, Warning, and Intermediate. The alarm severities are indicated by different colors.

Step 3

Click the Conditions tab to view all the transient conditions.

Step 4

Click the History tab to view the alarms.

Step 5

(Optional) Click the Auto Delete Cleared Alarms toggle button to automatically delete the cleared alarms.

Step 6

(Optional) Click the Excel Export button to export the alarms to an Excel sheet.


View correlated alarms

Table 1. Feature History

Feature Name

Release Information

Description

Correlated Alarms

Cisco IOS XR Release 25.1.1

You can now view correlated alarms for a device in the Alarms tab, streamlining system performance management by highlighting primary alarms and suppressing secondary ones.

Follow these steps to display the correlated alarms raised on a rack, chassis, card or port.

Before you begin

Log into Cisco Optical Site Manager

Procedure


Step 1

Click Fault Monitoring in the left panel.

Alternatively, you can also click the bell icon on the top-right corner.

Step 2

Click the Alarms tab.

Alarms are displayed with several severities, such as Critical, Major, Minor, Warning, and Intermediate. The alarm severities are indicated by different colors.

Step 3

Click the Expand Correlated Alarms icon under the Severity column next to the device name to view the correlated alarms.

The RCA table displays a list of the correlated alarms for the device.

Step 4

Click Back to Alarms Overview button to go back to alarms list.


View rack, chassis, or card transient conditions

View transient conditions on network components such as racks, chassis, and cards. You can download these conditions to an Excel report for further analysis.

Follow these steps to view transient conditions that include standing or transient notifications on the network, node, or card.

Before you begin

Log into Cisco Optical Site Manager

Procedure


Step 1

Click Topology in the left panel.

The Topology page appears.

Step 2

Perform one of the following steps to view the transient conditions:

If you want to view the ...

then

transient conditions for a rack

click the rack name.

transient conditions for a chassis

right-click the chassis screws and select Open.

transient conditions for a card

right-click the card and select Open.

Step 3

Click the Conditions tab.

Step 4

Select a time slot from the Show Transient Alarms In drop-down list to view transient conditions for a specific time slot.

Step 5

(Optional) Click the Excel Export button to export the transient conditions to an Excel sheet.


View alarms history

View the alarms history to track and analyze past network issues for effective troubleshooting and trend identification.

Follow these steps to display the alarms history raised on a rack, chassis, or card.

Procedure


Step 1

Click COSM Topology in the left panel.

The COSM Topology page appears.

Step 2

Perform one of the following steps to view the alarms history:

If you want to ...

then

view alarms history for a rack

click the rack name from the rack view.

view alarms history for a chassis

right-click the chassis screws from the rack view and select Open.

view alarms history for a card

right-click the card from the Rack view and select Open.

Step 3

Click the History tab.

The alarms are displayed with various severities, each indicated by a different color:

  • Critical

  • Major

  • Minor

  • Warning

  • Intermediate

Step 4

(Optional) Click the Excel Export button to export the alarms hisyory to an Excel sheet.


Alarm profiles

An alarm profile enables you to customize alarm severities by creating unique profiles for individual components such as ports, cards, chassis, passive units, optical cross-connects, and optical interfaces.

Cisco Optical Site Manager includes two predefined alarm profiles:

  • Default profile

  • All suppressed alarms profile

Default profile

The Default profile serves as the baseline for alarm severities and provides a standardized configuration for all alarms:

  • The default alarm profile is preprovisioned on the node and contains all alarms.

  • It sets alarm severities according to standard Telcordia GR-474-CORE guidelines, which cannot be changed.

  • Default severities are applied to all alarms and conditions until a new custom profile is created and applied.

  • Example of inheritance: A card with an inherited alarm profile adopts the severities applied at the node level.

  • Different profiles can be applied at various levels (e.g., node, card, port). You could use the Default profile on a node, cards, and ports, but apply a custom profile to downgrade alarms on a specific card.

All suppressed alarms Profile

The all-suppressed-alarms profile focuses on alarms that are intentionally excluded from monitoring and management:

  • The profile includes all alarms that are suppressed.

  • It is helpful for troubleshooting by excluding non-critical alerts.

  • When applied, the profile ensures that suppressed alarms do not affect the monitoring process.

Figure 2. Alarm Profiles

Customizing alarm profiles

Alarm profiles offer flexibility by allowing users to apply different profiles at various levels of the network hierarchy, enabling tailored alarm management.

  • Default Behavior: Default severities remain active for all alarms and conditions until a new profile is created and applied.

  • Flexible Application: Alarm profiles can be applied at different levels of the network hierarchy, providing flexibility in alarm management. For example, the default profile can be used for the node, cards, and ports, while a custom profile may be applied to downgrade alarms on a specific card.

  • Severity Modification: When modifying an alarm profile, all Critical (CR) or Major (MJ) severity settings—whether default or user-defined—are demoted to Minor (MN) in Non-Service-Affecting (NSA) settings, and vice versa, as per Telcordia GR-474 standards.

Create and load alarm profiles

Using alarm profiles helps streamline fault monitoring and reduce alarm noise, making it easier to focus on critical issues in the network.

Follow these steps to create and load alarm profiles a node.

Before you begin

Log into Cisco Optical Site Manager

Procedure


Step 1

Click Fault Monitoring in the left panel.

Step 2

Click the Profiles tab.

Step 3

Click Alarm Profile to expand the section.

The default profile all-suppressed alarms is displayed along with the list of alarms.

Step 4

Click the + button to create an alarm profile.

The Alarm Profile dialog box appears.

Step 5

Enter the name of the custom alarm profile in the Name field.

Step 6

(Optional) Choose the resources such as card, ecu, and fan-tray from the Resources drop-down list.

You can select multiple resouces from the list.

Step 7

Click Apply.

The alarm profile is created and displayed in the list along with the default alarm profile.

Step 8

Select the check-box corresponding to the alarm profile and click Load Profile to load the alarm profile on the node.

The alarms that belong to the selected alarm profile appear in the Alarms for Profile sub-section.


Associate alarm profiles

Log into Cisco Optical Site Manager

Associate custom alarm profiles with the resources, such as ports, cards, chassis, passive units, optical cross-connects, and optical interfaces, to customize alarm severities.

Follow these steps to associate alarm profiles with resources: ports, cards, chassis, passive units, optical cross-connects, and optical interfaces.

Procedure


Step 1

Click Fault Monitoring in the left panel.

Step 2

In the Profiles tab, click Profile Association to expand the section.

Step 3

Follow these steps to create a profile association:

  1. Click the + button.

    The Profile Association dialog box appears.
  2. Type the name of the profile association in the Association field.

  3. Select the alarm profile from the Profile drop-down list and click Apply.

    The association name and profile are displayed in the table.

Step 4

Click the + button to expand the association name.

Step 5

Follow these steps to create a resource type:

  1. Click the + button above the Resource Type column to create a resource type.

    The Resource dialog box appears.

  2. Select a resource from the Resource Type drop-down list:

    The Resource Type drop-down list contains all the resources to which the alarm profile can be associated. Multiple resources can be associated with the same alarm profile.

  3. Select any of these options from the Inherited drop-down list.

    • true - To indicate if the association should be applied to all the children of this resource.

    • false - To indicate if the association should not be applied.

  4. Select the desired values from the other drop-down lists and click Apply.


When the alarm profile is associated with the resources, all the outstanding and new alarms matching these resources are immediately set with the new alarm severities.

User tags

Table 2. Feature History

Feature Name

Release Information

Description

User Tags

Cisco IOS XR Release 25.1.1

You can now add user tags to a chassis, module, PPM, interfaces, or OXC from the User Tag tab on the Fault Monitoring page. The added tags appear in the User Tag column of the alarms list.

User tags streamline the identification and management of geographic locations and equipment across network sites where alarms are triggered.

User tags are identifiers that simplify the management of a chassis and its components within a network hierarchy, ensuring efficient location and equipment tracking.

Key features of user tags

User tags provide several functionalities to enhance alarm management and location tracking:

  • Alarm identification: User tags assist in identifying a chassis, module, PPM, interface, or OXC when alarms are raised.

  • Tree structure representation: The User Tag tab displays chassis and their components in a tree structure. You can expand or collapse items by clicking the chassis or component name, or the "+" or "-" icon.

  • CLLI application: User tags apply CLLI (Common Language Location Identifier), a standardized 11-character code that uniquely identifies geographic locations and equipment for network sites, network support sites, and customer locations.

User tag inheritance

To ensure consistent tagging within a network hierarchy, user tags follow specific inheritance rules:

  • User tags propagate from parent to child components of a chassis by default.

  • A user tag assigned to a child component overrides the inherited tag from its parent.

Create user tags

Add user tags to devices, such as chassis, modules, PPMs, interfaces, or OXCs, to streamline identification and management of equipment across network sites with active alarms.

Use this task to create user tags to quickly identify the affected device.

Before you begin

Log into Cisco Optical Site Manager

Procedure


Step 1

Click Fault Monitoring in the left panel.

Step 2

Click the User Tag tab.

Step 3

Click the Edit button.

You can now edit the tag fields corresponding to the devices in the list.

Step 4

Type the tag name corresponding to the site, rack, chassis, or device, and press Enter.

Step 5

Click Apply to save the changes.


View the tag name in the User Tag column under the Alarms tab to easily identify the affected device.