Node Functional View

This chapter describes the Node Functional View (NFV) used in Cisco Optical Site Manager and its related tasks.

Table 1. Feature History

Feature Name

Release Information

Description

Detailed View in NFV for Transponder and Muxponder Card on Third-party OLS Networks 

Cisco IOS XR Release 24.2.1

The Node Functional View (NFV) has been enhanced to provide a detailed view of transponder and muxponder cards on NCS1014 deployed within networks utilizing third-party Optical Line Systems (OLS).

This detailed view provides a graphical representation of the connections between the trunk and client ports on the transponder and muxponder cards, thereby simplifying the visualization of the network's connection layout.

Detailed View in NFV for Transponder and Muxponder Cards on OLS Networks

Cisco IOS XR Release 24.1.1

You can now access a detailed graphical representation of the connections between the trunk and client ports of the transponder and muxponder cards on Optical Line System (OLS) NCS 1010 networks. This is available in the Map View of Node Functional View (NFV).

This view is based on the card mode configured on the cards. When you access the detailed view, the right-panel of the Node Functional View displays the card mode details and a list of ports and their settings.

Understanding Node Functional View

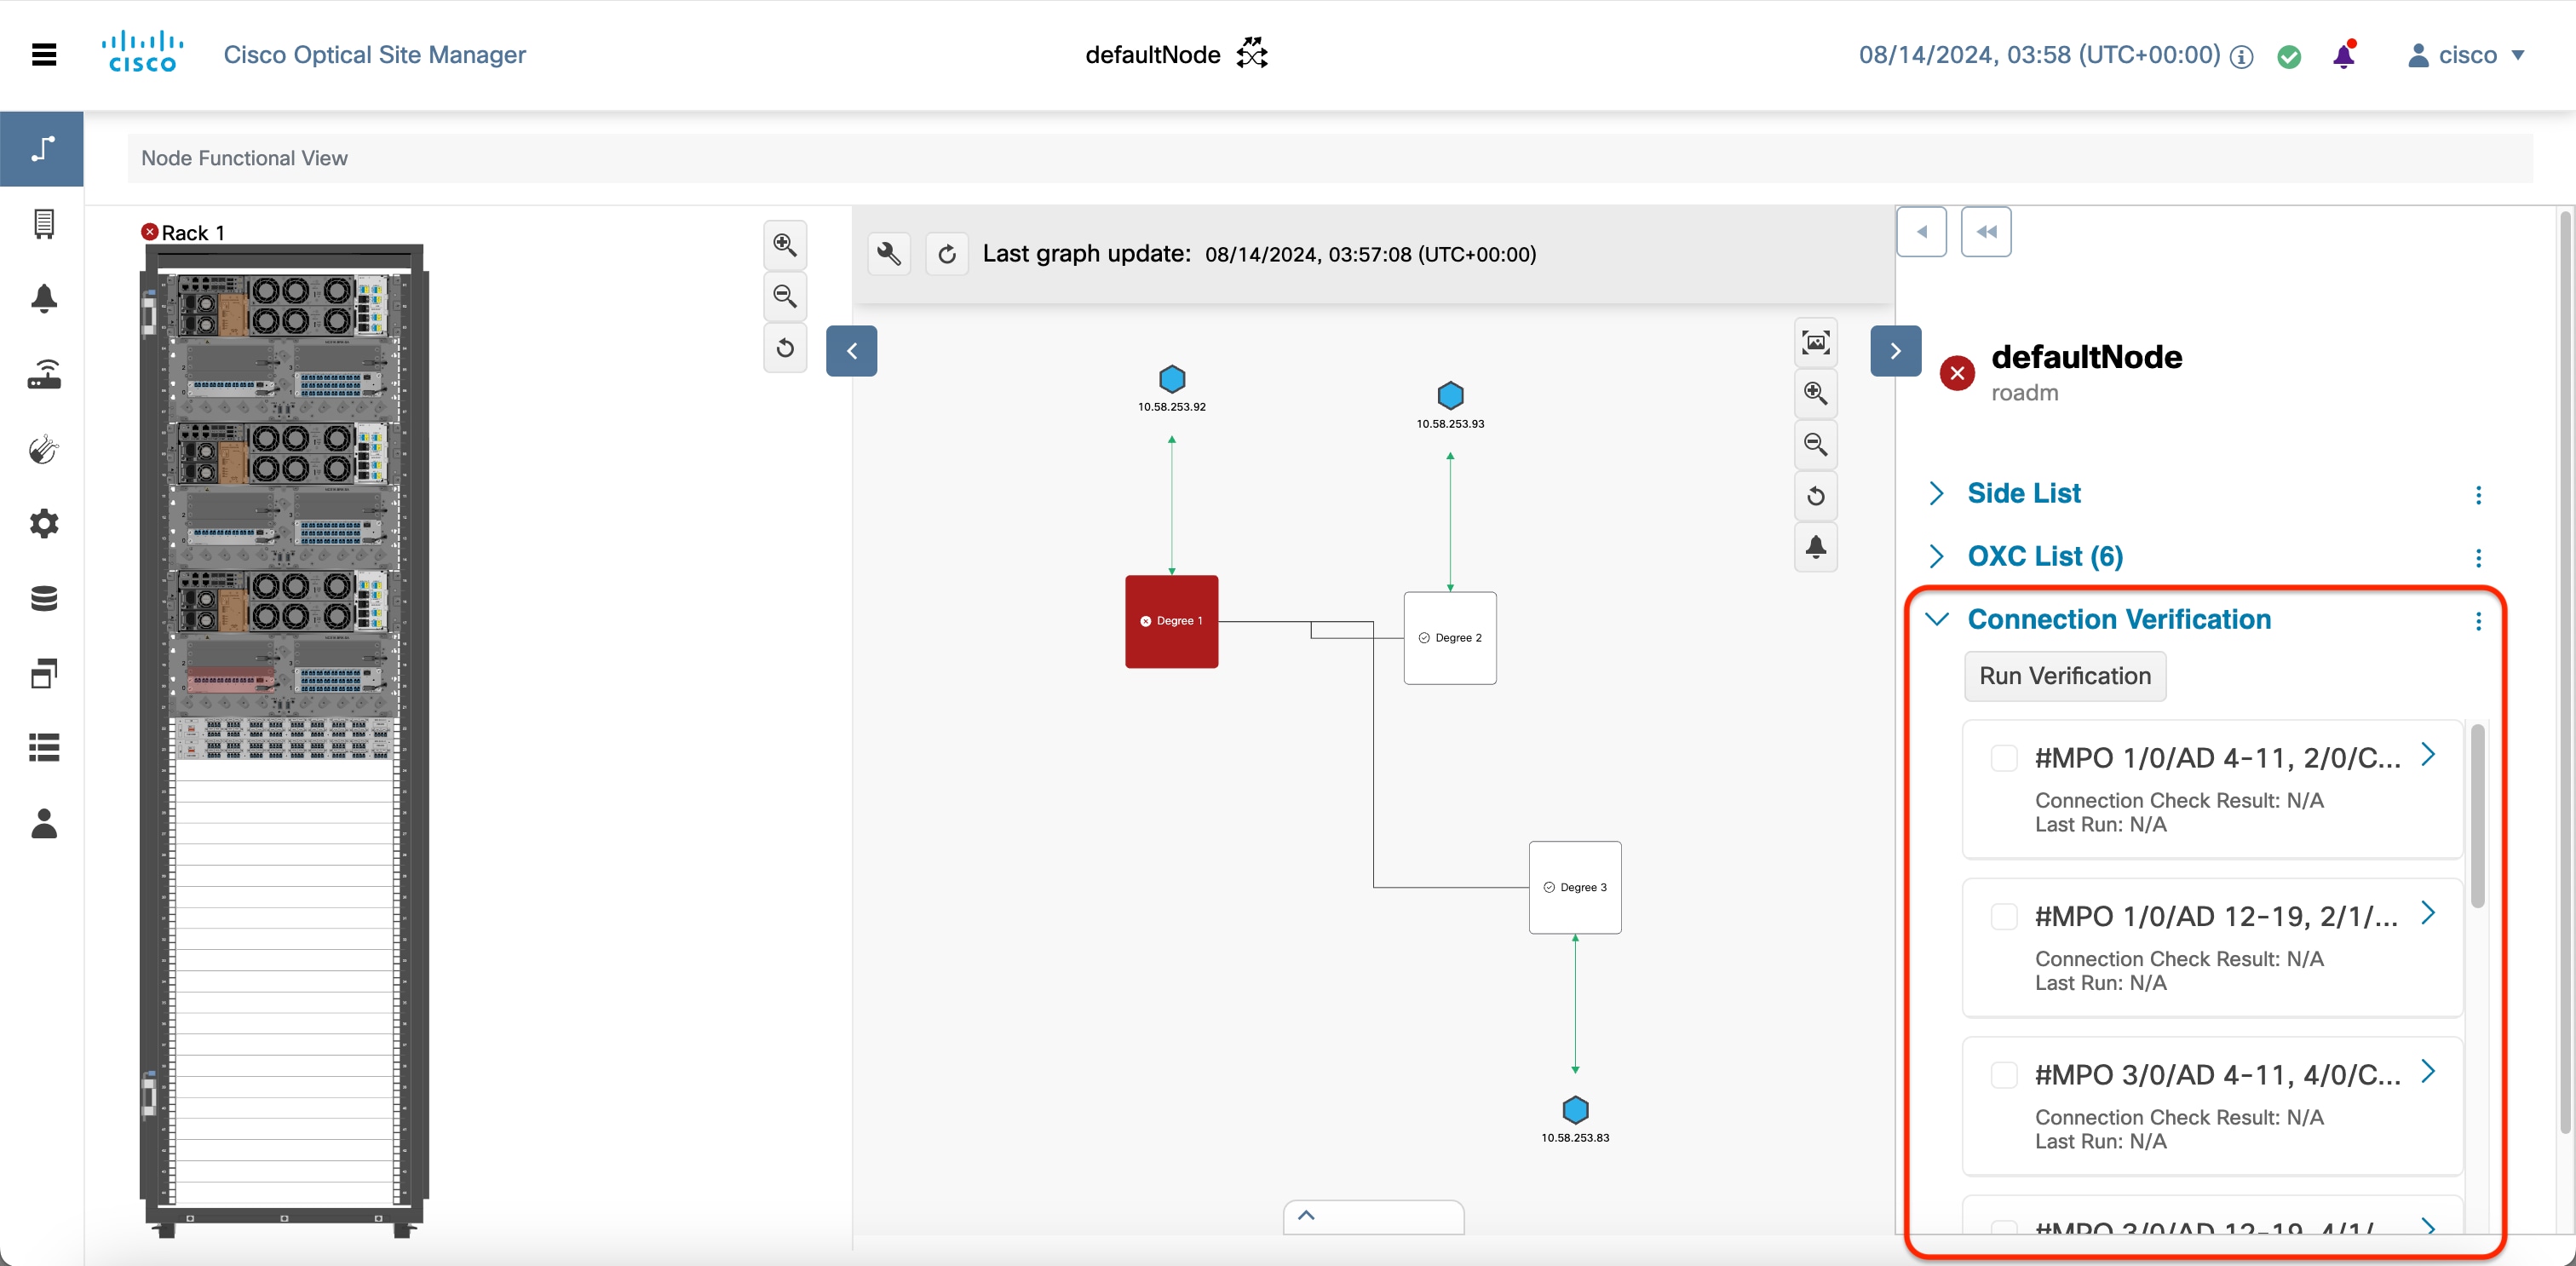
A Node Functional View (NFV) is a visual representation that provides details of a network rack, including the node and its associated components.

Using NFV, you can:

  • includes components such as cards and chassis.

  • switch between different views.

  • explore detailed maps of physical connections.

  • interact between the Map and Rack views, allowing you to highlight and zoom in on specific components and their connections, such as optical cross-connections and port details.

Figure 1. Node Functional View

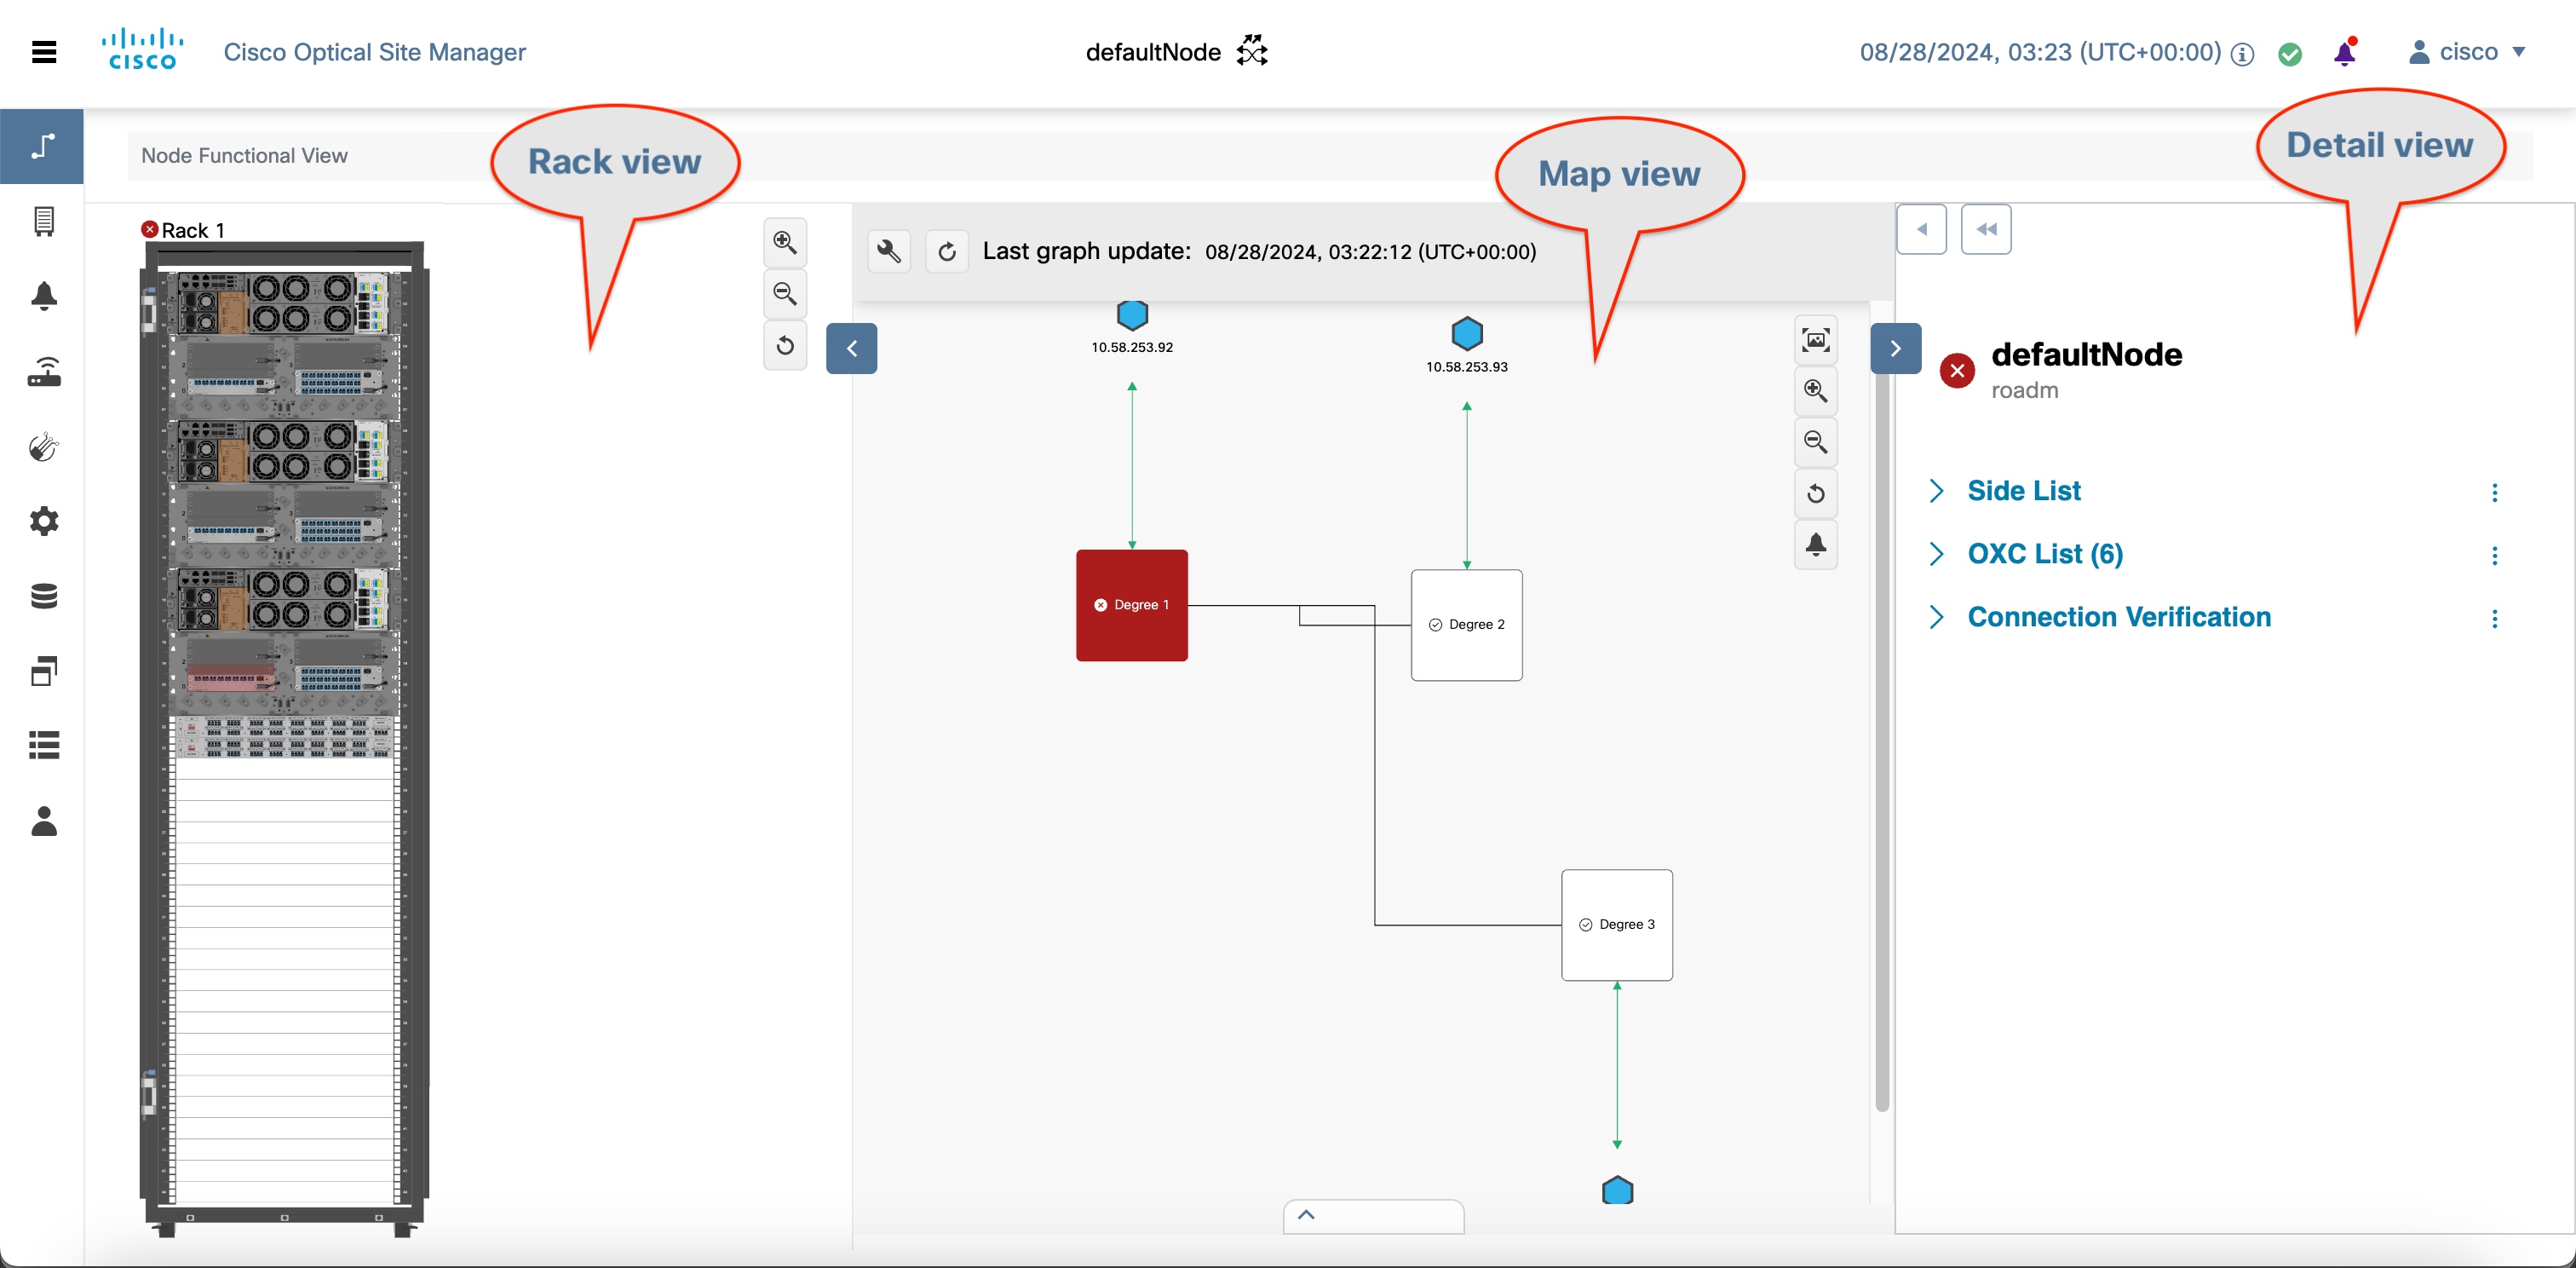
Node Functional View panels

This table describes the NFV panels.

Table 2. Overview of NFV panels

UI element

Description

Use when you need to...

How to access

Rack view

Displays a visual representation of a rack, including the node and its cards.

  • Add chassis or passive units.

  • Open, delete, or view details of chassis and cards.

Click the Collapse Shoulder button to expand or collapse this view.

Map view

Displays a visual map of the components of the node connected by patch cords according to physical connections.

  • Toggle between node, side, card, circuit, port, and patch cord views.

  • Zoom or highlight a node or card in the rack view

  • See trunk-client port connections and internal patch cords (IPC) based on card mode.

This view is always visible.

Detail view

Displays all relevant information about nodes, sides, cards, circuits, ports, or patch cords.

  • Check optical degrees and their status

  • View and manage optical cross connections (OXC)

  • Run connection verification between components

  • View card mode configuration and details

  • List available ports and inspect individual port settings

Click the Collapse Shoulder button to expand or collapse this view.

NFV icons

This table describes the action icons used in the NFV.

Table 3. Icon used on NFV

Icon

Description

Resets the zoomed view to normal view.

Refresh

Refreshes the map view with current information.

Expands or collapses the rack or Detailed view.

Displays or hides the alarms icon in the map and detailed view.

  1. Click this button.

  2. Select or deselect the alarm icons in the drop-down list to display or hide the alarms icon in the map and detailed view.

User Settings

Sets the user preferences.

For more details, see Customize NFV layout.

Zoom In

Zooms in the rack or map view.

Zoom Out

Zooms out the rack or map view.

Zoom Out

Navigates to the default view in the map view.

Zoom Out

Navigates to the previous page in the map View.

Zoom Out

Expands or collapses the Alarms section.

Zoom Out

Magnifies the selected area of the map view, providing a closer and more detailed view of that specific section.

View node details

The details of a node can be viewed from the right-panel, including the list of nodes, active circuits, and physical connections.

Follow these steps to view the details of a node in the NFV.

Before you begin

Log into Cisco Optical Site Manager

Procedure


Step 1

Click Node Functional View in the left panel.

The Node Functional View page appears.

Step 2

Click Collapse Shoulder to expand the right-panel.


The following table describes the details of the sections on the right-panel.

Table 4. Node details

Section

Description

Side List

Displays a list of the nodes along with its details, such as span loss value, the IP address of the device it is connected to, and its degree.

OXC List

Displays a list of active circuits passing through a particular card.

For more details, see View active circuit list.

Connection Verification

Displays a list of the connections between the line cards and all passive modules.

For more details, see Connection verification.

View degree details for a OLS node

Follow these steps to view the details of the degree for a OLS node in NFV.

Before you begin

Log into Cisco Optical Site Manager

Procedure


Step 1

Click Node Functional View in the left panel.

The Node Functional View page appears.

Step 2

Perform any of these to view the details of a degree:

  • Right-click a side in the map view and choose View Details.
  • Click > next to the degree name in the right panel.

Step 3

(Optional) Click the vertical ellipsis icon and choose from any of the following options to sort the list of ports or OXC:

  • A-Z
  • Z-A
  • High Severity
  • Low Severity.

You can view these details in the right panel:
  • Overall alarm status as a colored label and an icon

  • (Optional) Span loss

  • (Optional) ORL of OTDR

  • (Optional) Fiber End of OTDR

  • (Optional) OSC power

  • (Optional) IP address of the node of its optional neighbor. To open the Cisco Optical Site Manager web UI of the neighbor node in a new browser tab, click the IP address of the neighbor node.

  • Degree of its optional neighbor

  • Card List tab - Displays the list of all the cards present in both sides. The shelf number and slot number are displayed with the card name. The trunk port number is also displayed for TXP cards.

  • Circuit List tab - Displays the list of all the circuits present in the side.

Optical Channel Monitoring

Optical Channel Monitoring (OCM) is a technology used to monitor the performance and health of optical signals (wavelengths) running through fiber networks. It enables operators to gain real-time visibility into the optical spectrum without disrupting traffic.

OCM improves network visibility, enables proactive maintenance, and provides signal assurance. These enhancements reduce downtime and operational complexity in large optical transport networks.

Key features of OCM

The Optical Channel Monitoring capabilities in the NCS 1010 provide the following essential functions for managing and troubleshooting optical networks:

  • Real-Time Spectrum Monitoring: OCM scans the optical C-band and visualizes the power levels of individual optical channels. This feature helps detect signal degradation, identify channel presence or absence, and recognize spectral interference.

  • Integration with NCS 1010 ROADM: The OCM integrated with the ROADM helps validate wavelength routing, power levels, and OSNR (Optical Signal to Noise Ratio).

  • Graphical Spectrum View: Cisco Optical Site Manager provides a visual representation of the spectrum with channel peaks, helping easily spot anomalies.

OCM tab icons and elements

The table describes the action icons available in the OCM tab.

UI Element/Icon

Description

Direction

When graph view is enabled:
  • RX: Select to view the optical spectrum in the RX direction.

  • TX: Select to view the optical spectrum in the TX direction.

When table view is enabled:
  • C-band: Select to view the optical spectrum for the C band.

  • L-band:Select to view the optical spectrum for the L band.

Click this button to change to the table or graph view.

Expected channel missing or underpowered (useful for fault detection).

Reload the graph or table.

View Optical Channel Monitoring data

Optical Channel Monitoring (OCM) on Cisco NCS 1010 enables continuous monitoring of optical signal parameters for each individual wavelength on a fiber.

View power levels (in dBm) of individual wavelengths traveling through a fiber using OCM on Cisco NCS 1010.

Follow these steps to view the OCM for the receive (Rx) and transmit (Tx) directions.

Before you begin

Log into Cisco Optical Site Manager

Procedure


Step 1

Click Node Functional View in the left panel.

Step 2

Right-click an optical degree in the map view and select Open.

Step 3

Expand the panel at the bottom of the page.

Step 4

Click the OCM tab.

Step 5

Select RX or TX to view the OCM data for the receive or transmit direction in the spectrum graph.

For more details about the spectrum graph, see OCM spectrum graph.

Step 6

Click the Spectrum Occupancy Chart button to view the spectrum occupancy table.

For more details about the spectrum occupancy table, see OCM utilization table.


You can view the transmission or reception power levels for the optical degree you selected in the OCM data and spectrum occupancy graph and table.

OCM spectrum graph

The OCM spectrum graph displays the power spectral density (dBm per GHz) across the optical C-band in the RX or TX directions. This highlights the presence and consistency of carriers.

  • X-Axis (Frequency in THz): Represents optical frequencies that cover the C-band.

  • Y-Axis (Power Spectral Density): Displays signal power in dBm per GHz, indicating the strength of received signals at each frequency.

Figure 2. OCM spectrum graph

OCM spectrum graph color elements

The color coding in the OCM spectrum graph identifies the type of signal at each frequency:

Color

Elements

Description

Green

Carrier

Valid optical channel present at that frequency.

Grey

ASE

Amplified spontaneous emission that represents optical noise level.

Yellow

Missing Carrier

Expected channel missing or underpowered (useful for fault detection).

OCM utilization table

The OCM utilization table presents a frequency-slot grid showing how much of the optical spectrum is currently in use, with each cell representing a discrete frequency-time slot. This table helps network operators quickly assess spectrum occupancy and identify free or underutilized slots for provisioning.

Read and interpret the layout of the OCM table as described in these points:

  • Columns: The columns in the table represent discrete frequency slot positions, indexed using normalized values (e.g., 0.01250, 0.02500), and aligned with the C-band spectrum.

  • Rows: Each row shows a specific optical frequency in THz, arranged from higher to lower values.

Figure 3. OCM utilization table

OCM utilization table color elements

The color coding in the OCM table shows different spectral components:

Table 5. OCM utilization table color coding

Color

Element

Description

Green

Carrier

A green cell shows an active optical signal in that frequency slot and indicates live data traffic or a provisioned channel.

Light Gray

ASE

Light gray cells represent amplified spontaneous emission, which is optical noise.

Yellow

Missing Carrier

A yellow cell means the expected channel is not detected. This result can indicate signal loss, misalignment, or a transponder issue.

Dark Gray

Out of Scope

A dark gray cell shows a frequency region outside the monitoring scope of your current configuration.

Optical Time Domain Reflectometer

An Optical Time Domain Reflectometer (OTDR) is a built-in fiber diagnostic tool in NCS 1010 that

  • sends light pulses through the optical fiber,

  • measures the reflected signals to detect faults, measure span loss,

  • and locates events such as fiber cuts or high reflections.

OTDR benefits

Cisco Optical Site Manager enables you to assess fiber quality during system installation (prior to activating traffic) using the Optical Time Domain Reflectometer (OTDR) feature.

The OTDR feature offers several advantages for fiber management:

  • Real-time loss and back reflection measurements for the fiber pair connected to the TX and RX ports.

  • Monitoring of the fiber during live system operation.

  • Inspection of the fiber following cable cut and repair events.

OTDR icons

The OTDR tab displays the optical trace for the selected degree and direction, helping you analyze signal quality, detect faults, and verify fiber link health.

OTDR icon descriptions

The table provides an overview of the icons available on the OTDR tab, along with a description of each operation they perform.

Table 6. OTDR icon descriptions
Icon

Description

—

To zoom into a specific area, press Shift and drag to create a rectangle around the area you want to zoom into.

—

Scroll down to zoom out of the graph.

Resets the graph to its original zoom and position.

Download the graph as an image.

Download SOR file that contains the fiber trace details such as the distance, reflectance, loss, and fiber attenuation measurements.

Save the current OTDR scan results as a baseline.

Clear the reflections or losses alarms.

Enable or disable automatic OTDR scan after a fiber cut or Raman Turn Up.

Enable automatic OTDR scan

In the automatic mode, OTDR automatically triggers a scan after events such as span faults, fiber restorations, device power cycles, or line card reloads.

Follow these steps to enable or disable the automatic OTDR scan.

Before you begin

Log into Cisco Optical Site Manager

Procedure


Step 1

Click Node Functional View in the left panel.

Step 2

Right-click an optical degree in the map view and click Open.

Step 3

Expand the panel at the bottom of the page.

Step 4

Click the OTDR tab and then click the OTDR Settings icon.

OTDR Configurations dialog box is displayed.

Step 5

Click the Global tab.

Step 6

Select these checkboxes in the Automatic OTDR Scans Settings section:

If you want to enable automatic OTDR scan

then select this check box

after a system startup, fiber cut or repair

System Startup, Fiber Cut & Repair

after the Raman turn-up process is completed

Raman Turn Up

if span loss increases

Span Loss Increase

if an excessive ORL is detected from the span

Excessive ORL from span

Step 7

Specify the delay time in the Start Delay (Min) field.

Step 8

Specify the threshold in dB in the Span Loss Increase Threshold (dB) field.

Step 9

Click Apply.


Run a manual OTDR scan

Manually run an OTDR scan during fiber installation or troubleshooting to verify link quality and locate faults.

Follow these steps to manually run an OTDR scan.

Before you begin

Log into Cisco Optical Site Manager

Procedure


Step 1

Click Node Functional View in the left panel.

Step 2

Right-click an optical degree in the map view and click Open.

Step 3

Expand the panel at the bottom of the page.

Step 4

Click the OTDR tab.

Step 5

Scroll to the bottom of the panel.

Step 6

Select RX or TX to run the OTDR scan in the RX or TX directions, respectively.

Step 7

Click the Direction button to set the OTDR scan sensitivity and threshold values.

Table 7. OTDR scan sensitivity and threshold

Use this option

To

Loss Sensitivity

enable the OTDR scan to detect small signal losses (attenuation) along the fiber. Higher loss sensitivity helps the OTDR identify minor attenuation caused by factors like bends or splices.

Reflection Sensitivity

enable the OTDR scan to detect reflected signals from events such as connector interfaces, splices, or breaks.

High reflection sensitivity is crucial for accurately locating and analyzing reflective faults in the fiber.

Absolute Threshold

ensure that the OTDR scan can reliably detect and measure the lowest signal strength, allowing the OTDR to provide accurate and meaningful data essential for identifying weak signals or long-distance faults.

Unprovision

delete the OTDR scan results in the selected direction.

Step 8

Click Start Scan button to start OTDR scan.

The OTDR-SCAN-IN-PROGRESS-RX alarm is raised and displayed ion the Alarms tab of the Fault Monitoring menu.

Step 9

Click Stop Scan button to terminate the OTDR scan.

An informational message appears indicating that the OTDR scan has been terminated.


The scan results are displayed in the graph.

View side details

Use this task to view the details of the side in NFV.

Before you begin

Log into Cisco Optical Site Manager

Procedure


Step 1

Click Node Functional View in the left panel.

The Node Functional View page appears.

Step 2

Right-click a side in the map view and choose View Details to view the details of the selected side along with the right shoulder.

Step 3

View the following information that is displayed in the right shoulder. Optional means that the information is displayed when available.

  • Name of the side

  • Overall alarm status as a colored label and an icon

  • (Optional) Span loss

  • (Optional) ORL of OTDR

  • (Optional) Fiber End of OTDR

  • (Optional) OSC power

  • (Optional) IP address of the node of its optional neighbor. To open the Cisco Optical Site Manager web UI of the neighbor node in a new browser tab, click the IP address of the neighbor node.

  • Degree of its optional neighbor

  • Card List tab - Displays the list of all the cards present in the side. The shelf number and slot number are displayed with the card name. The trunk port number is also displayed for TXP cards.

    To sort the list of cards, click the vertical ellipsis icon and choose A-Z, Z-A, High Severity, or Low Severity.

  • Circuit List tab - Displays the list of all the circuits present in the side.

    To sort the list of circuits, click the vertical ellipsis icon and choose A-Z, Z-A, High Severity, or Low Severity.


View side details for an OLS node

Use this task to view the details of the side for a node in NFV.

Before you begin

Log into Cisco Optical Site Manager

Procedure


Step 1

Click Node Functional View in the left panel.

The Node Functional View page appears.

Step 2

Right-click a side in the map view and choose View Details to view the details of the selected side along with the right shoulder.

Or

Click the arrow near the side name that is displayed inside the right shoulder.

Step 3

View Side 1 and Side 2 merged information that is displayed in the right shoulder. Optional means that the information is displayed when available.

  • Overall alarm status as a colored label and an icon

  • (Optional) Span loss

  • (Optional) ORL of OTDR

  • (Optional) Fiber End of OTDR

  • (Optional) OSC power

  • (Optional) IP address of the node of its optional neighbor. To open the Cisco Optical Site Manager web UI of the neighbor node in a new browser tab, click the IP address of the neighbor node.

  • Degree of its optional neighbor

  • Card List tab - Displays the list of all the cards present in both sides. The shelf number and slot number are displayed with the card name. The trunk port number is also displayed for TXP cards.

    To sort the list of cards, click the vertical ellipsis icon and choose A-Z, Z-A, High Severity, or Low Severity.

  • Circuit List tab - Displays the list of all the circuits present in the side.

    To sort the list of circuits, click the vertical ellipsis icon and choose A-Z, Z-A, High Severity, or Low Severity.


View card details

View card details, such as card name, location, port list, and optical cross-connections.

Follow these steps to view the details of the card in NFV.

Before you begin

Log into Cisco Optical Site Manager

Procedure


Step 1

Click Node Functional View in the left panel.

Step 2

Right-click a card in the map view and choose View Details.

Step 3

(Optional) Click the vertical ellipsis icon and choose from any of the following options to sort the list of ports or OXC:

  • A-Z
  • Z-A
  • High Severity
  • Low Severity.

You can view these card information in the right panel:

Section

Description

Name

Displays the name of the device.

Location

Displays the shelf, rack, or slot of the device.

Port list

Displays all the ports on the device.

OXC List

Displays the list of all the optical cross-connections.

View port details

Follow these steps to view the details of the port on a card.

Before you begin

Log into Cisco Optical Site Manager

Procedure


Step 1

Click Node Functional View in the left panel.

The Node Functional View page appears.

Step 2

Right-click a card in the map view and choose Open.

Step 3

Click the port on the device in the map view.

Step 4

(Optional) Click the vertical ellipsis icon and choose from any of the following options to sort the list of OXC:

  • A-Z
  • Z-A
  • High Severity
  • Low Severity.

You can view these port information in the right panel:

Section/Field

Description

Name

Displays the name of the port.

Location

Displays the shelf, rack, or slot of the card.

Powers

Displays the list of all the links with their aggregate power.

The aggregate power displays the current power in case of a single port. The aggregate power displays a list of all the different power levels in case of an MPO port or logical group.

OXC List

Displays the list of all the optical cross-connections.

View patch cord details

View patch cord details, such as patch cord name, ports that the patch cord connects, and optical cross-connections.

Follow these steps to view the details of a patch cord.

Before you begin

Log into Cisco Optical Site Manager

Procedure


Step 1

Click Node Functional View in the left panel.

Step 2

Right-click a degree and select Open.

Step 3

Click the patch cord connecting two devices in the map view.

You can view these patch cord information in the right panel:
Table 8. Patch cord details

Section/Field

Description

Name

Displays the name of the patch cord.

Connections

Displays the ports that the patch cord connects with their cards and the aggregate power.

Connection Verification

Displays a list of the connections between the line cards and all passive modules. For more details, see Connection verification.


View circuit details

View the logical connections established between optical ports or channels within a device.

Follow these steps to view the details of the optical cross connections (OXC) in NFV.

Before you begin

Log into Cisco Optical Site Manager

Procedure


Step 1

Click Node Functional View in the left panel.

Step 2

Click Collapse Shoulder to open the right panel.

Step 3

Click > against the circuit to view the details.


You can view these circuit information in the right panel:
Table 9. Patch cord details

Section/Field

Description

Circuit Info

Displays these details about the circuit:

  • Admin State

  • Service State

  • Frequency

  • Wavelength

Path

Displays these details:

  • Internal link: List of ports that are internally connected within the device.

  • PIn: Optical input power level received.

  • POut: Optical output power level.

Connection verification

Cisco Optical Site Manager offers a connection verification process that checks the cabling between the OLT-C line card and passive modules in an NCS 1010 device, helping prevent miscabling during node installation.

The connection verification process generates a specific probe signal from the Connection Verification Tunable Laser (CV-TL) located at COM-RX-2. This probe signal is then detected on the following components:

  • The same OLT-C line card.

  • Passive modules (Mux/Demux panel or breakout panel) connected to the OLT-C line card.

  • A different OLT-C line card or passive module belonging to the same near-end (NE) node.

  • An optical interface (router ports or transponders) connected to the line card.

Figure 4. Connection Verification

Connection verification status

This table describes the various connection verification status that are displayed in the Connection Check Result field of the right panel.

Status

Description

Connected

Cable or patchcord is connected.

Disconnected

Cable or patchcord is disconnected.

Connection-Not-Verified

Cable or patchcord is not tested for connection verification.

Verify connections

Verify physical connectivity between line cards and passive modules on an NCS 1010 device, ensuring correct cabling and preventing installation errors.

Follow these steps to verify connections.

Before you begin

Procedure


Step 1

Click Node Functional View in the left panel.

Step 2

Click the Expand shoulder icon to expand the right panel.

Step 3

Scroll to the Connection Verification section and click to expand it.

A list of available connections is displayed.

Step 4

Select the check boxes corresponding to the connections you want to verify.

Step 5

Click Run Verification.

Connection verification is initiated for the selected connections and an information message is displayed.

Step 6

Click OK.


The Connection Check Result field displays the status of the connection verification.

Customize NFV layout

Customize the layout, spacing, and visualization behavior of components in the NFV. These settings are stored in the local storage of the browser and are retained for that browser.

Use this task to customize the NFV layout.

Before you begin

Log into Cisco Optical Site Manager

Procedure


Step 1

Click Settings from the left panel.

Step 2

Click the Preferences tab.

Step 3

Perform these steps in the General section:

If you want to ...

then

Change date format

Select a format from the Date format drop-down list.

Change the channel

Select Frequency or Wavelength from the Configuration channel drop-down list.

Change the measurement unit of length

Select a unit from the Length measurement unit drop-down list.

Step 4

Select options from the drop-downs in the Right Shoulder section to set the default order of lists in the NFV right panel.

Step 5

Perform these steps in the Left Shoulder section:

If you want to ...

then

Set the default opacity factor in rack

Type a value in the Rack opacity factor field.

Valid range: 0 to 1 in increments of 0.1

Set the default left panel width

Type a value in pixels (px) in the Left shoulder width field.

Valid range: 400 px to 600 px

Display only visible cards in the rack

Select the Show only visible cards on the rack check box.

Step 6

Perform these steps in the NFV section:

If you want to ...

then

Set default space between items relative to the center point.

Type a value in the Degrees space from the center field.

Set the default vertical (or horizontal) distance between stacked layers.

Type a value in the Layers spacing field.

Set default space between adjacent columns in the layout

Type a value in the Column spacing field.

Set a default zoom level

Type a value in the Zoom scaling factor field.

Step 7

Click Apply.

Step 8

Refresh the browser to apply the configured settings.


View active circuit list

Use this task to view the total number of circuits passing through a degree and a selected card.

Before you begin

Log into Cisco Optical Site Manager

Procedure


Step 1

Click Node Functional View in the left panel.

The Node Functional View page appears.

Step 2

Right-click a Degree and click Open.

The OXC List in the right panel displays the the total number of connections passing through the degree.

Step 3

Right-click a card and click Open.

The Connections list in the right panel displays the the total number of connections passing through the degree.