CMX Analytics Home Page Components
The CMX Analytics user interface allows you to analyze the wireless devices location information using different analysis technique.
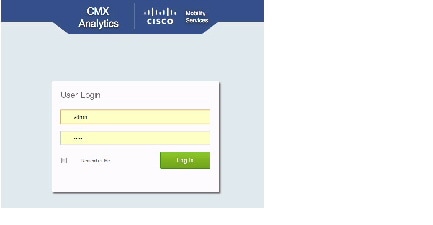
Log into the CMX Analytics user interface with your username and password. The following figure shows the CMX Analytics User Login page.
Figure 4-1 CMX Analytics User Login Page
After logging in, the CMX Analytics home page appears.
Figure 4-2 CMX Analytics Home Page
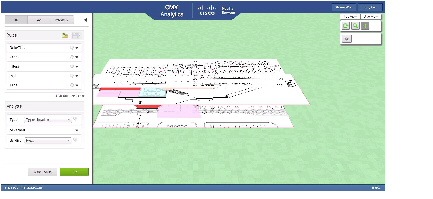
The CMX Analytics home page contains the following:
–![]() Auxiliary Information Window
Auxiliary Information Window
3D Analytics Tab
The CMX analytics system provides the ability to view analytics results in 3D environment. This provides a better understanding of results on multiple floor paths or when the dwell time is calculated for the multi-storey building.
Prerequisites for Viewing CMX Analytics in 3D
- Set up the CMX analytics system. See the Process for Setting up the CMX analytics System for more information.
- The CMX analytics supports a 3D representation of analytics using the WebGL. See the WebGL Requirements for information on compatible browsers.
Viewing Analytics in the 3D Environment
To view the analytics results in the 3D environment, follow these steps:
Step 1![]() In the Rules group box, you can establish specific devices that you want to analyze. For information on Rules parameters, see the Rules Group Box.
In the Rules group box, you can establish specific devices that you want to analyze. For information on Rules parameters, see the Rules Group Box.
Step 2![]() In the Analysis group box, you can perform different analysis on devices that passes through a building or environment. See the Typical Locations, Most Popular Paths Analysis, Alternative Path Analysis, and Heat Maps for more information on analysis.
In the Analysis group box, you can perform different analysis on devices that passes through a building or environment. See the Typical Locations, Most Popular Paths Analysis, Alternative Path Analysis, and Heat Maps for more information on analysis.
Step 4![]() Click 3D Analytics to view the results in the 3D environment.
Click 3D Analytics to view the results in the 3D environment.
The results are displayed in the right pane.
Step 5![]() Click the Navigation buttons available in the Auxiliary Information window to see different overlays of the building and also different views of the floors. The 3D environment provides the ability to switch on/off floors and zones.
Click the Navigation buttons available in the Auxiliary Information window to see different overlays of the building and also different views of the floors. The 3D environment provides the ability to switch on/off floors and zones.
2D Analytics tab
The CMX analytics provides the ability to view the analytic results in 2D. The 2D environment is primarily for outdoor visualization such as analyzing the open space or placing the building in its geographical context. This section contains the Viewing Analytics in 2D Environment..
Viewing Analytics in 2D Environment.
To view the analytics results in the 2D environment, follow these steps:
Step 1![]() In the Rules group box, you can establish specific devices that you want to analyze. For information on Rules parameters, see Rules Group Box.
In the Rules group box, you can establish specific devices that you want to analyze. For information on Rules parameters, see Rules Group Box.
Step 2![]() In the Analysis group box, you can perform different analysis on devices that passes through a building or environment. In order to perform different analysis, see Typical Locations, Most Popular Paths Analysis, Alternative Path Analysis, Heat Maps
In the Analysis group box, you can perform different analysis on devices that passes through a building or environment. In order to perform different analysis, see Typical Locations, Most Popular Paths Analysis, Alternative Path Analysis, Heat Maps
Step 4![]() Click 2D Analytics to view the results in the 2D environment.
Click 2D Analytics to view the results in the 2D environment.
The result is displayed in the right pane.
Rules Group Box
The Rules group box allows you to identify the specific set of devices to which the analytics have to be applied.
The Rules group box displays the following:
- Date/Time—The Date/Time rule allows you to select a specific date or range of dates and time or time period for which you want the analytics to be applied. Click the black inverted triangle icon located at the right of the Date/Time to see all available dates and configure date and time.

Note The date selector allows you to select only those dates for which there is some data available in the analytics database.
Select the Date check box to enable the Date and click the Date text box to open the calendar and to perform the following:
–![]() Specific Date—Click the blue inverted triangle icon located next to the Specific Date to open the Specific Date calendar and choose a specific date that you want to be considered for analysis.
Specific Date—Click the blue inverted triangle icon located next to the Specific Date to open the Specific Date calendar and choose a specific date that you want to be considered for analysis.
–![]() All Dates On or Before—Click the blue inverted triangle icon located next to All Dates On or Before to open the calendar and choose a date. All dates before the selected date are considered for analysis.
All Dates On or Before—Click the blue inverted triangle icon located next to All Dates On or Before to open the calendar and choose a date. All dates before the selected date are considered for analysis.
–![]() All Dates On or After—Click the blue inverted triangle icon located next to All Dates On or After to open the calendar and choose a date. All dates after the selected date are considered for analysis.
All Dates On or After—Click the blue inverted triangle icon located next to All Dates On or After to open the calendar and choose a date. All dates after the selected date are considered for analysis.
–![]() Date Range—Click the blue inverted triangle icon located next to the date range to open the calenar and choose the start date and end date. The analytics will be applied between the selected Start Date and End Date.
Date Range—Click the blue inverted triangle icon located next to the date range to open the calenar and choose the start date and end date. The analytics will be applied between the selected Start Date and End Date.
Note Only those paths that are within the time period is considered for analysis. For example, if the time period is between 6 AM to 4 PM, then only paths that start after 6 AM and finishes before 4 PM are considered for analysis.
Select the Time check box to enable the Time and perform the following:
–![]() Time Before—If you select this option, all times before the selected time are considered for analysis
Time Before—If you select this option, all times before the selected time are considered for analysis
–![]() Time After —If you select this option, all times after the selected time is considered for analysis
Time After —If you select this option, all times after the selected time is considered for analysis
–![]() Time Between—If you select this option, all times between the selected Start Time and End Time are considered for analysis.
Time Between—If you select this option, all times between the selected Start Time and End Time are considered for analysis.
- Zones—Click the black inverted triangle icon located at the right of the Zones to configure the following:
–![]() Restrict to Zones—Select the Restrict to Zones check box and choose one or multiple zones from Restrict to Zones drop-down list to restrict your analysis to selected zones. If want to analyze only certain part of the building, then information about the selected part is displayed.
Restrict to Zones—Select the Restrict to Zones check box and choose one or multiple zones from Restrict to Zones drop-down list to restrict your analysis to selected zones. If want to analyze only certain part of the building, then information about the selected part is displayed.
Note Zones are defined as coverage areas in the Prime Infrastructure.
- Filters—Click the black inverted triangle icon located at the right of the Filters to configure the following constraints on the points with different dwell time.
- Location Filters—Location filters allows you to select points for which you know the dwell times. This comes about when multiple points are detected in the same close proximity. These points are replaced by a single one and the dwell time attached to it is the elapsed duration between first and last point.
- Path Filters—Path filters allows you to select the data for analysis based on quantitative constraints on paths. The different quantitative constraints that you can use on paths from the Path Filters are:
–![]() Length—Length restricts the analysis to those paths within the sum of the straight line distances between the points.
Length—Length restricts the analysis to those paths within the sum of the straight line distances between the points.
–![]() Duration—Duration restricts the analysis to the total duration between the first and the last time points on the path.
Duration—Duration restricts the analysis to the total duration between the first and the last time points on the path.
–![]() Hops—Hops is the measure of the number of location observations made on that path.
Hops—Hops is the measure of the number of location observations made on that path.
- Path—Click the black inverted triangle icon located at the right of the Path to open the Path window. This allows you to select those devices that have followed a particular path through the predefined zones for analysis. The options are:
–![]() Starts In—Select the zone where the wireless device was first detected from the Starts In drop-down list.
Starts In—Select the zone where the wireless device was first detected from the Starts In drop-down list.
–![]() Visits—Select the intermediate zone through which the device passes through from the Visits drop-down list.
Visits—Select the intermediate zone through which the device passes through from the Visits drop-down list.
–![]() Ends In—Select the zone where the device was last detected from the Ends In drop-down list.
Ends In—Select the zone where the device was last detected from the Ends In drop-down list.
- Tags—Click the black inverted triangle icon located at the right of the Tag to open the Tag window. Tags are additional labels that can be associated to point, paths, and devices. This allows you to describe the choices of devices based on characteristics such as manufacturer, associate/probing etc.
Rulesets
Rulesets are packaged set of rules that can be saved, stored, and reused when you require them. This allows frequently used groups of conditions to be saved for repeated application.
 to load a rule set. This option allows you to load the predefined rules. You can create a number of different rules and load them. A number of rules together creates a ruleset.
  to save the rule set. After creating rules, you can save them and load the rule when you require them.
Analysis Group Box
The Analysis group box allows you to perform different analysis on devices that pass through a building or environment. The Analysis group box displays the following:
–![]() Typical Locations—For more information on Typical Locations, see Typical Locations.
Typical Locations—For more information on Typical Locations, see Typical Locations.
–![]() Most Popular Paths—For more information on Most popular path analysis, see the Most Popular Paths Analysis.
Most Popular Paths—For more information on Most popular path analysis, see the Most Popular Paths Analysis.
–![]() Alternate Path Analysis—For more information on alternate path analysis, see the Alternative Path Analysis.
Alternate Path Analysis—For more information on alternate path analysis, see the Alternative Path Analysis.
–![]() Heat Maps—For more information on heat maps, see the Heat Maps.
Heat Maps—For more information on heat maps, see the Heat Maps.
- Advanced—Click the black inverted triangle icon to perform additional configuration for the analysis. The Advanced option is avialable only for Typical Locations and Most Popular Path analysis. If you select Typical locations as the analysis type, then the following is displayed:
–![]() Number of Locations—Enter the number of locations that you want to include in the analysis. A large number of locations for Typical location analysis results in a dense concentration of markers across an area.
Number of Locations—Enter the number of locations that you want to include in the analysis. A large number of locations for Typical location analysis results in a dense concentration of markers across an area.
–![]() Optimal—Select this check box if you want the number of locations to be determined mathematically according to which best represents the distribution of points found in the building.
Optimal—Select this check box if you want the number of locations to be determined mathematically according to which best represents the distribution of points found in the building.
If you select Most Popular path analysis from the Type drop-down list, then the following is displayed:
–![]() Number of Paths—Enter the number of popular paths that you want to include in the analysis.
Number of Paths—Enter the number of popular paths that you want to include in the analysis.
–![]() Method—The possible options are Actual and Markers. The Actual method displays every point on the path. The markers method eliminates close points being displayed. The default for common paths is that there are a fixed number of predefined points that the path can go through. The purpose of this method is to reduce the numer of visible nodes, by essentially combining nodes close together to make it more readable.
Method—The possible options are Actual and Markers. The Actual method displays every point on the path. The markers method eliminates close points being displayed. The default for common paths is that there are a fixed number of predefined points that the path can go through. The purpose of this method is to reduce the numer of visible nodes, by essentially combining nodes close together to make it more readable.
Note The Advanced option depends on the initial type of analysis that you have chosen.
Reporting tab
The CMX analytics reporting is necessary to monitor common behavioral patterns over time. A number of reports can be generated and it provides more zone oriented analysis on the patterns of behavior in different zones of the building as well as movements throughout the building. See the Reports section for more information.
Auxiliary Information Window
You can access the Auxiliary Information window at the top right corner of the page. The auxiliary information window provides access to the 2D and 3D navigation and visible overlays on the building or area when you are in the 3D or 2D environment. Click icon in the right pane and choose the additional information on the building or area for analysis. You can include additional information like switching floors on/off, layout of access points, and zones.
 Feedback