Information About Analysis
This chapter describes the different types of analysis that you can perform on devices in a building or environment. You can perform the following four types of analysis:
Typical Locations
The typical location analysis determines different areas of the building and measures the behavior of people within them. The location analysis is a way of segmenting all points detected into representative areas on which parameters are calculated.
The location analysis process starts by clustering all devices into areas determined by the geographical layout of observations. Each point is allocated to a particular area and each area is represented by a center point. Once the set of areas are established, all parameters associated with each area are calculated, that reflects the movement of people in that part of the building.
The result of carrying out a location analysis is a set of areas represented by center points indicating the spread of points over the Wi-Fi detected area.
The concept of areas and zones are different but they work together. You need to consider the following while defining areas and zones:
- Zone is a user-defined space with a name and it is used for reporting or for path rule purposes. The zones can be overlapping and need not cover the entire building, although every floor is also a zone.

Note Zones correspond to the coverage areas in the Prime Infrastructure.
- Areas are defined by mathematical clustering on the detected Wi-Fi based locations.
- Cluster areas are used when there is no known zones established or to ensure that all parts of the location space are accounted for.
- Each area is associated with a set of behavior parameters that are represented by icons.
There following are the different behavior measurements:
- Dwell Time— Dwell time or wait time is an estimate of the time, that a person is spending in an area as they move through the building.
- Crowding— Crowding is measured by the density of people within a particular area over a time period.
- Number of devices—This shows the number of unique MAC addresses identified in a particular area and is defined based on filtered conditions.
Analyzing Areas of the Building Using the Typical Locations Analysis
To analyze different areas of the building using the most popular paths analysis, follow these steps:
Step 1![]() In the Analysis group box, do the following:
In the Analysis group box, do the following:
- From the Building drop-down list, select the building where you want to conduct this analysis.
- From the Type drop-down list, choose Typical locations.
- Click the black inverted triangle icon located at the right of the Advanced option to configure the number of paths that you want to include in the analysis.
–![]() Enter the number of typical locations that you want to consider for analysis in the Number of Locations text box.
Enter the number of typical locations that you want to consider for analysis in the Number of Locations text box.
–![]() Select the Optimal check box to instruct the system to find the best number of locations for analysis.
Select the Optimal check box to instruct the system to find the best number of locations for analysis.
Step 2![]() You can apply the parameterized rules to your analysis from the Rules group box. See Rules Group Box for more information.box.
You can apply the parameterized rules to your analysis from the Rules group box. See Rules Group Box for more information.box.
Step 4![]() Click 3D Analytics to view the results in 3D environment or 2D to view the results in 2D environment.
Click 3D Analytics to view the results in 3D environment or 2D to view the results in 2D environment.
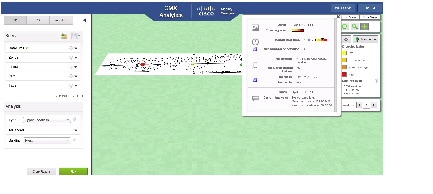
The following figure shows the density of people within a partucular area.
Figure 5-1 Density of People Within a Particular Area
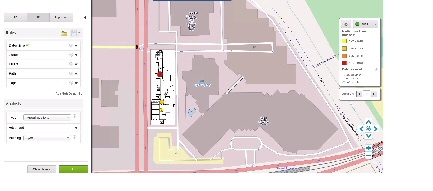
The following figure shows the distribution of median dwell times in the 2D map.
Figure 5-2 Distribution of Median Dwell Times
The following information is displayed when you click a particular node:
- Zones
- Crowding Index
- Median Dwell time
- Median absolute deviation
- Number of devices
- As % of all filtered devices
- No of visits
- Number of points
- Current analysis
Most Popular Paths Analysis
The most popular paths analysis analyses the behavior of devices or people as they move through the building. This analysis provides you with a set of typical paths taken by the devices on a particular day and time.
This analysis is carried out using the mathematical path clustering technique, that aggregates the paths into sets which are equivalent. Each resulting set is represented by an actual path and is shown graphically by a set of observed points linked by a straight line. The clustering allows you to identify the common routes that people usually take.
Note The CMX analytics application has a limit on the size of images that it can handle. This depends on the hardware, browser, and the device drivers present on your machine. Sometimes black floor plans are shown in the 3D environment. Google chrome on PC and Firefox on MAC seem most resilient. For better performance, keep the image files as small as necessary.
Analyzing Areas of the Building Using the Most Popular Paths Analysis
To analyze different areas of the building using the most popular paths analysis, follow these steps:
Step 1![]() In the Analysis group box, do the following:
In the Analysis group box, do the following:
- From the Building drop-down list, select the building where you want to conduct this analysis.
- From the Type drop-down list, choose Most Popular paths.
- Click the black inverted triangle icon located at the right of the Advanced option to configure the number of paths that you want to include in the analysis.
–![]() Enter the number of paths that you want to display in the analysis results in the Number of Paths text box.
Enter the number of paths that you want to display in the analysis results in the Number of Paths text box.
–![]() From the Method drop-down list, choose the method that you want to represent the paths before selecting the most popular path. The possible values are Markers and Actual.
From the Method drop-down list, choose the method that you want to represent the paths before selecting the most popular path. The possible values are Markers and Actual.
Step 2![]() You can apply the parameterized rules to your analysis from the Rules group box. See Rules Group Box for more information.
You can apply the parameterized rules to your analysis from the Rules group box. See Rules Group Box for more information.
Step 4![]() Click 3D Analytics to view the results in 3D environment or 2D to view the results in 2D environment.
Click 3D Analytics to view the results in 3D environment or 2D to view the results in 2D environment.
The most popular path presents you with a set of paths taken and the parameters associated with them in the right pane.
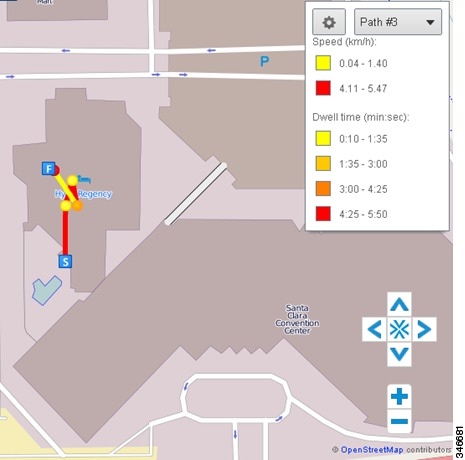
The following figure shows the third most popular paths across a shopping mall on a particular day and time in the 2D environment.
Figure 5-3 Most Popular Path Across One Floor in 2D Environment
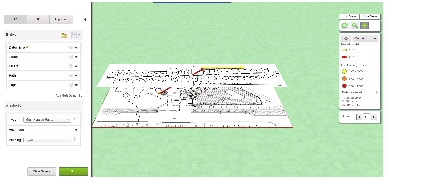
The following figure shows the most popular path between floors.
Figure 5-4 Most Popular Path Between Floors
To obtain information associated with the parameter, click the node or use the location selector from the Auxiliary Information window. The following information is displayed when you click a particular node:
- Number of paths in the cluster
- Overall distance travelled
- Number of point observations recorded along the path
- Time took to complete the particular path
- Average speed along the path (km/hr)
- Date and time of the first and the last recorded point on the path
The following are the parameters displayed for a particular point:
The following are the parameters displayed for a particular edge:
- Crow-files distance between the two points it joins
- Difference in time between two points
- Estimated speed between the two points
Alternative Path Analysis
The alternative path analysis allows you to determine the device flow between different areas in the building. It shows a break down of the percentage of devices going to each destinations for each starting point and vice versa. If a device visits multiple destinations after visiting a starting point, then only the first one is considered for the analysis.
This analysis helps you to understand the different paths that people take while leaving one point to go to another point. It also allows you to set up arbitrary areas and estimate the time it takes to move between those areas. This analysis starts by identifying all paths passing within a certain radius of a circle whose center is the source point.
Analyzing Areas of the Building Using the Alternative Path Analysis
To analyze different areas of the building using the alternative path analysis, follow these steps:
Step 1![]() In the Analysis group box, do the following:
In the Analysis group box, do the following:
- From the Type drop-down list, choose Alternative Path Analysis.
- From the Building drop-down list, choose the building that you want to consider for analysis.
Step 2![]() You can apply the parameterized rules to your analysis from the Rules group box. See Rules Group Box for more information.
You can apply the parameterized rules to your analysis from the Rules group box. See Rules Group Box for more information.
Note In order to run alternative path analysis, you need to define both starting point and destination points. You can define these points by clicking the map or building.
Step 3![]() In the Auxiliary Information window, do the following to define the starting and destination points:
In the Auxiliary Information window, do the following to define the starting and destination points:
- From the Floor drop-down list, choose the floor on which you want to define the starting and destination points.
- Enter the radius in the Radius text box. The radius specifies the catchment area of each point. The device should pass through the catchment area to be considered for analysis.
- Select the Start radio button and click the map to place the starting point.
- Select the Destination radio button and click the map to place the destination point.
Step 5![]() Click 3D Analytics to view the results in 3D environment or 2D to view the results in 2D environment.
Click 3D Analytics to view the results in 3D environment or 2D to view the results in 2D environment.
The alternative path presents you with a set of paths taken and the parameters associated with them in the right pane.
The following figure has three points that are placed across the building. There is one source node and two possible destination nodes.
Figure 5-5 Specifying Beacon Points for Alternative Path Analysis
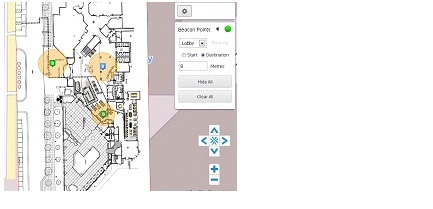
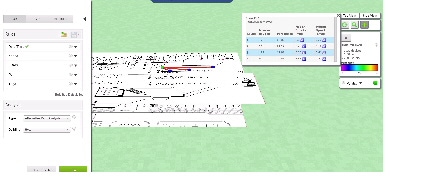
Figure 5-6 Alternative Path Analysis in 3D
The following information is displayed when you click a particular node to show the distribution of durations and speeds:
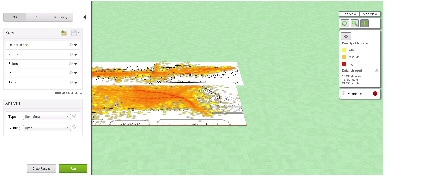
Heat Maps
The heat map is a graphical representation of data and allows you to view all selected data on the map. The areas where there is a greater presence of data is represented in darker colors. These patterns help to indicate the real coverage of the access points across a region.
Analyzing the Traffic For Each Floor Using the Heat Maps Analysis
To analyze the traffic for each floor using the heat maps analysis, follow these steps:
Step 1![]() In the Analysis group box, do the following:
In the Analysis group box, do the following:
- From the Building drop-down list, choose the building that you want to consider for analysis.
- From the Type drop-down list, choose Heat Maps.
Step 2![]() You can apply the parameterized rules to your analysis from the Rules group box. See Rules Group Box for more information.
You can apply the parameterized rules to your analysis from the Rules group box. See Rules Group Box for more information.
Step 4![]() Click 3D Analytics to view the results in 3D environment or 2D to view the results in 2D environment.
Click 3D Analytics to view the results in 3D environment or 2D to view the results in 2D environment.
The heat maps of the points for each floor is displayed in the right pane.
Figure 5-7 Heatmap Distribution of Number of Points
 Feedback