Managing Cisco CMX System Settings

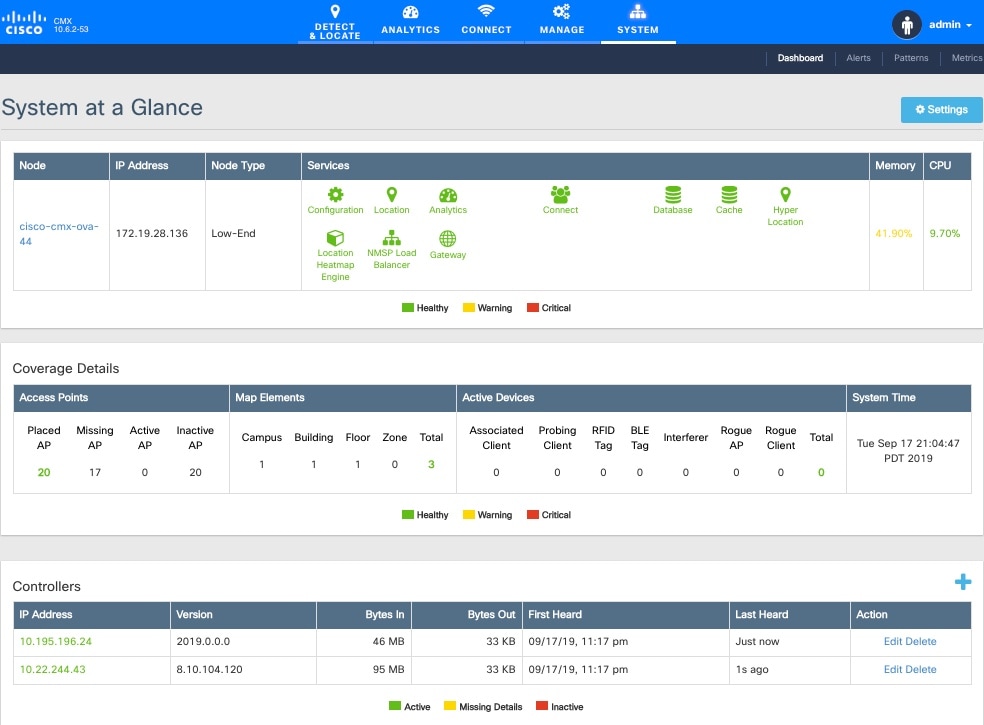
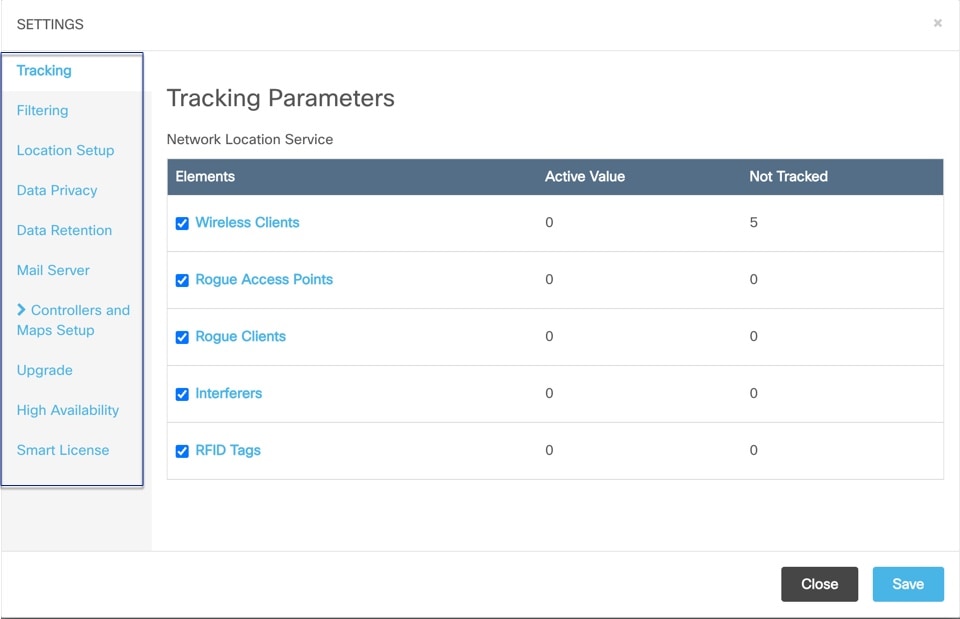
Overview of the System Service

The Cisco CMX System service comprises the following tabs, which help you perform a variety of system-related tasks, including, but not restricted to, those listed here:

  • Dashboard —Enables you to have an overall view of the system.
  • Alerts —Enables you to view live alerts.
  • Patterns —Enables you to detect patterns of various criteria, such as Client Count, CPU Usage, Memory Usage, and so on.
  • Metrics —Enables you to view system metrics.

Understanding the Node Table

The Node table in the System at a Glance window displays the following Cisco CMX node information:

  • Node —Lists all the associated Cisco CMX nodes.

  • IP Address—Shows the IP address of the Cisco CMX node.

  • Node Type—Shows the type of the Cisco CMX node.

  • Services —Lists all the services for each Cisco CMX node.

    • The colors of the icons pertaining to these services indicate the status of these services. Ensure that the services are in green color; this indicate a healthy status.

    • Click a service icon to view the corresponding service or system metrics.

  • Memory —Shows the load on the memory, in percentage.
  • CPU —Shows the load on the CPU, in percentage.

Understanding the Coverage Details Table

The Coverage Details table in the System at a Glance window displays the following information:

  • Access Points—Shows the number of access points placed on Cisco CMX map.

    • Placed AP—Shows the total count of access points placed on Cisco CMX map.

    • Missing AP—Shows the number of access point which has sent location details but not found on the map. This could impact the accuracy of the location.

    • Active AP—Shows the number of access point active for the last 24 hours. This helps to troubleshoot and determine if there are access points that are not placed on Cisco CMX map.

    • Inactive AP—Shows the number of inactive access points for the last 24 hours.

  • Map Elements—Shows the number of elements available on Cisco CMX map.

    • Campus—Shows the number of campuses in Cisco CMX.

    • Building—Shows the total number of buildings in Cisco CMX.

    • Floor—Shows the total number of floors in Cisco CMX.

    • Zone—Shows the total number of zones in Cisco CMX.

    • Total—Shows the summation of all the previous elements. This is the total elements in Cisco CMX .

  • Active Devices—Shows the number of active devices available on Cisco CMX map.

    • Associated Client—Shows the number of associated clients.

    • Probing Client—Shows the number of probing clients.

    • RFID Tag—Shows the number of active RFID tags.

    • Interferer—Shows the number of interferers.

    • Rogue AP—Shows the number of rogue access points.

    • Rogue Client—Shows the number of rogue clients.

    • BLE Tags—Shows the number of bluetooth devices.

    • Total—Shows the summation of all the previous devices.

  • System Time—Shows the current system time with the time zone set as on Cisco CMX system .

Understanding the Controllers Table

The Controllers table in the System at a Glance window lists the Cisco WLCs that are sending Network Mobility Services Protocol (NMSP) data to Cisco CMX. The table displays the following details for each Cisco WLC:

  • IP Address —The color of the table border to the left of each IP address indicates whether the Cisco WLC is active or not.

  • Version —Cisco WLC software version.

  • Bytes In and Bytes Out —Number of bytes received from and sent to the Cisco WLC.

  • First Heard—Number of seconds since the first communication received from the Cisco WLC.

  • Last Heard —Number of seconds since a communication was received from the Cisco WLC.

  • Action—Allows you to modify the details of an existing controller or delete an existing controller. Click Edit to edit the controller details in the Edit Controller window. Click the plus icon to view the Controllers and Map Setup tab details in the Settings window.


Note

The IP addresses of active contollers are shown in green. The IP addresees of inactive contorllers are shown in red.

Managing Dashboard Settings

The Settings option in the System at a Glance window enables you to manage the configurations and other settings related to Cisco CMX System service.

Setting Device Tracking Parameters

Procedure


Step 1

Log in to Cisco Cisco Mobile Connected Experiences (Cisco CMX).

Step 2

Choose System > Dashboard .

The System at a Glance window is displayed.
Step 3

Click Settings at the top-right corner of the window. The SETTINGS window is displayed.

By default, the Tracking Parameters tab is displayed.

Step 4

In the Elements column, check the check box of each device that you want to select for tracking.

Figure 1. Tracking Parameters

Only the elements selected here will be tracked by the network location service and will appear on the Activity Map window.

The following elements are available for tracking:

  • Wireless Clients

  • Rogue Access Points

  • Rogue Clients

  • Interferers

  • RFID Tags

  • BLE Tags

Note 

BLE capable APs are discovered by Cisco Prime Infrastructure. Use Cisco Prime Infrastructure to place the APs on the maps and export the maps. Cisco CMX will utilize the map file exported from Cisco Prime Infrastructure.

Bluetooth low energy (BLE) beacons are detected in two ways:

  • Clean air over NMSP—To enable this tracking method, check Interferers option. You require a Cisco WLC with software Release 8.0.115.0 or later for this method.

  • Fast path over UDP—To enable this tracking method, check BLE Beacons option. You require a Cisco WLC with software Release 8.6.1.146 or later for this method.

Step 5

Click Save.


Setting Filtering Parameters

Procedure


Step 1

Log in to Cisco Mobile Connected Experiences (Cisco CMX).

Step 2

Choose System > Dashboard .

The System at a Glance window is displayed.
Step 3

Click Settings at the top-right corner of the window.

Step 4

Click the Filtering tab.

Here, you can configure the following filtering parameters:

  • Duty Cycle Cutoff (Interferer) —This is a percentage value. Interferers with a Duty Cycle that is less than the specified cutoff will not be tracked.

  • RSSI Cutoff (Probing Only Clients) —This is the radio signal strength cutoff for filtering. The default is -85 dBm.

  • Exclude Probing Only Clients —Check this check box to filter out clients that are only probing. This is the best effort to stop detecting probing clients. However, a small percentage of probing clients may appear for short duration. So this should not be considered as complete probing client removal from the system. If you check this option, the Probing Client Filtering service is enabled on Cisco WLC and Cisco CMX will not receive any probing client information.

  • Enable Locally Administered MAC filtering —Check this check box to filter out self-assigned MAC addresses. This parameter is checked by default. This discards Apple iOS8 random MAC addresses.

  • Enable Location MAC Filtering —Check this check box to filter out specific MAC addresses. For example, you can use this to filter out MAC addresses of employees’ devices. After checking this, you can either specify a MAC address that you want to allow or disallow, or choose to allow, disallow, or delete previously entered MAC addresses.

  • Enable Location SSID Filtering—Check this check box so that the Location service excludes all visitor devices associated to a particular SSID.

    1. Click Enable SSID Filtering.

    2. Click Select SSID, and select a particular SSID. If no SSIDs appear in the list, make sure that a Cisco WLC is active, and then click Fetch SSIDs to refresh the list.

    3. Click Filter SSID to add the selected SSID to the filter list.

Step 5

Click Save.


Setting Location Calculation Parameters

Procedure


Step 1

Log in to Cisco Mobile Connected Experiences (Cisco CMX).

Step 2

Choose System > Dashboard .

The System at a Glance window is displayed.

Step 3

Click Settings at the top-right corner of the window.

The SETTINGS dialog box is displayed.

Step 4

Click the Location Setup tab.

Here, you can configure the following Location Calculation Parameters :

  • Enable OW Location—Check this check box to enable the use of Outer Walls (obstacles) for location calculation. The Calibration model includes information regarding the Walls. This setting controls whether the CMX should honor the walls while calculating the heatmaps or not.

  • Enable Location Filtering —Check this check box if you want the system to use previous location estimates for estimating the current location. This parameter will be applied only for client location calculation. Enabling this parameter reduces location jitter for stationary clients and improves location tracking for mobile clients. This parameter is enabled by default.

  • Use Default Heatmaps for Non Cisco Antennas —Check this check box to enable the usage of default heat maps for non-Cisco antennae during location calculation.

  • Chokepoint Usage —Check this check box to enable the usage of chokepoint proximity to determine the location of a device. This applies only to Cisco-compatible tags that are capable of reporting chokepoint proximity. This parameter is enabled by default.

  • Enable Hyperlocation/FastLocate/BLE Management—Check this check box to enable hyperlocation, fastlocate, and BLE management in Cisco CMX. This parameter is disabled by default.
    Note 

    This option will not be displayed if the system is not a large OVA installation. Hyperlocation requires a high end system to run and if run on lower system the option is hidden. For high end system (20 vCPU) and Bare metal (3365), Hyperlocation option is enabled by default and displayed in the GUI. For standard (16 vCPU) and low end system (8 vCPU), Hyperlocation option is hidden.

  • Optimize Latency—Check this check box to enable latency optimization. If you enable this option, Cisco CMX enables faster location computation over less data affecting accuracy due to not using the fully available data for computation. By default, this option is not enbaled. If not enabled, Cisco CMX will provide location updates at default intervals computed over full available data. If you check this option, the Relative discard RSSI time and Relative discard AoA time values will be changed to 30. You will not be able to edit these values. We recommend you to enable this option only if recommended by Cisco.

  • Use Chokepoints for Interfloor conflicts —Use this drop-down list to specify the frequency to determine the correct floor during interfloor conflicts.

  • Chokepoint Out of Range Timeout (secs) —After a Cisco-compatible tag leaves a chokepoint proximity range, RSSI information will be used again to determine the location only after this timeout value is exceeded. Specify a timeout value, in seconds, accordingly.

  • Relative discard RSSI time (secs)—Enter the time, in seconds, after which the RSSI measurement should be considered obsolete and discarded from use in location calculations. This time is from the most recent RSSI sample, and not an absolute time. For example, if this value is set to 3 minutes, and two samples are received at 10 minutes and 12 minutes, both the samples will be retained. However, an additional sample received at 15 minutes will be discarded. We recommend that you do not modify this parameter without the guidance of Cisco Technical Support.

  • Relative discard AoA time—Enter the time, in secondsß, after which the AoA mesaurement should be considered as obsolete and discarded from use in location calculations. We recommend that you do not modify this parameter without the guidance of Cisco Technical Support.

  • Absolute discard RSSI time —Enter the time, in minutes, after which the RSSI measurement should be considered obsolete and discarded from use in location calculations regardless of the most recent sample. We recommend that you do not modify this parameter without the guidance of Cisco Technical Support.

  • RSSI cutoff —Enter the RSSI cutoff value, in dBm, at which you want the server to discard AP measurements. We recommend that you do not modify this parameter without the guidance of Cisco Technical Support.

You can also set the following Movement Detection Parameters :

  • Individual RSSI change threshold —Enter a threshold, in dBm, beyond which you want individual RSSI movement recalculation to be triggered. We recommend that you do not modify this parameter without the guidance of Cisco Technical Support.

  • Aggregated RSSI change threshold —Specify the Aggregated RSSI movement recalculation trigger threshold. We recommend that you do not modify this parameter without the guidance of Cisco Technical Support.

  • Many new RSSI change percentage threshold —Specify the trigger threshold recalculation (as a percentage) for many new RSSI changes. We recommend that you do not modify this parameter without the guidance of Cisco Technical Support. This parameter indicates the threshold for comparing against the aggregated APs value. This compariosn will help you to decide whether the location computation is required.

  • Many missing RSSI percentage threshold —Specify the trigger threshold recalculation (as a percentage) for many missing RSSI changes. We recommend that you do not modify this parameter without the guidance of Cisco Technical Support.

You can set the following History Storage Parameters:

  • History Pruning Interval —Specify the number of days of client location history to be stored for the location maps.

Step 5

Click Save .


Configuring the Mail Server for Notifications

Procedure


Step 1

Log in to Cisco Mobile Connected Experiences (Cisco CMX).

Step 2

Choose System > Dashboard .

The System at a Glance window is displayed.

Step 3

Click Settings at the top-right corner of the window.

The Settings dialog box is displayed.

Step 4

Click the Mail Server tab.

Here, you can configure the following:

  • From Email Address —Email address of the mail server host.

  • To Email Address Address —Enter the email addresses to which the notifications should be sent. You can add multiple email addresses sepearted using the delimiters comma, semi-colon, and space.

  • Server —Mail server URL.

  • Port —Port number for the mails. The default is port 25.

  • Authentication —Option to enable or disable email authentication.

  • SSL —Option to enable or disable email security with Secure Sockets Layer (SSL) to prevent third parties from potentially viewing your email messages.

  • TLS —Option to enable or disable email secured with Transport Layer Security (TLS).

Step 5

To test your settings, click Save and Test Settings .

Step 6

Enter the email address and then click Send e-mail .

Step 7

Click Save to save your settings if the test is successful.


Importing Maps and Controllers into Cisco CMX

To import maps and controllers directly from Cisco Prime Infrastructure, do the following:

Before you begin

Ensure that while exporting maps from Prime, check the Include Calibration Information option. Cisco CMX will not be able to compute the location for network elements (Clients/ Interferers / Tags) for maps having no calibration information.

Import operation for map archive files will fail if Include Calibration Information option is not selected in the Prime Infrastructure while importing maps. While importing maps, ,the upload utility validates if the calibration model is available for each floor in the given maps archive file. If not available, map import will fail with an error message: 'Calibration model is missing in the uploaded map archive. Please select the option 'Include Calibration Information' on Prime Infrastructure GUI while exporting maps archive.

Procedure


Step 1

Log in to Cisco Mobile Connected Experiences (Cisco CMX).

Step 2

Choose System > Dashboard.

The System at a Glance window is displayed.

Step 3

Click Settings at the top-right corner of the window.

Step 4

Choose the Controllers and Maps Setup > Import tab, and enter the following parameters:

  1. Username—Username of the Cisco Prime Infrastructure server.

  2. Password—Password of the Cisco Prime Infrastructure server.

  3. IP Address—IP address of the Cisco Prime Infrastructure server. Ensure that the SNMP community string is properly configured in Cisco Prime Infrastructure.

  • To save the Cisco Prime Infrastructure credentials, check the Save Cisco Prime Credentials check box.

  • To override the existing maps that currently exist in Cisco CMX while importing, check the Delete & replace existing maps & analytics data check box.

  • To override the existing zones that currently exist in Cisco CMX while importing, check the Delete & replace existing zones check box.

Note 

We recommend exporting updated maps only from Cisco Prime Infrastructure. In addition, when importing updated maps to Cisco CMX, make sure the Delete & replace existing maps & analytics data check box and the Delete & replace existing zones check box are unchecked.

Step 5

Click Import Controllers and Maps.

Step 6

Click Save.


Importing Maps and Adding Controllers

You can manually import maps and add Cisco WLCs into Cisco CMX using the web interface.

Procedure

Step 1

Log in to Cisco Mobile Connected Experiences (Cisco CMX).

Step 2

Choose System > Dashboard .

The System at a Glance window is displayed.

Step 3

Click Settings at the top-right corner of the window.

Step 4

Choose the Conrollers and Maps Setup > Advanced tab.

Step 5

To manually import a map, perform the following:

  1. Under the Maps area, click Browse .

    The File Upload dialog box is displayed.

    Note 

    If you check the Delete & replace existing maps & analytics data check box , the maps existing in Cisco CMX will be replaced by the maps that you import from Cisco Prime Infrastructure. Existing zones are also removed when you override the maps.

    If you check the Delete & replace existing zones check box, the existing zones in Cisco CMX will be replaced by zones that you import from Cisco Prime Infrastructure.

    Ensure that while exporting maps from Prime, check the Include Calibration Information option. Cisco CMX will not be able to compute the location for network elements (Clients/ Interferers / Tags) for maps having no calibration information.

  2. Navigate to the location of the map file, select the map file, and then click Open .

  3. Click Upload .

  4. Click Save .

Step 6

To import a Cisco WLC, configure the following parameters under the Controllers area:

  1. Controller type—Choose from Cisco WLC or Unified WLC.

  2. IP address / Hostname—IP address or hostname of the Cisco WLC.

  3. Controller Version—(Optional) Software version of the Cisco WLC.

  4. Applicable Services—Check the CAS check box if Context Aware Service (CAS) is applicable.

  5. Controller SNMP version—Choose from v1, v2c, or v3.

  6. Controller SNMP Write Community—Enter the controller SNMP write Community string. The default is private.

  7. Click Add Controller.

    Note 
    If you are adding Unified WLC, ensure that SSH is enabled on the controller before adding it to Cisco CMX.
Step 7

Click Save.


Upgrading Cisco CMX

After you install Cisco CMX 10.2, future upgrades can be performed via the Cisco CMX GUI or by using the cmxos upgrade CLI command and the .cmx file, for example, cmxos upgrade <CISCO_CMX$$$.cmx>, while logged in as cmxadmin.

To upgrade Cisco CMX to a future release using the GUI, perform the following task:

Procedure


Step 1

Log in to Cisco Mobile Connected Experiences (Cisco CMX).

Step 2

Choose System > Dashboard .

The System at a Glance window is displayed.

Step 3

Click Settings at the top-right corner of the window.

Step 4

In the SETTINGS dialog box, click the Upgrade tab and then click Upgrade .

Step 5

Either choose a local .cmx file or point to the URL of the .cmx file

Before selecting the local file option, ensure that the .cmx file is available on the machine from which access to the web GUI is being made.

The upgrade process involves the following tasks:

  1. The .cmx file is copied to /opt/image/newimage.

  2. The cmxos upgrade command is executed in the background:

    • Services are stopped

    • New files are copied and configured

    • Services are restarted


What to do next

For more information about upgrading Cisco CMX using CLI, see Upgrading Cisco CMX Using CLI.

Enabling High Availability for Cisco CMX

High Availability (HA) is a simple and reliable failover mechanism. It helps Cisco CMX host and support multiple mobility applications seamlessly without any interruption.

The definition of servers described in this section are as follows:

  • Active Server—The Cisco CMX server that is actively serving traffic from the controllers. The virtual IP address (VIP) for the HA pair should point to the current active server. The VIP address is optional.

  • Primary Server—The Cisco CMX server that will be initially active in the HA pair.

  • Secondary Server—The CMX server that will be the backup or standby server in the HA pair.

Cisco CMX HA requires two servers. The primary server acts as the active Cisco CMX server. Cisco CMX server can use virtual IP addresses too. The primary Cisco CMX server is installed by selecting the Location or Presence node type. In an active HA deployment, data on the primary server will be continuously synchronized with the secondary server. If the primary server encounters any issues, the secondary server will take over the responsibility as the active server.

Install Cisco CMX Release 10.3.x on both the servers. From the web installer, choose either Presence or Location as the node type. Both the servers should have the same node type. After installation completes, each server is considered a standalone server and has the primary HA role. HA requires both primary and secondary servers, the role for one server needs to change. To change the HA role of a server from primary to secondary, use the cmxha secondary convert command in cmxadmin mode.

The Cisco CMX HA Admin interface is hosted on Cisco CMX port 4242 and can be accessed using http://cmx_ip_address:4242/. Log in to the web interface using cmxadmin as user ID and the password configured for cmxadmin during the primary and secondary server installation. This Cisco CMX HA Admin interface is different from the regular Cisco CMX interface that can be accessed at http://cmx_ip_address. Use the Cisco CMX HA Admin interface specifically monitoring and managing HA.

Every active Cisco CMX instance is backed by another (inactive) instance. The second CMX instance is not active until the failover procedure is initiated, either manually or automatically.

You can enable HA by using either Cisco CMX web UI or CLI.


Note

We recommend that you use the Cisco CMX web UI for HA configuration.


Tip

Cisco CMX High Availability documentation is embedded in the product. From the Cisco CMX user interface, choose Documentation from the drop-down list on the top-right corner.


Pre-requisites for HA

  • Both the primary and the secondary server should be of the same size and the same type (VM or physical appliance).

  • Both the primary and the secondary server should have the same Cisco CMX version.

  • Both the primary and the secondary server should be connected on the same subnet.

  • Both the primary and the secondary server should be connected on the same subnet if Layer 2 HA is required.

  • Both the primary and the secondary server should be IP connected with delay of less then 250ms if Layer 3 HA is used.

Enabling High Availability for Cisco CMX Using the Web UI

Procedure

Step 1

Log in to Cisco Connected Mobile Experiences (Cisco CMX).

Step 2

Choose System > Dashboard .

The System at a Glance window is displayed.

Step 3

Click Settings at the top-right corner of the window.

The Settings dialog box is displayed.

Step 4

Click the High Availability tab.

Step 5

Configure the following parameters:

  • Secondary IP Address—Enter the IP address of the secondary server. The primary server will be continuously synchronized with the secondary server. If the primary server encounters any issues, the secondary server will take over the responsibility as the active server.

  • Secondary Password—Enter the password for the cmxadmin user on the secondary server.

  • Use Virtual IP Address— By default, this option is checked. (If you do not check this option, the Virtual IP Address field is dimmed, and this address will not be used for HA configuration.)

    If you decide to retain the default, enter the corresponding virtual IP address.

  • Virtual IP Address—(Optional) Enter the virtual IP address for the HA pair if the Use Virtual IP Address check box is checked. .

  • Failover Type—From the Failover Type drop-down list, choose Auto or Manual.

    Note 

    If you choose Auto, Cisco CMX automatically fail over to the secondary server when a serious issue is detected. If you choose Manual, manual intervention is required to initiate failover from the web interface or command line. The failure will be reported via a notification, but no action will be taken.

  • Notification Email Address— Enter the email address to which HA notifications are to be sent. You can add multiple email addresses.

Step 6

To enable HA, click Enable.

Cisco CMX will verify the HA settings and start enabling HA between the primary and secondary servers.

Step 7

Click Save.

The initial synchronization of the primary and the secondary server takes time and the System at a Glance window displays the state as Primary Syncing while the synchronization is in progress. After the synchronization is complete, the primary server will be in the state Primary Active state. Also, after synchronization, an informational alert is generated in Cisco CMX and an email is sent to the addresses that have been provided, indicating that HA is enabled and synchronized successfully.

Tip 

Click the Help link in the top-right corner of the Settings dialog box to launch the HA online help. For more information about the HA installation process, see http://cmx_server/docs/ha/.


Enabling High Availability Using CLI

Procedure

Step 1

To enable HA using CLI, run the cmxha config enable command.

Step 2

Follow the command prompt and enter the HA parameters.

The HA options are similar to the ones available in Cisco CMX Web UI:

$ cmxha config enable

Are you sure you wish to enable high availability? [y/N]: y
Please enter secondary IP address: 192.0.2.250
Please enter the cmxadmin user password for secondary: 
Do you wish to use a virtual IP address? [y/N]: y
Please enter the virtual IP address: 192.0.2.251
Please enter failover type [manual|automatic]: automatic
Please enter an email address(es) for notifications (Use space, comma or semicolon to separate): email@cisco.com
Attempting to configure high availability with server: 192.0.2.250
Configuring primary server for HA
Configuring secondary server for HA
........................................................................
Synchronizing Postgres data from primary to secondary
.........
Synchronizing Cassandra data from primary to secondary
....................
Syncing primary files to secondary
Successfully started high availability. Primary is syncing with secondary.


Viewing Live System Alerts

Procedure


Step 1

Log in to Cisco Mobile Connected Experiences (Cisco CMX).

Step 2

Choose System > Alerts .

Step 3

In the Live Alerts window that is displayed, sort the alerts By Severity, By Node, or By Service, using the drop-down list at the top-right corner.

To dismiss an alert, in the Actions column adjacent the corresponding node name, click the Dismiss icon.


Viewing Patterns

The Patterns window shows the pattern of a specific feature, such as client count, unique devices, and so on over the week for a selected time period. For example, if you select client count for the last 1 month, it shows which days or times of the week had the most client counts in the last 1 month. The larger dots indicates a larger count for the specific feature. You can hover cursor over the dots to interpret the pattern details.

  • Client Count—Displays the total devices seen at a given time.

  • Location Calculation Time —Displays the average amount of time, in milliseconds, taken by the Location algorithm, to calculate a client's location.

  • CPU Usage —Displays the percentage of used CPU on a per-node basis.

  • Memory Usage —Displays the percentage of used memory on a per-node basis.

  • Redis Connections Received —Displays the total number of connections received by the cache service.

  • Locally Administered MAC count—Displays the total number of iOS devices.


Note

In Cisco CMX Release 10.2.3:

  • The following pattern details are no longer available: Incoming Rate, Dropped Notifications, and NMSP LB Read Operations.

  • In the Select Criteria drop-down list, the iOS8 Devices option is renamed to Locally Administered MAC count.


To view patterns:

Procedure


Step 1

Log in to Cisco Mobile Connected Experiences (Cisco CMX).

Step 2

Choose SYSTEM > Patterns .

The Patterns window is displayed.

Step 3

From the Select Criteria drop-down list, choose the criteria for which you want to view pattern data.

Step 4

From the Select Date Range drop-down list, choose the time frame for the criteria pattern.

Note 

By default, the pattern data is displayed for the last one week for all the nodes in the cluster. You can view the average for the days from Monday to Sunday at all times for the selected time frame.

Step 5

Optionally, from the Select Server drop-down list, choose the Cisco CMX node for which you want pattern data to be displayed. By default, the pattern data for all the Cisco CMX nodes in a cluster is displayed.


Understanding the Metrics Tab

The Metrics tab in the Cisco CMX System service enables you to view system metrics, database metrics, cache metrics, location metrics, and analytics notification mertics. Metrics information related to the following criterias are displayed:

  • System Summary

  • Node Mertics

  • Database Metrics

  • Cache Mertics

  • Location Metrics

  • Analytics Notification Metrics

Viewing System Summary Metrics

The System Summary Metrics window displays the following information:

  • Number of Active Clients

  • Number of NMSP messages processed by the system per second, in the last one minute

  • Overall CPU usage metrics

  • Overall memory usage metrics

  • Overall disk usage metrics

Procedure


Step 1

Log in to Cisco Mobile Connected Experiences (Cisco CMX).

Step 2

Choose SYSTEM > Metrics .

The System Summary tab in the left pane is selected by default, and the corresponding details are displayed.


Viewing System Summary Metrics Using the Dashboard

Alternatively, to view the System Summary metrics from the Dashboard:

Procedure

Step 1

Log in to Cisco Mobile Connected Experiences (Cisco CMX).

Step 2

Choose SYSTEM > Dashboard .

The System at a Glance window is displayed.

Step 3

In the Services column, click the Configuration, Location Heatmap Engine, NMSP Load Balancer, or Proxy icon to view the corresponding System Summary metrics.

Note 

Hover your cursor over the metrics and graphs for descriptions and details.


Viewing CMX Node Metrics

The CMX Node Metrics window for a Cisco CMX node displays the following information:

  • Number of active clients

  • Location latency time

  • Number of incoming and outgoing NMSP messages

  • Number of Controllers

  • CPU uesage metrics for each service

  • Memory usage metrics for each service

  • Disk IO metrics

  • Disk usage metrics

  • redis-iops

  • jdbc-iops

  • redis-errors

  • jdbc-errors

To view the Node metrics for a Cisco CMX node:

Procedure


Step 1

Log in to Cisco Mobile Connected Experiences (Cisco CMX).

Step 2

Choose SYSTEM > Metrics .

Step 3

In the left pane, click a Cisco CMX node name to view the metrics for that node.


Viewing CMX Node Metrics Using the Dashboard

Alternatively, to view the node metrics from the Dashboard:

Procedure

Step 1

Log in to Cisco Mobile Connected Experiences (Cisco CMX).

Step 2

Choose SYSTEM > Dashboard .

The System at a Glance window is displayed.

Step 3

In the Node column, click a Cisco CMX node name to view the metric details for that node.

Note 

Hover your cursor over the metrics and graphs for descriptions and details.


Viewing Database Metrics

The Database Metrics window displays the following metrics:

  • Databse Size—Shows the active memory used by the Cassandra and Postgres database.

To view the Database metrics:

Procedure


Step 1

Log in to Cisco Mobile Connected Experiences (Cisco CMX).

Step 2

Choose SYSTEM > Metrics.

Step 3

In the left pane, click Database Metrics.

Note 
Hover your cursor over the Database metrics graph for descriptions and details regarding the database usage.

Viewing Database Metrics Using the Dashboard

Alternatively, to view the database metrics from the Dashboard:

Procedure

Step 1

Log in to Cisco Mobile Connected Experiences (Cisco CMX).

Step 2

Choose SYSTEM > Dashboard .

The System at a Glance window is displayed.

Step 3

In the Services column, click the Database icon.

Note 
Hover your cursor over the metrics and graphs for descriptions and details.

Viewing Cache Metrics

The Cache Metrics window displays the following metrics:

  • Blocked connections—Shows the number of clients pending on a blocking call to finish.

  • Connected clients—Shows the number of client connections in use.

  • Used memory—Shows the total number of bytes allocated by Redis using its allocator .

  • Evicted keys—Shows the number of evicted keys due to maxmemory limit.

To view the Cache metrics:

Procedure


Step 1

Log in to Cisco Mobile Connected Experiences (Cisco CMX).

Step 2

Choose SYSTEM > Metrics .

Step 3

In the left menu, click Cache Metrics .


Viewing Cache Metrics Using the Dashboard

Alternatively, to view the Cache metrics from the Dashboard:

Procedure

Step 1

Log in to Cisco Mobile Connected Experiences (Cisco CMX).

Step 2

Choose SYSTEM > Dashboard .

The System at a Glance window is displayed.

Step 3

In the Services column, click the Cache icon.

Note 
Hover your cursor over the metrics and graphs for descriptions and details.

Viewing Location Metrics

The Location Metrics window displays the following metrics for each Cisco CMX node:
  • Location Counts—The total computations done per second.

  • Location Times—The location calculation time includes the mathematical portion of the location computation, and in most cases, is about 10 to 20 milliseconds. The location latency is the total time of latency computation from when the message comes from NMSPLB, to location, aggregation, creating cache, and calculation.

  • Location and Nmsplb Location and Nmsplb—The rate of Network Mobility Service Protocol (NMSP) messages coming in to the NMSPLB.

  • Hyperlocation Rates—The rate of incoming hyperlocation messages.

  • Location Computation—The chart for location computation.

To view the Location metrics:

Procedure


Step 1

Log in to Cisco Mobile Connected Experiences (Cisco CMX).

Step 2

Choose SYSTEM > Metrics .

Step 3

In the left pane, click Location Metrics .


Viewing Location Metrics Using the Dashboard

Alternatively, to view the Location metrics from the Dashboard:

Procedure

Step 1

Log in to Cisco Mobile Connected Experiences (Cisco CMX).

Step 2

Choose SYSTEM > Dashboard .

The System at a Glance window is displayed.

Step 3

In the Services column, click the Location icon.

Note 
Hover your cursor over the metrics and graphs for descriptions and details.

Viewing Analytics Notification Metrics

The Analytics Notification Metrics window shows the most important performance indicators relating to the Analytics service. A notification is sent from the Location service to the Analytics service when significant movement is detected from a device. Each notification contains an update on the location of a single device.

The Analytics Notification Metrics window displays the following metrics for each Cisco CMX node:

  • Notification processing time —The average time taken to process an incoming notification. This time will depend on a number of factors, but most notably, the size of the network, that is, the number of buildings, floors, zones, tags, and so on. This metric is relatively stable although you can expect peaks when the system is starting up.

  • Notification queue size —The size of the queue for incoming notifications, which are queued before being processed. Depending on the system load, the Location service will send the notifications in batches. Therefore, you can always expect a queue of size greater than 0. This mechanism may also result in a very irregular graph at some zoom levels, that is, one with many ups and downs. This is the expected behavior. The queue size is expected to rise when the incoming rate increases. If it continues to grow, you will begin to see dropped notifications in the Notification dropped rate metric

  • Notification dropped rate —The size of the queue for incoming notifications is limited. Hence, if the queue gets too big, notifications will be rejected. The Notification dropped rate graph shows how many notifications are rejected per second. Ideally, you require this chart to show a flat line of 0. If it does not show 0, you should consider adding another server to the cluster for running the Analytics service. This will distribute the load over the two servers.

  • Notification incoming rate —This is the number of notifications received by the Analytics service per second. This trend should roughly equal the client count, that is, the more clients are detected by the Location service, the more notifications are expected. However, the trend is also influenced by the clients' movement rates because notifications are only sent when the location of a device changes.

To view the Analytics Notification metrics:

Procedure


Step 1

Log in to Cisco Mobile Connected Experiences (Cisco CMX).

Step 2

Choose SYSTEM > Metrics .

Step 3

In the left pane, click Analytics Notification Metrics .


Viewing Analytics Notification Metrics Using the Dashbaord

Alternatively, to view the Analytics Notification metrics from the Dashboard:

Procedure

Step 1

Log in to Cisco Mobile Connected Experiences (Cisco CMX).

Step 2

Choose SYSTEM > Dashboard .

The System at a Glance window is displayed.

Step 3

In the Services column, click the Analytics icon.

Note 
Hover your cursor over the metrics and graphs for descriptions and details.

Viewing Presence Metrics

The Presence Metrics window displays the following metrics:

  • Presence Counts

  • Presence Rates

To view the Presence metrics:

Procedure


Step 1

Log in to Cisco Mobile Connected Experiences (Cisco CMX).

Step 2

Choose SYSTEM > Metrics .

Step 3

In the left pane, click Presence Metrics .