Health and Performance Monitoring

The Health and Performance Monitor (HPM) application lets you monitor key health and performance data for ASA devices, IPS devices, and VPN services by providing network-level visibility into device status and traffic information.

A variety of views are provided—All Devices, Firewall Devices, IPS Devices, VPN Summary, and so on—and you can create your own customized views. A configurable listing of device alerts is also available.

This ability to monitor key network and device metrics lets you quickly detect and resolve device malfunctions and bottlenecks in the network.

This chapter contains the following topics:

Health and Performance Monitor Overview

The Health and Performance Monitor is a stand-alone application that you can launch from the other stand-alone Security Manager applications (Dashboard, Configuration Manager, Event Viewer, Report Manager, and Image Manager) or from the Cisco Security Manager Client login screen accessed from the Windows Start menu.

The HPM application complements the Event Viewer and Report Manager applications, as follows:

  • Event Viewer – Monitors your network for syslog (system log) events from ASA and FWSM devices and their security contexts, and for SDEE (Secure Device Event Exchange) events from IPS devices and virtual sensors. These events include firewall traffic information, NAT events, failover events, IPS alerts, and so on. Event Viewer collects and displays this information, organized into a variety of views. See Introduction to Event Viewer Capabilities for more information.

  • Report Manager – Collects, displays and exports network usage and security information for ASA and IPS devices, and for remote-access IPsec and SSL VPNs. These reports aggregate security data such as top sources, destinations, attackers, victims, as well as security information such as top bandwidth, duration, and throughput users. Data is also aggregated for hourly, daily, and monthly periods. See Understanding Report Management for more information.

  • Health and Performance Monitor (HPM) – Monitors and displays key health, performance and VPN data for ASA and IPS devices in your network. This information includes critical and non-critical issues, such as memory usage, interface status, dropped packets, tunnel status, and so on. You also can categorize devices for normal or priority monitoring, and set different alert rules for the priority devices.

You can add notes to displayed alerts, you can “acknowledge” them, and you can clear them. When an alert is cleared, it is removed from the Alerts display; however, the alert information is retained in a database for 30 days. See Alerts: Acknowledging and Clearing for more information about adding notes, and acknowledging and clearing alerts.


Note

You can use the Alerts History window to access and view previously cleared alerts, as described in Alerts: History.

This section contains the following topics:

Trend Information

The Health and Performance Monitor periodically polls monitored devices for status and performance data. This information is used for alert generation, and to display real-time views and historical trends based on aggregated data.

Trends are displayed graphically for a specific set of metrics. Each trend for the currently selected device is represented as a graph generated for a chosen time interval. Comparing current values with the weekly averages for CPU and memory usage, for example, can provide an operational context for the selected device. Available trend intervals for monitored devices are one hour, 24 hours, and one week.

Metrics used for generating trends include:

  • CPU usage

  • Memory usage (only for single-context devices)

  • Connections per second (firewall devices)

  • Translations per second (firewall devices)

  • Inspection load (IPS devices)

  • Missed packets as a percentage (IPS devices)

  • Number of VPN tunnels

  • Number of RA VPN sessions

  • Total VPN throughput

  • Firewall throughput

  • Total dropped packets (firewall interfaces)

For additional graphical information about the health and performance of a specific device, you can launch the related device manager by right-clicking the entry for a device, a cluster node, or the system context for a multi-context device, and then choosing Device Manager from the pop-up menu. See Starting Device Managers for more information about the device managers.

Monitoring Multiple Contexts

The Health and Performance Monitor can monitor single- and multiple-context ASA devices. For multiple-context devices, each context is monitored and displayed as if it was a separate device.

Each context will be polled separately for all applicable metrics, with HPM polling a maximum of five contexts at a time from any given device. For devices with more than five contexts, data will be acquired from each successive batch of five contexts, with each batch being polled progressively during successive polling cycles. This means that all contexts may not be updated at the same time.

For multiple-context devices, basic device health—memory usage, device status, and so on—is monitored only on the physical device (that is, from the system context), while traffic data—number of connections, number of translations, dropped packets and so on—are monitored at context level.

For virtual contexts, CPU usage data are used only for pattern analysis, not for alert generation. Only interface-status alerts will be generated for virtual contexts.
HPM Access Control

The privileges assigned to your user name control what you can do in Health and Performance Monitor. If you use local users, or other types of non-ACS access control, then all users have access to HPM. However, the following access limits are imposed:

  • You must have system administrator privileges to enable or disable Health and Performance Monitoring in Security Manager, as described in Health and Performance Monitor Page.

  • You must have system administrator, network administrator, or approver privileges to select or deselect devices for monitoring, as described in Managing Monitored Devices.

  • You also must have system administrator, network administrator, or approver privileges to configure alerts and notifications, as described in Alerts: Configuring.

If you use ACS to control access to Security Manager, you can also control the following:

  • You can control access to the Health and Performance Monitor application using the View > Health and Performance Monitor privilege (part of Role Management in ACS). Using this privilege, you could prevent certain users from accessing HPM, or create roles that allow access to HPM without allowing access to Event Viewer or Report Manager. All default ACS roles are permitted to use the Health and Performance Monitor application.

  • Use the Modify > Policies > HPM Monitoring privilege to control which users can select and deselect the devices that are monitored (see Managing Monitored Devices), configure alerts and notifications (see Alerts: Configuring), and annotate and acknowledge alerts (see Alerts: Acknowledging and Clearing). All default ACS roles except Help Desk and Super Admin have this permission.

  • Users can view health and performance information for a device only if they have at least View privileges for the device.

  • You can control access to the Health and Performance Monitoring administrative settings page (in Security Manager’s Configuration Manager) where HPM is enabled or disabled, as described inHealth and Performance Monitor Page. The user must have the Modify > Policies > HPM Admin privilege to access this page (or any other administrative settings page). All default ACS roles except Help Desk can view the page, but only System Administrators can change the setting.

For information on integrating Security Manager with Cisco Secure ACS, see the Installation Guide for Cisco Security Manager .

Preparing for Health and Performance Monitoring

In order to use the Health and Performance Monitor (HPM), you must configure Security Manager, enable the HPM application, and configure device monitoring, as follows:

  • Basic Threat Detection must be enabled on ASA 8.0+ devices in order to monitor metrics such as ACL Dropped Packets, Scanning Threat Dropped Packets, Inspection Dropped Packets, and Syn Attack Dropped Packets. (Basic Threat Detection is enabled by default on these ASA devices.)

  • To receive alert notifications via email, you must have configured the SMTP server and administrator email ID on the System Preferences page of the Security Manager server. See the Installation Guide for Cisco Security Manager for more information. (Specifying email addresses for alert notifications from the Health and Performance Monitor application is described in Alerts: Configuring.)

  • Health and Performance Monitoring must be enabled in Security Manager, as described in Health and Performance Monitor Page.

  • In HPM, specify the devices to be monitored, in both Normal and Priority modes, as described in Managing Monitored Devices.


Note

To prevent read time-outs for ASAs, those devices must be configured to use only certain SSL/TLS protocol versions when acting as a server, as described in Setting Up SSL (HTTPS) on PIX Firewall, ASA and FWSM Devices.
  • Enable and configure the device threshold values and state-change rules that define when alerts and email notifications are triggered. This process is described in Alerts: Configuring.


Note

We also recommend configuring monitored devices to use a Network Time Protocol (NTP) server for synchronized timing. See NTP Page for more information.

After you have completed these steps, HPM begins polling the specified devices and displays health information and alerts.

Launching the Health and Performance Monitor

Use the Health and Performance Monitor (HPM) to view status information and alerts collected from monitored firewall and IPS devices across your network. For more information about selecting devices for monitoring, see Managing Monitored Devices.

To launch HPM, do any one of the following:

  • Choose All Programs > Cisco Security Manager Client > Cisco Security Manager Client from the Windows Start menu (your command path may differ slightly), and then select Health and Performance Monitor as the Default View during login.

  • Choose Launch > Health and Performance Monitor from the Configuration Manager, Event Viewer, Image Manager, or Report Manager applications.

  • Click the Health and Performance Monitor button on the quick-launch toolbar in the Configuration Manager or Image Manager window.

If you are currently not logged into a Security Manager application, you are prompted to log in. (For more information about starting and logging into a Security Manager client application, see Logging In to and Exiting Security Manager). Otherwise, the HPM Window is opened using the same user account you used to log into the other application.


Note

As described above, you can “cross-launch” HPM from any of the other Security Manager client applications. You can similarly cross-launch any of the other client applications from Health and Performance Monitor by choosing the desired application from the Launch menu, or clicking the appropriate quick-launch button.

Managing Monitored Devices

The HPM device selector is used to add and remove devices from both the “normal” and “priority” monitoring lists. You can also use the device selector to transfer devices between the two lists.


Note

After enabling a device for monitoring in HPM, it can take up to 5 minutes for priority devices and 10 minutes for non-priority devices before actual values for HPM parameters can be seen in the device summary.

To use the HPM device selector:

Procedure


Step 1

Choose Device Selector from the Tools menu to open the device selector window; the device-management screen is displayed.

The All Devices section on the left lists all ASA and IPS devices in the Security Manager inventory that can be monitored. (For example. HPM supports monitoring of version 7.0.1 and later IPS sensors only. Earlier IPS versions are not displayed in the device selector.)

All devices currently assigned to the Normal monitoring list and the Priority monitoring list are displayed in the two sections on the right side of the window.

Step 2

To add a device to the Normal list, select the device in the All Devices list and then click the > button between the All Devices list and the Normal Monitored Devices list.

The procedure for moving a device to the Priority Monitored Devices list is the same: use the > button between the All Devices list and that list.

Step 3

To remove a device from either Monitored list, returning it to the All Devices list, select the device and then click the appropriate < button.

Step 4

To transfer a device from one Monitored list to the other, highlight that entry and click the Up or Down button to move it to the upper or lower list respectively.

Step 5

Click Next at the bottom of the window to display the VPN-selector screen.

All monitored devices and their individual contexts, if any, are listed; each entry includes a checkbox for remote-access (RA) and one for site-to-site (S2S) VPN selection.

Note 
Starting from Cisco Security Manager 4.10, all the contexts for ASA 9.5(2) and above will be listed in the Device Selector. From the Device Selector, you can now monitor the RA and site-to-site VPN for all user contexts by enabling the corresponding check box.

You can use the List Filter field on this page to filter the list, as described in Using The List Filter Fields.

Step 6

Select the types of VPN to be monitored on specific devices by checking the appropriate boxes.

Step 7

Click Save to save and apply your changes, and close the device selector.


HPM Window

The Health and Performance Monitor (HPM) application window is where you view status information and alerts collected from monitored firewall and IPS devices, as well as remote-access (RA) and site-to-site (S2S) VPN information, across your network.


Note

See Managing Monitored Devices for information about specifying the devices to be monitored.

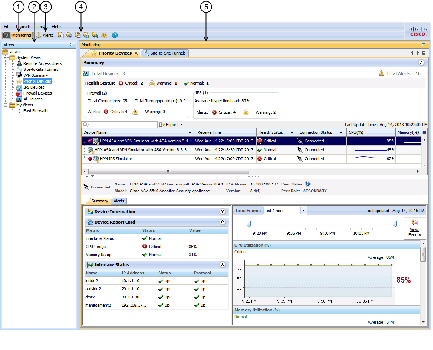
The following illustration presents the primary features of the HPM window.

Figure 1. Health and Performance Monitor Window

This image is not available in preview/cisco.com

Health and Performance Monitor Window

1

Monitoring button.

4

Quick-launch buttons.

2

Views

5

Monitoring/Alerts display area.

3

Alerts button.

The HPM window consists of three main elements:

  • Monitoring button (1) – Click this button to view device and VPN health and performance data. See HPM Window: Monitoring Display for more information.

  • Views (2) - When in the Monitoring view, the left pane of the HPM main window displays a list of available views. SeeManaging Device Views for more information.

as shown in the following illustration.

  • Alerts button (3) – Click this button to view a table of alerts in the window’s display area. See HPM Window: Alerts Display for more information.

  • Quick-launch buttons (4) – Click any button to cross-launch the related Security Manager client application.

  • Monitoring/Alerts display area (5) – This section of the window displays either Monitoring information for devices and VPNs, or a table of alerts generated by monitored devices. The Monitoring and Alerts buttons are used to switch back and forth between these two displays.

Working with Table Columns

You can customize the different tables of information presented in HPM as follows:

  • Sort a table such entries in a particular column are in ascending or descending order.

    • Click a column heading—anywhere but on a drop-down menu button—to sort the table such that the column entries are in ascending order (indicated by a small grey up-arrow).

    • Click the heading again to sort the entries are in descending order (indicated by a small grey down-arrow).

    • Click the heading again to return the table to its original order of display (the direction icon is removed).

  • Hide and show various columns; the columns available for display depend on the particular table.

  • Apply a column filter, meaning the table displays only entries that fit the specified criteria.

This section contains the following topics:

Showing and Hiding Table Columns

You can customize the different tables presented in HPM by hiding and showing various columns of information; the columns available for display depend on the particular table.


Note

The column headings are menus that you can use to further filter the table by hiding or showing entries according to chosen parameters, as described in Column-based Filtering.

To show or hide specific columns displayed for a table:

  1. Click the Columns button on the right side of the column headings to open the Choose Columns to Display dialog box.

All columns available for the current view are listed.

  1. Select and deselect the columns to be shown and hidden.

  2. Click OK to close the dialog box.

Only the selected columns are displayed for this table.

The following topics describe the individual columns available for various tables:

Table Columns: Device-related Views

You can customize the tables presented in the Monitoring pane for the device-related views by hiding and showing various columns of information; the columns available for display depend on the particular view.

The order of the entries in the Choose Columns to Display dialog box reflects the ordering of the columns when displayed. (However, the ordering of the rows in the following table does not necessarily reflect ordering of the columns as displayed.) See Showing and Hiding Table Columns for information about opening the Choose Columns to Display dialog box.

The following table presents all available data columns for the device-related Monitoring views: Priority Devices, IPS Devices, Firewall Devices, All Devices, and all custom views based on these system views. Some of the listed columns are not available for specific views, as indicated.

Table 1. Available Table Columns for Device-related Views

Column Name

Available in View

Description

Device Name

IPS, Firewall

Name assigned to the device; that is, the Host Name as defined on the Device Properties: General Page of the Device Properties window. Column-based Filtering is available.

The Name is preceded by an icon indicating device type. This icon in turn may be preceded by a device-alerts indicator: a red dot indicates one or more critical alerts (and possibly warnings), while a yellow dot indicates one or more warnings only. The area is blank for a device with no alerts.

You can “hover” the mouse pointer over the dot to view a pop-up displaying the number of critical alerts and the number of warnings on the device.

A gold star is added to the device icon itself to indicate Priority monitoring.

Receive Time

IPS, Firewall

Poll date and time for this entry (format is: day-of-week MMM DD HH:MM:SS your-time-zone YYYY).

IP Address

IPS, Firewall

IP address of this device. Column-based Filtering is available.

Health Status

IPS, Firewall

Current overall health of the device: Critical, Warning, or Normal. Column-based Filtering is available.

Note 
Overall health is defined by the most critical of any of the health metrics. For instance, if all the selected metrics on the device are normal except for one that is critical, overall device health becomes critical.

Connection Status

IPS, Firewall

Indicates HPM’s ability to connect to/poll the device: Connected, Authentication Error, Certificate Mismatch Error, Connection error, Timeout during Read operation, or Service unavailable. Column-based Filtering is available.

Note 
If the device is not selected as a Normal or Priority Monitored Device in HPM (Tools > Device Selector), this status will not apply. Changes to Monitored Device selection may take several minutes to become effective and be reflected on screen.

Any information displayed for a non-"Connected" device is from the indicated Receive Time, prior to connection failure.

Memory (%)

IPS, Firewall

Memory usage as a percentage of the total available.

CPU (%)

IPS, Firewall

CPU usage as a percentage of the total available.

Model

IPS, Firewall

Device type and model number. For example, ASA 5510, or IPS 4270.

Version

IPS, Firewall

Software version running on this device. Column-based Filtering is available.

Inspection Load (%)

IPS

Inspection load on the device when polled, as a percentage.

Missed Packet(%)

IPS

Dropped packets as a percentage of total packets inspected.

Sensor App Status

IPS

Current Sensor App (Analysis Engine) status: Up or Down. Column-based Filtering is available.

Main App Status

IPS

Current Main App status: Up or Down. Column-based Filtering is available.

Collaboration App Status

IPS

Current Collaboration App status: Up or Down.

License Expiration Status

IPS

Status of the sensor’s license, based on red and yellow threshold values set on the sensor: Normal, Warning, or Critical. Column-based Filtering is available.

In Bypass Mode

IPS

Whether bypass mode is enabled on the sensor: Yes or No. Column-based Filtering is available.

Event Retrieval Status

IPS

Status of the IPS event retrieval: Normal, Warning, or Critical. Column-based Filtering is available.

Global Correlation Status

IPS

For a sensor participating in global correlation, its update status: Normal (last update was successful), Warning (no successful update within the past day [86,400 seconds]), or Critical (no successful update within the last three days [259,200 seconds]). Column-based Filteringis available.

Signature Update

IPS

The number of the most recent signature update applied to this sensor; for example, S574. Column-based Filtering is available.

Firewall Mode

Firewall

Operating mode of this device: Routed, Transparent, or Mixed. Column-based Filtering is available.

Context Mode

Firewall

Context mode of this device: Single or Multiple. Column-based Filtering is available.

Connections

Firewall

Number of active connections when device was polled.

Xlates

Firewall

Address translation counter.

Connections/second

Firewall

Number of connections established per second.

Translations/second

Firewall

Number of translations per second.

Failover Status

Firewall

If this device is part of a failover pair, its current state: Active or Standby. Column-based Filtering is available.

Failover Host Role

Firewall

If this device is part of a failover pair, its current role: Primary or Secondary. Column-based Filtering is available.

Failover Peer Role

Firewall

If this device is part of a failover pair, current role of its peer device: Primary or Secondary. Column-based Filtering is available.

Failover Peer Status

Firewall

If this device is part of a failover pair, current status of its peer: Active or Standby Ready. Column-based Filtering is available.

Used Memory (MB)

Firewall

Amount of memory (in megabytes) in use when device was polled. Column-based Filtering is available.

Free Memory (MB)

Firewall

Amount of memory available (in megabytes) when device was polled. Column-based Filtering is available.

Max. Connections

Firewall

Peak number of connections. Not available for ASA clusters.

Max. Xlates

Firewall

Peak number of address translations. Not available for ASA clusters.

Throughput (Kbps)

Firewall

Average device throughput in kilobits per second. For an ASA 9.0+ cluster, this the total throughput for all interfaces in the cluster.

ACL Dropped Packets

Firewall

The number of packets dropped because they failed an access control list rule. Available only at cluster level for ASA clusters; not available for individual nodes.

Scanning Threat Dropped Packets

Firewall

If scanning threat detection is enabled, the number of packets dropped because they failed scanning threat inspection. If not enabled, “NA” is displayed. Available only at cluster level for ASA clusters; not available for individual nodes.

Inspection Dropped Packets

Firewall

If application inspection is enabled, the number of packets dropped because they failed application inspection. If not enabled, “NA” is displayed. Available only at cluster level for ASA clusters; not available for individual nodes.

Syn Attack Dropped Packets

Firewall

Number of packets dropped because of SYN flooding. Available only at cluster level for ASA clusters; not available for individual nodes.

Total Interface Dropped Packets

Firewall

Total number of dropped packets on all interfaces. Available only at cluster level for ASA clusters; not available for individual nodes.

Note 
You can view the number of per-interface dropped packets on the tabbed Interface panel presented in the detail section for the selected device.

Analysis Engine Memory (%)

IPS

Percentage of memory assigned to the Analysis Engine currently in use.

Role in Cluster

Firewall

The role of this member of an ASA load-balancing cluster: Cluster, Master, or Slave.

A cluster is managed by Security Manager as a single device with multiple nodes. Thus, each cluster is displayed in HPM as single entry, which you can expand in order to view a list of nodes.

* All of these columns are available in the All Devices and Priority Devices views.

Table Columns: VPN-related Views

You can customize the tables presented in the Monitoring pane for the VPN-related views by hiding and showing various columns of information; the columns available for display depend on the particular view.

The order of the entries in the Choose Columns to Display dialog box reflects the ordering of the columns when displayed. (However, the ordering of the rows in the following table does not necessarily reflect ordering of the columns as displayed.) See Showing and Hiding Table Columns for information about opening the Choose Columns to Display dialog box.

The following table presents all available data columns for the VPN-related Monitoring views: Remote Access Users (RA), Site-to-Site Tunnels (S2S), VPN Summary, and all custom views based on these system views. Some of the listed columns are not available for specific views, as indicated.

When a device sends trap message, Cisco Security Manager captures the trap and posts it to the Site to Site Tunnels page in Health and Performance Monitoring application. Till Cisco Security Manager version 4.16, devices used to send the trap messages over IPv4 only. Beginning with Cisco Security Manager 4.17, the SNMP traps are captured using IPv6. Thus, Cisco Security Manager receives the trap messages; maps the IPv6 address of the device to the device details; displays an alert about the trap in Site to Site Tunnels page of the Health and Performance Monitoring application. The status is displayed in the Health and Performance Monitoring application after couple of refresh cycles.


Note

Beginning with Security Manager version 4.9, the Health and Performance Monitoring application monitors and displays the site-to-site tunnels that have IPv6 address configured, in addition to the IPv4 based tunnels. Also the Email and Trap notifications now contain IPv6 addresses in addition to IPv4 addresses.
Table 2. Available Table Columns for VPN-related Views

Column Name

Available in View

Description

Receive Time

RA, S2S, VPN Summary

Poll date and time for this entry (format is: day-of-week MMM DD HH:MM:SS your-time-zone YYYY).

Firewall Name

RA, S2S, VPN Summary

Name of this device, as provided in the Security Manager inventory. Column-based Filtering is available.

User Name

RA

User log-in name used to establish this session. Column-based Filtering is available.

User Group Policy

RA

The name of the ASA VPN user group to which this user belongs. Column-based Filtering is available.

Gateway

RA

IP address of the VPN gateway to which the user is connected. Column-based Filtering is available.

Assigned IP

RA

Private IP address assigned to the remote client for this session; also known as the “inner” or “virtual” IP address.

Public IP

RA

Publicly routable IP address assigned to the client. Column-based Filtering is available.

Connection Initiation Time

RA

Time and date (HH:MM:SS day-of-week MMM DD YYYY) when connection was initiated. Time is displayed in 24-hour Coordinated Universal Time (UTC) notation.

Duration

RA

Elapsed time (HH:MM:SS) between the session initiation and the most-recent device poll.

Client Version

RA

VPN client software, and version, running on the remote peer; for example, AnyConnect Windows 3.0, or Mozilla 4.0. Column-based Filtering is available.

EndPoint OS

RA

Operating system in use on remote peer; for example, Windows or Windows NT. Column-based Filtering is available.

Authentication Method

RA

User password, certificate, or preshared key. Column-based Filtering is available.

Encryption

RA, S2S

Data encryption algorithm this session is using. Column-based Filtering is available..

Tunnel Type

RA, VPN Summary (as “Type” only)

Type of tunnel or connection. These include Clientless, IPsec, and AnyConnect. Column-based Filtering is available.

Throughput (Kbps)

RA, S2S

Bytes received plus bytes transmitted, in kilobits per second.

Session ID

RA

Identifier assigned to this session.

Inactive Time

RA

Amount of time this session has been inactive.

IP Address

S2S, VPN Summary

IP address of this device. Column-based Filtering is available.

Local Endpoint

S2S

IP address of local tunnel interface.

Remote Endpoint

S2S

IP address of remote tunnel interface.

Local Subnet

S2S

Address of local protected subnet.

Remote Subnet

S2S

Address of remote protected subnet.

Uptime

S2S

Current duration of this tunnel.

Connection Time

S2S

Time and date (HH:MM:SS day-of-week MMM DD YYYY) when connection was initiated. Time is displayed in 24-hour Coordinated Universal Time (UTC) notation.

Status

S2S

Tunnel connection status; this will be Up or Down. An alert is issued when a tunnel goes down a specified number of times; see Column-based Filtering for more information.

Tip 

You can click on a Down notification hyperlink in the Status column to view the IPSec VPN Events for that device in Event Viewer. Event Viewer will show IPSec VPN Events for the device within a time range depending on the polling interval for that device. If it is a priority device, the time range will be 5 minutes before until 5 minutes after the first down notification was received. For non-priority devices, the time range will be +/- 10 minutes instead of 5 minutes.

Health Status

VPN Summary

Current overall health of the underlying device: Critical, Warning, or Normal. Column-based Filtering is available..

Note 
Overall health is defined by the most critical of any of the health metrics. For instance, if all the selected metrics on the device are normal except for one that is critical, overall device health becomes critical.

Connection Status

VPN Summary

Remote connection status; this will always be Connected. (HPM cannot present information about previous connections.) Column-based Filtering is available.

Monitoring Type

VPN Summary

Types of VPN connections being monitored. Column-based Filtering is available.

Active Sessions

VPN Summary

Current active sessions (S2S, IPSec RA, client-based SSL RA, and clientless SSL RA).

Peak Sessions

VPN Summary

Peak numbers of concurrent sessions (S2S, IPSec RA, client-based SSL RA, and clientless SSL RA).

Total Users

VPN Summary

Current remote user total (S2S, IPSec RA, client-based SSL RA, and clientless SSL RA).

Inactive Sessions

VPN Summary

Number of inactive sessions.

Total VPN Throughput (Kbps)

VPN Summary

Sum of all VPN traffic; that is, sum of RA and S2S throughput values, in kilobits per second. Column-based Filtering is available.

ACL Name

Site-to-Site Tunnels

Beginning with version 4.9, Security Manager enables you to view the Access Control List (ACL) name that is associated with the selected Site-to-Site tunnel. This column name is selected by default.

Note 
In the Health and Performance Alerts Display, Tunnel up/down Alert now also displays the ACL Name in the Description column. Similarly, Email and Trap notifications also display the ACL Name in the Description column.

Remarks

Site-to-Site Tunnels

(Optional) This column displays the remarks corresponding to the ACL Name.

Note 
Alert, Email, and Trap notifications do not contain Remarks as part of the description field.

Limitation:

When Cisco Security Manager Daemon Manager service is started, the HPM application uses the latest configuration from the Configuration Archive to extract the ACL Name and Remarks associated with the Site-to-Site VPN tunnel. When the VPN tunnel is identified by HPM, it uses the extracted data to display the ACL Name and Remarks columns in the S2S view. If the VPN tunnel comes up before the data is available in HPM, the ACL Name and Remarks columns may not display the data until the next UI refresh. Similarly, the Alerts Display may not show the ACL Name in the Description column if the Alert is generated before the data is extracted by HPM. This might occur during upgrade to Security Manager version 4.9 from a previous version. If the same Alert appears in the next polling, the ACL Name is added to the Description.

Tip:

Sometimes you may notice discrepancy in the content of the Remarks column. Check if the latest configuration from the Configuration Archive contains the Remarks. If the Remarks are added or updated by Out-of-Band changes, you must perform rediscovery of the device.

Alert Table Columns

You can customize the Alerts table by hiding and showing various columns of information.

The order of the entries in the Choose Columns to Display dialog box reflects the ordering of the columns when displayed. (However, the ordering of the rows in the following table does not necessarily reflect ordering of the columns as displayed.) See Showing and Hiding Table Columns for information about opening the Choose Columns to Display dialog box.

Table 3. Available Data Columns for the Alerts Table

Column Name

Description

Device Name (always selected)

Name of this device on which this alert was triggered, as provided in the Security Manager inventory. Column-based Filtering is available.

Node

The Node Name if this alert was generated by a member of an ASA load-balancing cluster Column-based Filtering is available.

Device Type

Type of device: ASA or IPS. Column-based Filtering is available.

Severity

Alert severity: Critical, Warning, or Normal. Column-based Filtering is available.

Status

Current device status: Active or Acknowledged. Column-based Filtering is available.

Description

Description of the alert. For example, “Device Health Critical” or “Device Polling: Authentication Error.”

First Seen

Date and time when this alert was first logged (day-of-week MMM DD, YYYY HH:MM:SS AM/PM). Time is based in your time zone. Column-based Filtering is available.

Last Seen

Date and time when this alert was first logged (day-of-week MMM DD, YYYY HH:MM:SS AM/PM). Time is based in your time zone. Column-based Filtering is available.

Notes

You can annotate an alert when you acknowledge it. Any annotations are displayed in this field. See Alerts: Acknowledging and Clearing for more information.

Column-based Filtering

You can filter the various tables in HPM based on the contents of specific columns. When you apply a column filter, the table is filtered to include only those entries with the specified criteria in that column.


Note

See Working with Table Columns for other methods of altering table displays.

Tips

  • Column filters are cumulative: for an entry to appear in the filtered table, it must meet all column filter criteria. You cannot create a set of ORed column filters.

  • You can filter on the contents of most but not all columns. If a column does not have a down arrow, you cannot filter on it. For example, you cannot filter on Receive Time in All Devices view.

  • The filter icon (a funnel) appears in the heading of a filtered column.

  • For a description of the available columns, see Showing and Hiding Table Columns.

To filter a table according to a particular column parameter:

Procedure

Click the down-arrow in the heading of a column and choose one of the following from the drop-down menu:

  • All – Choose All to remove or “undo” a filter from this column. The table is updated to show all entries for this parameter. For example, if you filtered the Severity column of the Alerts table to display only Critical alerts, choosing this option will re-display all Critical and Warning alerts.

  • Custom – Choose Custom to open the Custom Filter dialog box where you can create a custom filter based on the information in that column. See Custom Filtering for more information.

  • A specific entry – The drop-down menu includes all values relevant to the column; choose one to display only that group of entries. For example, choosing Critical from the Severity column of the Alerts table filters the table to display only Critical alerts.


Custom Filtering

The following procedure explains how to create a custom column-based filter, one in which you are not simply selecting a value from the column’s drop-down list. Refer to HPM Window: Alerts Display for information about other column-based filtering options.

Procedure

Step 1

Click the down-arrow in the heading of a column and choose (Custom) from the drop-down menu.

The Custom Filter dialog box for that column opens.

Step 2

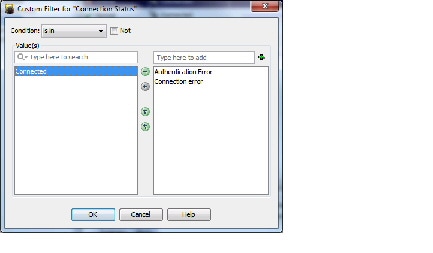
In the Custom Filter dialog box, select the desired values. The following illustration shows a typical example of this dialog box.

This image is not available in preview/cisco.com

These are the controls you might find in the Custom Filter dialog box (not all controls appear for every instance):

  • Condition – Choose the condition applied to the selected Values.

Typically this is is in, meaning each of the Values you select must be “in” a column in order for that entry to be displayed in the filtered table.

  • Not – Check this box to create a negative Condition.

With is in as the chosen Condition, this would mean the selected Values cannot be in the column. In other words, the table is filtered such that entries with these Values in the column are not displayed.

  • Values list – A few instances of the dialog box present one list of Values from which to select: simply check the desired options.

Available and selected Values lists – In most cases, the dialog box presents two Values lists, as shown in the previous illustration. To select a value for the custom filter, highlight it in the left list, which contains available values for the column, and click the right arrow to add it to the list of selected values on the right. You can select multiple values.

The items in the available Values list are determined by the values currently present in the selected column of the source table.

If there are a lot of available values, you can search for a specific value by typing in the List Filter field above the list. For more information, see Using The List Filter Fields.

You can also select, or deselect, values using the following techniques:

  • Type a Value name into the text field above the selected Values list and click the + button; the Value is added to the selected Values. This technique is useful if there is a large number of available Values, or if you want to filter on a value that is not present in the available Values list.

  • Double-click an item in either list to move it to the other list.

  • Click one of the double-arrow buttons to move all items from one list to the other, regardless of any selected values.

Step 3

Click OK to close the dialog box.

The table is updated to show only those entries that satisfy all currently applied filters.


Using The List Filter Fields

A List Filter field is provided above the devices and VPNs lists in the Monitoring display, above the alerts table in the Alerts display, above the device list on the VPN page of the Device Selector, and in the View Cleared Alerts window. In each case, you can use the List Filter field to quickly locate any entries in the related table that contain a specified text string.


Note

The found text can be part of any data field associated with an entry. For example, as you type “license” into the Alerts List Filter field, the Alerts table is filtered to show only those alerts related to imminent license expiration. (Any matched entries are listed even if the relevant data column—in this example, Detail—is not displayed, which could cause confusion. See Showing and Hiding Table Columns for more information about hiding table columns.)
Figure 2. Health and Performance Monitor: List Filter Field

1

Filter-parameters button

2

Clear button

To search for a specific text string in the devices list, the VPNs list, the Alerts table, or the View Cleared Alerts window:

  • Click in the List Filter field to place the text cursor, and then begin typing.

These are “live filter” fields. That is, as you type each character, entries that do not include your current text string are removed from the list or table. For example, suppose in an extensive list of alerts there is one with a Status of “Device Health Critical,” and that none of the other alerts include any text strings containing the letters hea . You want to use the List Filter field to quickly locate that one alert, so you begin to enter the word “health.” That alert is the only one displayed after you have typed the first three letters.

To clear a List Filter field:

  • Click the clear button at the right side of the field.

This button appears when you begin typing in the field. (You also can highlight the characters and press the Delete or Backspace key on your keyboard.)

When you clear the List Filter field, all entries in the list are again displayed.

You can tune the filter results by specifying the information (columns) searched, by selecting case sensitivity or insensitivity, by allowing wildcards or regular expressions, and by specifying where in a returned string your characters must be located.

To change the List Filter criteria:

  1. Click the filter-parameters button (magnifying glass) at the left side of the List Filter field to open the parameters menu.

  2. Choose an option.

The menu consists of four sections:

  • A list of all available information types—these entries correspond to the columns that can be displayed for that particular list or table. You can choose All, or alternatively you can choose individual entries.

  • Case sensitive and Case insensitive – Choose one or the other. If you choose Case sensitive, found text must match not only the characters you enter, but also their as-typed case.

  • Use wildcards and Use regular expression – Choose one or the other. The following wildcards are recognized:

  • * (asterisk) – Match zero or more characters at that location in the string.

  • ? (question mark) – Match one character at that location in the string.

  • Match from start, Match exactly, and Match anywhere – Choose one. Match from start means that the string you enter must be found at the beginning of an entry, although it can be part of a larger set of characters. Match exactly requires that the string you enter exactly match the entire column entry. Match anywhere means the string can be found anywhere within an entry, and it can be part of a larger set of characters.

  • Repeat Steps 1 and 2 to change another parameter.

Monitoring Devices

The HPM Monitoring display presents View controls, view panels, and detailed information about the currently selected device, as described in HPM Window: Monitoring Display.

To switch to the Monitoring screen:

  • Click the Monitoring button below the HPM menu bar.

(Click the Alerts button to return to the Alerts screen.)


Note

See Managing Device Views for information about specifying the devices to be monitored.

This section contains the following topics:

Managing Device Views

“Views” provide the means to filter and organize the information displayed in the Monitoring pane of the HPM application. Various system views are provided—for example, All Devices, Firewall Devices, Remote Access Users Details, and so on—and you can create custom views that organize the information in other ways, such as geographic device location.

The left pane of the HPM main window displays a list of available views as shown in the following illustration.

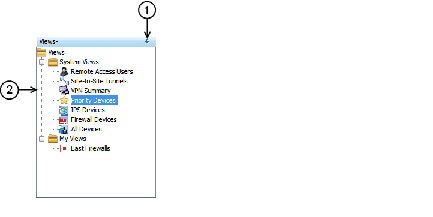
Figure 3. Health and Performance Monitor: Views Pane The Views pane includes the following controls:

This image is not available in preview/cisco.com

  • (1) Push Pin button – Click the Push Pin button to control display of the Views list. When the list is displayed as a pane of the HPM window (the pin is vertical), click the button to collapse the pane into the left edge of the window, leaving a labeled tab; the Monitoring pane is expanded to fill the HPM window.

You can “hover” your mouse pointer over the tab to “pop out” the Views list; it remains visible as long as the pointer is over the tab or in the list area (the pin is horizontal). You also can click anywhere in the title bar—except on the pin itself—to keep the list “popped out.”

Click the pin once again to re-establish the Views list as an open pane; the Monitoring pane contracts to make room for it.

  • (2) List of views – The list is organized into folders: System Views and My Views. Click an entry in either folder to open that view in the Monitoring pane, as described in Views: Opening and Closing. See Views: Custom for information about creating new views in the My Views folder.

  • Right-click shortcut menu – You can right-click any entry in the View list to access a pop-up menu of view-related commands:

    • Edit – Edit the name and description of the existing custom view. See Views: Custom.

    • Save As – Save the view as a new custom view. See Views: Custom.

    • Delete – Delete that custom view.

    • Set as default view – Use this command to designate the view that is always displayed whenever you launch the HPM application.

This section contains the following topics:

Views: Opening and Closing

All available views are listed in the Views pane, on the left side of the HPM window. The Monitoring pane displays open views, with each open view presented as a separate tabbed panel. (See HPM Window: Monitoring Display for more information about this window.)


Note

You can detach views so they “float” in separate windows. For more information, see Views: Floating and Docking.

To display a new view in the Monitoring pane:

  • Click the desired entry in the Views list.

The view appears as a tabbed panel in the Monitoring pane; it is automatically selected and displayed.

To switch to another open view:

  • Click the desired tab in the Monitoring pane; that view is displayed.

  • Right-click any tab and choose Next or Previous to display the view to the right or left of that tabbed view.

  • Click the Scroll Back and Scroll Forward buttons to the right of the tabs to display the view to the left or right of the current view.

To close a view:

  • Click the close button in that tab.

  • Right-click the tab and choose the Close.

  • Right-click the tab and choose Close Others to close all open views except the one you right-clicked.

  • Right-click any tab and choose Close All to close all open views.

Views: Tiling Horizontally or Vertically

Rather than displaying a single view such that it fills the Monitoring pane, you can tile two or more of the views, either horizontally or vertically, for easy comparison.

For example, if you tile two views horizontally, one view fills the upper half of the Monitoring pane, while the other fills the lower half. Similarly, tiling two views vertically fills the left-hand half of the pane with one view, with the other view filling the right half. Further, you can tile more than two views—the pane is subdivided equally for each view.

To create two horizontal or vertical tiles:

  • Right-click one of the tabs and choose New Horizontal Group or New Vertical Group.

The selected view and the other view(s) are distributed to share the Monitoring pane equally, either horizontally or vertically depending on your choice.

Note that if there are more than two views open when you choose one of these commands, the selected view is tiled, with the remaining group of tabbed views displayed as the other tile. You can then repeat this process with the remaining tabbed views, increasing the number of visible tiles, as desired.

You can also move an existing tile to another tile:

  • Right-click the tab and choose Move to Next Tab Group or Move to Previous Tab Group.

The selected view is added to the next tile (below or to the right, depending on tile orientation), or to the previous tile (above or to the left). These commands are available only if the tiled views are arranged in a manner where such movement is possible.

To change the orientation of the views, switching from horizontal to vertical tiling, or vice versa:

  • Right-click any tab and choose Change Tab Groups Orientation.

This command is available only when two or more tiled views are displayed.

Views: Floating and Docking

You can detach tabbed views so they “float” as separate windows, and you can “dock” floating views, returning them to the Monitoring pane as tabbed views.

To detach a view as a floating window:

  • Right-click that tab and choose Floating.

A standard window opens, displaying the selected view.

To move another tabbed view from the Monitoring pane to an already-open floating-view window:

  • Right-click the tab and choose the window from the Floating to submenu.

The right-clicked view is added to the existing window as another tabbed panel.

To return a floating view to the Monitoring pane as a tabbed panel:

  • Right-click the view’s tab in the window and choose Docking.

That view is returned to the Monitoring pane.


Note

As a standard window, you can minimize, maximize and close a floating view, as you would any other window.

Views: Custom

The Health and Performance Monitor provides seven System Views. In addition, you can create any number of custom views, each of which is based on an existing view. You also can edit and delete custom views.

The various views are presented in the Views pane of the Monitoring display, organized into two folders: System Views and My Views (the latter folder contains your custom views). The Monitoring display is described in HPM Window: Monitoring Display.

Follow these steps to create a new custom view:

  1. In the Views list, select the view on which the new view is to be based.

This can be a System View or an existing custom view.

  1. Choose Save As from the File menu to open the Save View As dialog box.

You also can right-click the selected view and choose Save As from the pop-up menu to open the dialog box.

  1. Provide a Name for the new view, and optionally a Description .

  2. Specify the devices to be monitored for this view: check and clear entries in the device-selector area of the dialog box.

  3. Click Save to close the dialog box and add the new view to the My Views folder.

Follow these steps to edit an existing custom view:

  1. Under My Views, select the view.

  2. Choose Edit from the File menu to open the Save View As dialog box.

You also can right-click the selected view and choose Edit from the pop-up menu.

  1. Edit the Name and Description , as necessary.

  2. Check and clear entries in the device selector to change the devices monitored for this view.

  3. Click Save to close the dialog box.

Follow these steps to delete an existing custom view:

  1. Under My Views, select the view.

  2. Choose Delete from the File menu.

You also can right-click the selected view and choose Delete from the pop-up menu.

  1. Confirm that you want the view deleted.

That view is removed from the Views list.

HPM Window: Monitoring Display

The HPM window provides two different information displays: Monitoring and Alerts. Click the Monitoring button to access the Monitoring display.

The Monitoring display consists of two primary panes: Views and Monitoring. The Views pane presents a list of available views. Click an entry in this list to open that View as a tabbed panel in the Monitoring pane.

The Monitoring pane can present multiple tabbed views, most of which display several sections. Click a tab to bring that view to the front.


Note

The Remote Access Users and the Site-to-Site Tunnels views each display only a single table of information, as described in Monitoring Views: VPN, RA and S2S. The following descriptions focus mainly on the other available system views.

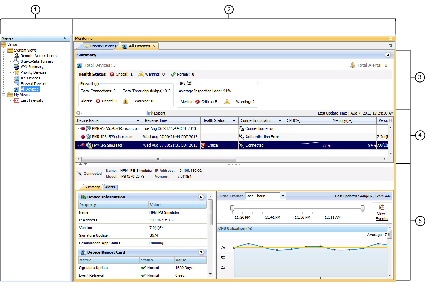
The following illustration presents the primary features of the Monitoring display and the panel sections.

Figure 4. Health and Performance Monitor: the Monitoring Display

This image is not available in preview/cisco.com

1

Views list.

4

Status of devices or VPNs.

2

Monitoring view controls.

5

Selected device details.

3

Summary of all devices.

The Monitoring display consists of five main elements:

  • Views list (1) – This pane lists all views available—click an entry in this list to open that view in the Monitoring pane. The views are organized into System Views, provided as part of the Health and Performance Monitor, and My Views, which are custom views you have created. See Managing Device Views for information about the Views pane, and Views: Custom for information about managing custom views.

  • Monitoring view controls (2) – A labeled tab appears here for each view you open; click any tab to bring that view to the front. You also can use the Scroll Backward and Scroll Forward buttons to step backward or forward through the tabbed views. Alternately, open the Show List drop-down menu on the right and choose a label to make that the active view.

  • Summary of all devices or VPNs (3) – Provides aggregate information for all devices or VPNs represented by this view. Expand or collapse this section by clicking the button on the right side. The device-summary section is described in greater detail in Monitoring Views: Devices or VPNs Summary.

  • Device-status list (4) – All devices or VPNs included in this view are listed here; see Monitoring Views: Device or VPN Status List for more information about this list. Use the List Filter field in this section to filter the list, as described in Using The List Filter Fields.

  • Selected device or VPN details (5) – This section provides detailed information about the device or VPN currently highlighted in the device list. The details section is described in greater detail in Monitoring Views: Device or VPN Details.

This section contains the following topics:

Monitoring Views: Devices or VPNs Summary

The HPM Monitoring display presents tabbed views, each of which provides detailed information about the device or VPN currently selected, as described in HPM Window: Monitoring Display. All device-related views (that is, all but the Remote-Access Users and Site-to-Site Tunnels views), include a Summary section, as described here.

This devices summary, or VPN Summary, which you can show and hide by clicking the button on the right side of its title bar, displays a snapshot of the aggregate Health Status and Alert Status for all the devices or VPNs relevant to the current view. For example, if you are viewing the Firewall Devices panel, the status summaries are for all monitored firewall devices only.

Monitoring Views: Device or VPN Status List

The HPM Window: Monitoring Display presents detailed information about the device or VPN currently selected (in a specific device view, or the VPN Summary view, respectively). All device-related views and the VPN Summary view include a table of monitored devices or VPNs relevant to the current view.

This table displays “at-a-glance” status information for every monitored device or VPN—each is represented by an entry in this table. Note that ASA clusters are presented as expandable entries: click the + icon in front of the cluster entry to expand it and view indented entries for each cluster node.

Again, the list includes only those elements relevant to the current view. For example, the list in the Firewall Devices view does not include entries for IPS devices. The Remote-Access Users and Site-to-Site Tunnels views do not include this status display.

You can resize the table columns, you can show and hide columns, and the column headings are menus you can use to filter the table by hiding or showing devices according to chosen parameters. See Showing and Hiding Table Columns for more information about these options.

When you select an entry in this list, detailed information for that device is displayed in the device-details area below the table, as described in Monitoring Views: Device or VPN Details.


Tip

With the All Devices, Firewall Devices, IPS Devices, and Priority Devices views (and any custom device-related views), you can right-click the highlighted entry and choose Device Manager from the pop-up menu to open the appropriate external device manager for that device—that is, ASDM for an ASA, and IDM for an IPS sensor—where you can “drill down” into the health and performance data for that device. See Starting Device Managers for more information about the device managers.


Monitoring Views: Device or VPN Details

The HPM Window: Monitoring Display presents views and detailed information about the currently selected device or VPN. All device-related views and the VPN Summary view provide three or four tabbed panels of detailed information for the individual device or VPN currently selected in the device-status table above it. (The Remote-Access Users and Site-to-Site Tunnels views do not provide this details panel.)

The information presented for each type of view follows.

For the All Devices, Firewall Devices, IPS Devices, Priority Devices, and custom device-related views, the tabbed panels are:
  • Summary - The Summary tab consists of four sections that provide information about the device and the device’s status:

    • Device Information – This section provides a read-only listing of device-specific information such as device name, IP address, device type and model number, and so on. A read-only listing of Failover information is also presented. If an ASA cluster is selected, the Failover listing is replaced with a listing of cluster-related information.

    • Device Report Card - This section provides a collection of metrics that indicate the current status of the device. For more information about the metrics shown here, see Table Columns: Device-related Views.

    • Interface Status – This section provides a listing of all interfaces defined on the device, with current status information.

    • Device Health Graphs - This section provides a “snapshot” of device status using graphic displays for certain metrics such as CPU and memory usage. It also presents device-specific traffic information, for example, average number of connections and number of translations for firewall devices (over the most-recent polling period), and average inspection load and percentage of missed packets for IPS sensors (over the most-recent polling period).You can specify the time frame (Last 1 hour, Last 24 hours, or Last 7 days) to use for these graphs from the Time Frame list. You can focus in on a specific time frame by using the slider bar above the graphs.To view events for the selected device, click the View Events button. Event Viewer opens and the Event Monitoring window lists events filtered by the selected device and the time period specified by the slider bar.


Note

For IPS devices, certain health-metric thresholds must be configured separately on the individual devices—that is, outside of HPM. Therefore, it is possible for the health of an IPS device to be critical, for example, without any indication in HPM. See Alerts Configuration: IPS for additional information.
  • Alerts - The Alerts tab lists all alerts for the selected device. You can show and hide various columns of information for each alert. See Alerts and Notifications for more information about alerts. For information about the fields available on this tab, see HPM Window: Alerts Display.

For the All Devices, Firewall Devices and Priority Devices the tabbed panels are
  • Summary-The Summary tab consists of four sections that provide information about the device and the device’s status:

    • Device Information – This section provides a read-only listing of device-specific information such as device name, IP address, device type and model number, and so on. A read-only listing of Failover information is also presented. If an ASA cluster is selected, the Failover listing is replaced with a listing of cluster-related information.

    • Device Report Card - This section provides a collection of metrics that indicate the current status of the device. For more information about the metrics shown here, see Table Columns: Device-related Views.

    • Interface Status – This section provides a listing of all interfaces defined on the device, with current status information.

    • Device Health Graphs - This section provides a “snapshot” of device status using graphic displays for certain metrics such as CPU and memory usage. It also presents device-specific traffic information, for example, average number of connections and number of translations for firewall devices (over the most-recent polling period), and average inspection load and percentage of missed packets for IPS sensors (over the most-recent polling period).You can specify the time frame (Last 1 hour, Last 24 hours, or Last 7 days) to use for these graphs from the Time Frame list. You can focus in on a specific time frame by using the slider bar above the graphs.To view events for the selected device, click the View Events button. Event Viewer opens and the Event Monitoring window lists events filtered by the selected device and the time period specified by the slider bar.


Note

For IPS devices, certain health-metric thresholds must be configured separately on the individual devices—that is, outside of HPM. Therefore, it is possible for the health of an IPS device to be critical, for example, without any indication in HPM. See Alerts Configuration: IPS for additional information.
  • Alerts - The Alerts tab lists all alerts for the selected device. You can show and hide various columns of information for each alert. See Alerts and Notifications for more information about alerts. For information about the fields available on this tab, see HPM Window: Alerts Display.

  • Flow-offload- The Flow-offload tab displays basic information about the offload engine, the load percentage on offload cores and information on active offloaded flows- the number of offloaded flow created, the offloaded active flows, their rewrite rules and data.

  • Flow- offload Statistics- The Flow-offload Statistics tab displays the counts for transmitted, received and dropped packets and statistics for the virtual NIC used.

For the VPN Summary view, the tabbed panels are:
  • VPN Usage – Several graphs presenting information such as active site-to-site tunnels, active remote-access sessions, and total throughput. This includes historical trending information for active Site-to-Site tunnels, active IPSec remote-access users, active SSL VPN clientless users, and active SSL VPN with client users.

  • Cluster Resource Usage – Displays the usage details of cluster resources—resource names, its current, peak, and usage limits. It also provides the number of denied packets and the contexts. This feature is applicable only for Cisco Firepower 9K devices.

  • Cluster Distribution Details – Displays the cluster mode of the VPN. If it is centralized, an error message is displayed mentioning that the destination mode is not VPN distributed. If it is distributed, it displays the respective member I and member II details. This feature is applicable only for Cisco Firepower 9K devices.

  • License Information – A read-only listing of license information by VPN type, or IPSec and SSL license and load information, depending on your selection in the table above. For the System context of a multiple-mode device, VPN Licensing and allocation are shown; for individual contexts, VPN allocation Limits and VPN licensing usage are shown.

  • Other Details – A listing of certificate and TrustPoint details.

See Managing Monitored Devices for information about selecting devices for VPN monitoring.

Monitoring Views: VPN, RA and S2S

The HPM Monitoring display presents a variety of device- and VPN-related data views, as described in HPM Window: Monitoring Display. These include the Remote Access Users and Site-to-Site Tunnels views, which unlike the other views, are simply tables of current users and tunnels.

See Managing Monitored Devices for information about selecting devices for VPN monitoring.

In both of these views, you can resize the table columns, you can show and hide columns, and the column headings are menus you can use to filter the table by hiding or showing entries according to chosen parameters. SeeShowing and Hiding Table Columns for more information about these options.

The Remote Access Users view lists the remote-access users currently logged into network resources via the devices being monitored by HPM. Note that remote-access user information is updated every 20 minutes (for normal monitoring; for Priority monitoring the interval is 15 minutes), rather than the five minutes that is standard for the other views. Also, no historical or trending data is available for remote-access users.

Further, you may notice a mismatch between RA user count in the VPN Summary view and the Remote Access Users view. This is because the VPN Summary is updated at ten-minute/five-minute (normal/Priority) intervals.


Tip

In the Remote Access Users view, you can right-click a user entry and choose Log Off User from the pop-up menu to terminate that remote-access connection.


The Site-to-Site Tunnels view provides current VPN tunnel information through all monitored devices. Note that to enable tunnel Up/Down alerts for a device or context, you must configure SNMPv3 on the device, as described in SNMP Credentials Dialog Box.


Tip

In the Site-to-Site Tunnels view, you can click on a Down notification hyperlink in the Status column to view the IPSec VPN Events for that device in Event Viewer. Event Viewer will show IPSec VPN Events for the device within a time range depending on the polling interval for that device. If it is a priority device, the time range will be 5 minutes before until 5 minutes after the first down notification was received. For non-priority devices, the time range will be +/- 10 minutes instead of 5 minutes.


For clusters of ASA 9.0+ devices, information is shown for the director device only, since VPN processing is not load-balanced across the nodes and is thus limited to centralized support in the cluster.


Note

VPN polling occurs on a fixed time interval, so it is not possible to log status changes within that time interval. For example, if a site-to-site tunnel goes down immediately after polling and comes back up just before the next poll, that status change cannot be detected.

Exporting HPM Data

You can save a “snapshot” of the device-status information in the current View as a PDF, HTML, or CSV (comma-separated values) file.


Note

Beginning with Security Manager version 4.9, the exported data in PDF, HTML, or CSV format also contain the IPv6 tunnel information.

The following steps describe exporting the current View data in either a PDF, HTML, or CSV file:

Related Topics

Procedure

Step 1

Click the appropriate tab to display the View you want to export (that is, Priority Devices, VPN Summary, All Devices, or another).

Tip 

To export the data for a subset of all entries in a particular view, create a custom view that includes only the desired devices. See Views: Custom for information.

Step 2

Click the down-arrow beside the Export button next to the List Filter field (above the device- or VPN-status list) and choose As PDF, As HTML, or As CSV from the drop-down menu.

The Export dialog box opens.

Step 3

Select the specific information to be exported by checking the appropriate columns in the dialog box.

The following topics describe the individual columns available for various views:

Step 4

If you chose As PDF from the Export drop-down list, at the bottom of the Export dialog box you can choose the desired Page Size for the PDF file: A1, A2, A4, Letter, or Legal.

The pages of the PDF file will be the selected size, with the presented information formatted accordingly.

Step 5

If you chose As CSV from the Export drop-down list, Security Manager exports the information in a CSV file that you can save as required. Beginning with version 4.8, Security Manager provides the Export Trend Charts checkbox that you can select to export trend information in CSV file format. You can then chose the Time Frame from available time range of last one hour, last 24 hours, and last seven days.

Step 6

Click Export to close the Export dialog box.

The Save file dialog box opens.

Step 7

Provide a name for the file, and specify where it is to be saved.

The default file name is the current system time (as a long integer); you can change this to something informative. On Windows systems, the default location is My Documents; you can specify any location.

Step 8

Click Save to close the Save dialog box and export the selected data.


Alerts and Notifications

The Health and Performance Monitor (HPM) provides trend information, alerts, and notifications regarding the performance and health of monitored devices. You can monitor the overall health of your network—including network user and device resource utilization—by quickly scanning the status of individual devices and groups of devices.

Specific device-level trend information is available for hourly, daily and weekly intervals. Alerts are displayed prominently, with easy navigation to the relevant HPM data. You also can acknowledge and annotate individual alerts.


Note

When a node from a cluster is deleted and then the cluster is rediscovered in Security Manager, the node will be removed from monitoring in HPM if currently enabled. However, any alerts generated on the node will still be shown in HPM. You must manually clear the alerts from HPM.

These alerts are based on threshold values and state-change rules that you have configured: you specify thresholds that define Critical, Warning, and Normal levels for various metrics, and you can configure rules for certain state changes such as interface failure.

Further, there are two levels of device monitoring. Initially all devices are unmonitored. However, you can designate devices to be monitored at a “normal” level, or at a “Priority” level—you define a separate set of alert definitions for each level. Priority devices are polled and reported on more frequently (five-minute intervals versus ten for “normal” devices), and failure parameters are more stringent.

You also can enable email alert notifications. If configured, an email is sent to the specified address(es) whenever an alert is generated. You can provide multiple addresses for each category of alerts (Firewall and IPS).


Note

An email notification is sent the first time an alert is logged, and when the severity of an alert changes from warning to critical (but not vice-versa). No notification is issued if a device returns to the Normal state.

This section contains the following topics:

HPM Window: Alerts Display

The HPM window provides two different information displays: Monitoring and Alerts. Click the Alerts button to access the Alerts display.


Note

A device-specific view of alert data is available on the Alerts tab when viewing details for a specific device (see Monitoring Views: Device or VPN Details). With a few exceptions, you can perform many of the same functions from the device-specific alert view as you can from the primary Alerts display.

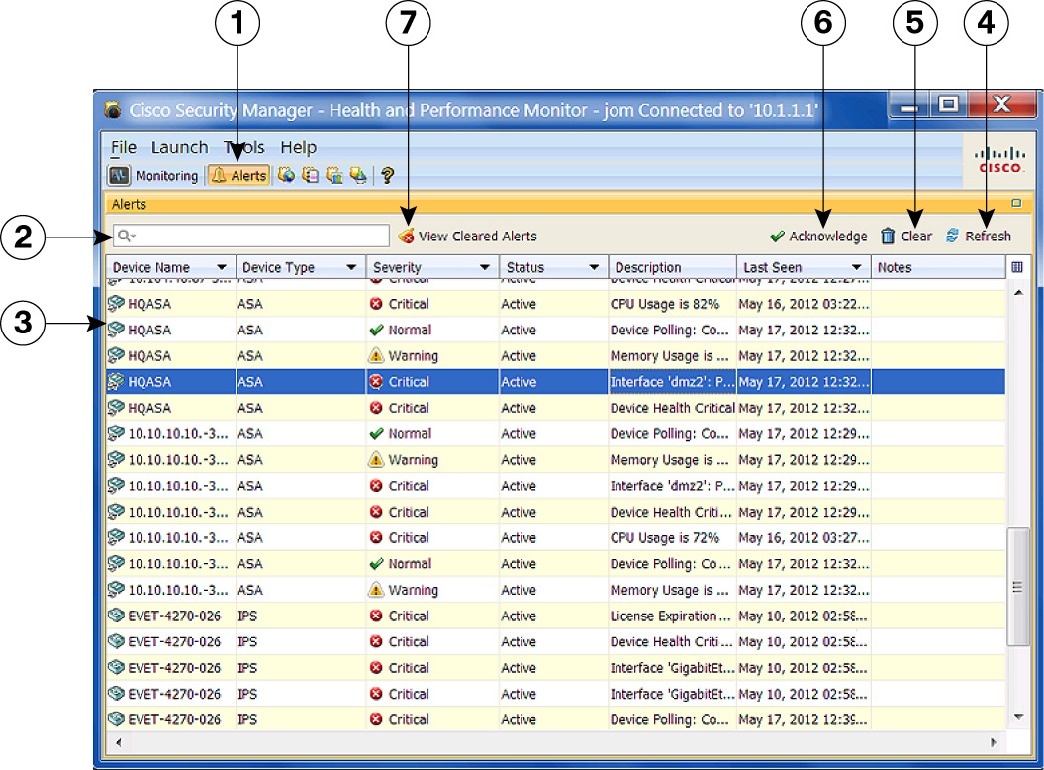
The following illustration presents the primary features of the Alerts display.

Related Topics

Figure 5. Health and Performance Monitor: Alerts Display

1

Alerts button.

5

Clear button.

2

List Filter field.

6

Acknowledge button.

3

Alerts table.

7

View Cleared Alerts button.

4

Refresh button.

The Alerts display consists of seven main elements:


Note

With the exception of the List Filter field and the View Cleared Alerts button, these same elements are available to you on the Alerts tab when viewing details for a specific device (see Monitoring Views: Device or VPN Details).
  • Alerts button (1) – The HPM window displays either Monitoring information for devices and VPNs, or a table of alerts generated by monitored devices. Click the Alerts button to view the alerts table.

  • List Filter field (2) – You can use this field to filter the alerts displayed in the table; only those alerts containing the specified text are listed. Refer to Using The List Filter Fields for more information.

  • Alerts table (3) – This table lists all alerts for all currently monitored devices. The alerts displayed can be filtered using the List Filter field. You also can show and hide various columns of information for each alert. See Alerts and Notifications for more information.

  • Refresh button (4) – Click this button to update all alerts ahead of the normal polling cycles.

  • Clear button (5) – When one or more alerts are selected, you can click this button to open the Clear dialog box. Click the Clear button in the dialog box to close it and clear the highlighted alerts from the table.


Note

See Alerts: Acknowledging and Clearing for additional information about clearing and acknowledging alerts.
  • Acknowledge button (6) – When one or more alerts are selected, you can click this button to open the Acknowledge dialog box. If desired, you can enter a note that will be applied to the selected alerts. Click the Acknowledge button to close the dialog box and mark all highlighted alerts as acknowledged.


Tip

You can add a note to any previously acknowledged alert. Click the Note field for that alert to open the Enter Notes dialog box. This is the only method of accessing the Enter Notes dialog box.


  • View Cleared Alerts button (7) – Click this button to open the View Cleared Alerts window where you can access and view previously cleared alerts; you specify a set of devices and a time range. See Alerts: History for more information about using this window.

Alerts: Configuring

The alerts and email notifications provided by HPM are based on threshold values and state-change rules that you configure in the Alerts Configuration dialog box.

The Alerts Configuration dialog box consists of three tabbed panels: IPS for IPS sensor-related alerts, FW for firewall-related alerts, and VPN for tunnel-status alerts. Each panel presents groups of options in sections—use the expand/collapse button to show or hide a particular section.


Note

You can enable and disable a particular alert without expanding that section; simply check or clear the box preceding the section heading—the current settings are used and retained.

There are two levels of device monitoring: normal or “standard” priority and “active” priority. Active priority devices are polled and reported on more frequently, and failure parameters are more stringent. You can designate up to 10% of all monitored devices for Priority monitoring. See Managing Monitored Devices for more information about device selection.

Follow these steps to configure alert reporting and notifications for both Standard and Priority devices:

Procedure


Step 1

Choose Alert Configuration from the Tools menu to open the Alerts Configuration dialog box.

Step 2

On the IPS panel, configure IPS-related alerts—if necessary, click the IPS tab to display the panel.

  1. To enable email Notifications when IPS alerts are generated, enter one or more valid addresses in the Email Addresses field; separate multiple addresses with commas.

  2. Use the checkboxes in the section headings to enable and disable specific alerts. Expand a section to update those alert definitions. The IPS parameters are described in Alerts Configuration: IPS.

Note 
An email notification is sent the first time an alert is logged, and when the severity of an alert changes from warning to critical (but not vice-versa). No notification is issued if a device returns to the Normal state.
Step 3

On the FW panel, configure firewall-related alerts—click the FW tab to display the panel.

  1. To enable email Notifications when firewall alerts are generated, enter one or more valid addresses in the Email Addresses field; separate multiple addresses with commas.

  2. Use the checkboxes in the section headings to enable and disable specific alerts. Expand a section to update those alert definitions. The FW parameters are described in Alerts Configuration: Firewall.

Step 4

On the VPN panel, configure tunnel-status alerts—click the VPN tab to display the panel.

  1. To enable email Notifications when tunnel-down alerts are generated, enter one or more valid addresses in the Email Addresses field; separate multiple addresses with commas.

  2. Use the checkbox in the section heading to enable and disable tunnel-status alerts. Expand the section to update those alert definitions. The VPN parameters are described in Alerts Configuration: VPN.

Note 
To enable these tunnel-status alerts for a device or context, you must first configure SNMP on the device, as described in Configuring SNMP for S2S Polling.
Step 5

Click Save to save your changes and close the dialog box.


Alerts Configuration: IPS


Note

From version 4.17, Cisco Security Manager does not support IPS devices.

The alerts and status information collected from monitored IPS devices are configured on the IPS panel of the Alerts Configuration dialog box. Refer to Alerts: Configuring for information about opening the dialog box, accessing the IPS panel, and providing email addresses for IPS-related Notifications.

The IPS-alert configuration parameters are grouped into sections that can be expanded and collapsed. Each section includes a checkbox next to its heading; use this checkbox to enable or disable that alert. When expanded, each section provides access to the settings used to define the alert.

The IPS alert and status configuration parameters are described in the following table. Each parameter can be configured separately for Priority Devices and Standard Devices. (Specifying devices for priority and standard monitoring is described in Managing Monitored Devices.)


Note

Some of the following alert settings require specific related parameters to be configured on the monitored IPS sensors themselves. For example, if license-expiration-policy (health-monitor command) is not enabled on a particular sensor, license-expiration messages are not generated by that sensor and therefore no occurrences are tallied for it by HPM.
Table 4. IPS Alerts Configuration

Setting

Description

Collaboration App Status

Errors generated by the Collaboration App application are tallied. Alerts and Notifications are generated when the number of errors tallied reaches the specified Occurrences value.

Sensor App Status

Errors generated by the Sensor App application are tallied. Alerts and Notifications are generated when the number of events reaches the specified Occurrences value.

Bypass Mode

Any time bypass mode is triggered, one Occurrence is tallied for this setting. Alerts and Notifications are generated when the number of Occurrences reaches the value specified.

Interface Status

The status of each enabled interface is polled periodically. Each “down” result for any given interface is tallied as one Occurrence for that interface. Alerts and Notifications are generated when the number of Occurrences reaches the value specified.

License Expiration

A license-expiration threshold can be configured on each IPS sensor, and whenever this threshold is crossed, a status message is issued.

Memory Usage

A memory-usage threshold can be configured on each IPS sensor, and whenever this threshold is exceeded, a status message is issued.

An Occurrence is tallied for each memory-usage message. Alerts and Notifications are generated when the number of Occurrences reaches the value specified here.

Missed Packets

A missed-packets threshold can be configured on each IPS sensor, and whenever this threshold is exceeded, a status message is issued.

An Occurrence is tallied for each missed-packets message. Alerts and Notifications are generated when the number of Occurrences reaches the value specified here.

Inspection Load

A traffic inspection-load threshold can be configured on each IPS sensor, and whenever this threshold is exceeded, a status message is issued.

An Occurrence is tallied for each load-exceeded message. Alerts and Notifications are generated when the number of Occurrences reaches the value specified.

Alerts Configuration: Firewall

The alerts and status information collected from monitored firewall devices are configured on the FW panel of the Alerts Configuration dialog box. Refer to Managing Monitored Devices for information about opening the dialog box, accessing the FW panel, expanding and collapsing sections, and providing email addresses for FW-related Notifications.

The firewall-alert configuration parameters are grouped into sections that can be expanded and collapsed. Each section includes a checkbox next to its heading; use this checkbox to enable or disable that alert. When expanded, each section provides access to the settings used to define the alert.

Some section headings also include Consider for Device Health checkboxes. Checking one of these boxes means that particular information is considered when determining overall health of each device.

The FW alert and status configuration parameters are described in the following table.

Table 5. Firewall Alerts Configuration

Setting

Description

Failover Peer Status

The status of the link to the device’s failover peer is polled periodically. Each failed contact attempt is tallied as one Occurrence. Alerts and notifications are generated when the number of occurrences reaches the values specified here.

For Priority devices and for Standard devices: choose Critical or Warning to specify the type of alert generated, and then specify the number of occurrences necessary to trigger the alert.

Interface Status

The status of each enabled interface is polled periodically. Each “down” result for any given interface is tallied as one Occurrence for that interface. This monitoring is per stand-alone device, and per node of an ASA cluster. Alerts and notifications are generated when the number of occurrences reaches the values specified here.

For Priority devices and for Standard devices: choose Critical or Warning to specify the type of alert generated, and then specify the number of occurrences necessary to trigger the alert.

Note 
Check Consider for Device Health in the header to include these data in device-health calculations.

Master Changed

An Occurrence is tallied each time the device designated as the controlling unit node of an ASA cluster changes. Alerts and notifications are generated when the number of occurrences reaches the values specified here.

For Priority devices and for Standard devices: choose Critical or Warning to specify the type of alert generated, and then specify the number of occurrences necessary to trigger the alert.

Cluster Node Status

An Occurrence is tallied each time the Connection Status of an ASA cluster node changes (comes up or goes down). Alerts and notifications are generated when the number of occurrences reaches the values specified here.

For Priority devices and for Standard devices: choose Critical or Warning to specify the type of alert generated, and then specify the number of occurrences necessary to trigger the alert.

CPU Usage

An Occurrence is tallied each time CPU usage exceeds the specified Threshold percentage. This is per stand-alone device; per node of a single-context cluster; and per node for the system context only in a multi-context cluster. Alerts and notifications are generated when the number of occurrences reaches the values specified here.

Note 
Check Consider for Device Health in the header to include these data in device-health calculations.

For Priority devices and for Standard devices, you can enable either or both Critical and Warning CPU Usage alerts:

  1. Check the appropriate box to enable the Threshold and Occurrence fields.

  2. Specify a Threshold percentage by clicking the up or down arrows, or by highlighting the existing value and typing a number.

  3. In the Occurrence field, specify the number of times the specified Threshold must be exceeded before the critical or warning alert is issued.

Memory Usage

An Occurrence is tallied each time memory usage exceeds the specified Threshold percentage. This is per stand-alone device; per node of a single-context cluster; and per node for the system context only in a multi-context cluster. Alerts and notifications are generated when the number of occurrences reaches the values specified here.

Note 
Check Consider for Device Health in the header to include these data in device-health calculations.

For Priority devices and for Standard devices, you can enable either or both Critical and Warning Memory Usage alerts:

  1. Check the appropriate box to enable the Threshold and Occurrence fields.

  2. Specify a Threshold percentage by clicking the up or down arrows, or by highlighting the existing value and typing a number.

  3. In the Occurrence field, specify the number of times the specified Threshold must be exceeded before the critical or warning alert is issued.

Alerts Configuration: VPN

The generation of alerts for site-to-site (S2S) tunnels on monitored devices and contexts is enabled and configured on the VPN panel of the Alerts Configuration dialog box. Refer to Alerts: Configuring for information about opening the dialog box, accessing the VPN panel, and providing email addresses for VPN-related Notifications.


Tip

When VPN alerts are enabled, HPM polls the monitored devices and contexts at normal and Priority intervals (ten and five minutes, respectively), according to your normal/Priority designations. You also can enable SNMP monitoring which updates HPM tunnel status immediately upon processing the traps. See Configuring SNMP for S2S Polling for more about enabling SNMP processing for HPM.


The tunnel-status configuration parameters are grouped into a section that can be expanded and collapsed. When expanded, you have access to the alert settings. The checkbox next to the heading is used to enable or disable the alert.

The VPN alert parameters are described in the following table.

Table 6. VPN Alerts Configuration

Setting

Description

Tunnel Status

The status of each monitored S2S tunnel is updated whenever it comes up or goes down, based on periodic polling or SNMP trap processing. Each “down” result for any given tunnel is tallied as one Occurrence. An alert is generated when the number of occurrences reaches the values specified here.

For Priority Devices and for Standard Devices, you can separately configure both Critical and Warning tunnel-down alerts: choose Critical or Warning to specify the type of alert generated, and then in the Occurrence field, specify the number of times a tunnel is down when polled before the critical or warning alert is issued.

Configuring SNMP for S2S Polling

The Health and Performance Monitor (HPM) application uses SNMP to poll site-to-site (S2S) VPN tunnels for up/down status updates. The generation of alerts for site-to-site (S2S) tunnels on monitored devices and contexts is configured on the VPN panel of the HPM Alerts Configuration dialog box. Refer to Alerts: Configuring for information about opening the dialog box, accessing the VPN panel, and providing email addresses for VPN-related Notifications.

Configuring SNMP in Security Manager to provide S2S polling is outlined here. The basic steps are:

  1. Enable and configure SNMP on the SNMP Page for the device or individual context; specifically: check Enable SNMP Servers and provide and confirm the Read Community String.

  2. In the SNMP Trap Configuration Dialog Box, check IPSEC Start and IPSEC Stop on the Other panel.

  3. In the Add/Edit SNMP Host Access Entry Dialog Box, provide Interface Name, IP Address, Community String (and Confirm it), and choose the SNMP Version (1 or 2c).

Versions 1, 2c and 3 are supported for S2S polling, but version 3 must be configured separately, as described in the next section.

  1. Configure SNMP credentials for the device or individual context in the SNMP Credentials Dialog Box.

For versions 1 and 2c, provide and confirm the RO Community String.

For version 3, Security Manager supports three modes; which to use is determined from your input:

  • noauthnopriv (no authentication, no privacy) – User name is mandatory, others are optional.

  • authnopriv (authentication, no privacy) – User name, Password, Auth Algorithm, and Engine ID are required.

  • authpriv (authentication and privacy) – User name, Password, Auth Algorithm, Privacy Password, Privacy Algorithm, and Engine ID are required.

Again, configuration of SNMP v3 is performed separately, as described in the next section.

Configuring SNMP v3 for Security Manager Device

You cannot configure SNMP v3 directly in Security Manager; you must use CLI commands or set up a FlexConfig. The steps are:

  1. Configure an SNMP server group.


snmp-server group group-name v3 [auth | noauth | priv]

The auth keyword enables packet authentication. The noauth keyword indicates no packet authentication or encryption is being used. The priv keyword enables packet encryption and authentication. There are no default values for the auth or priv keywords.

  1. Define a new SNMP user.


snmp-server user username group-name{v3 [encrypted] 
[auth {md5 | sha]} auth-password 
[priv [des | 3des | aes] [128 | 192 | 256] priv-password]

The v3 keyword specifies that the SNMP Version 3 security model is used, and enables the use of the encrypted , priv , and auth keywords. The encrypted keyword indicates the password is in encrypted format. Encrypted passwords must be in hexadecimal format.

The auth keyword specifies which authentication level ( md5 or sha ) is used.

The priv keyword specifies the encryption level. There are no default values for the auth or priv keywords.

For the encryption algorithm, you can specify either des , 3des , or aes . You can also specify which version of the AES encryption algorithm to use: 128 , 192 , or 256 . The auth-password specifies the authentication user password. The priv-password specifies the encryption user password.

  1. Specify the recipient of SNMP notifications.


snmp-server host interface {hostname | ip_address} [version 3 username]

Indicates the interface from which traps are sent. Identifies the name and IP address of the NMS or SNMP manager that can connect to the device.

Related Topics

Alerts: Viewing

All alerts generated for monitored devices are displayed as a table in an alternate screen of the HPM window. The Alerts table is updated automatically as devices are polled for status information. You can also click the Refresh button, above the table on the right side, to update the table.

These alerts are based on the threshold values and state-change rules you have configured. See Alerts: Configuring for more information.


Note

See Managing Monitored Devices for information about specifying the devices to be monitored.

To switch to the Alerts screen:

  • Click the Alerts button below the HPM menu bar.

(Click the Monitoring button to return to the Monitoring screen.)


Note

You can also view alerts that apply to a specific device from the Alerts tab when viewing details for that device (see Monitoring Views: Device or VPN Details).

The Alerts listing is a basic table, consisting of rows and columns, with each row representing one alert from a given device. Each column provides specific information about that alert: device name, alert severity, time recorded, and so on. (See HPM Window: Alerts Display for more about the Alerts screen.)


Note

The column headings are menus that you can use to filter the table by hiding or showing alerts according to chosen parameters. For example, you might choose to display alerts for only a particular device, and then choose only critical alerts for that device. See Working with Table Columnsfor more information.

Tip

You can click on the hyperlink in the Description column for tunnel up/down alerts to view the IPSec VPN Events for that device in Event Viewer. Event Viewer will show IPSec VPN Events for the device within a time range depending on the polling interval for that device. If it is a priority device, the time range will be 5 minutes before until 5 minutes after the first up/down notification was received. For non-priority devices, the time range will be +/- 10 minutes instead of 5 minutes.


In addition to scrolling the Alerts table, you can view sets of specific alerts:

  • Use the List Filter field above this table to filter the list. See Using The List Filter Fields for more information.

  • Use the View Cleared Alerts window to view previously cleared alerts for a selected set of devices over a specified time range. See Alerts: History for more information.

You also can acknowledge alerts, clear alerts, and edit alert notes:

  • You can acknowledge an alert, or clear it, as described in Alerts: Acknowledging and Clearing.

  • To add to an existing alert note, click Notes field for that entry in the table to open the Enter Notes dialog box—used to view and add notes to an alert. Available only when a single alert with an existing note is selected in the table.

Alerts: Acknowledging and Clearing

All alerts generated for monitored devices are displayed in the Alerts table, as described in Alerts: Viewing. You can add notes to individual alerts, and you can acknowledge or clear alerts individually or in groups.

To select an alert, click that entry in the Alerts table. You can Shift-click another alert to select the group between the two, and you can Ctrl-click various rows to select multiple non-contiguous alerts.

When an alert is selected in the table, you can:

  • Click the Acknowledge button to open the Acknowledge Alert dialog box, used to add a note to, and then mark the selected alert(s) as acknowledged. You can acknowledge multiple alerts at one time.

Enter text in the Notes field in this dialog box (this is optional), and then click OK. The dialog box closes and the alerts are marked as acknowledged with a timestamp displayed in the Notes column.

  • Click the Clear button to open the Clear Alert dialog box, used to add a note to, and then remove the selected entries from the Alerts table.

Enter text in the Notes field in this dialog box (this is optional), and then click OK. The dialog box closes and the selected alerts are removed from the Alerts table.


Note

Alerts can be cleared automatically by HPM if you change the relevant threshold(s). Like alerts you have cleared, these alerts can be viewed in the View Cleared Alerts window (see Alerts: History).

Notes and other information for cleared alerts are saved in an Alerts database for 30 days.

Alerts: History

All alerts generated for monitored devices are displayed as a table in the HPM window. You can filter the table by any visible column parameter, as described in Alerts: Viewing.

You also can use the View Cleared Alerts window to access and view previously cleared alerts; you specify a set of devices and a time range. (Clearing alerts is described in Alerts: Acknowledging and Clearing.)


Note

Notes and other information for cleared alerts is maintained in an Alerts database for 30 days—you cannot access alerts more than 30 days old.

Follow these steps to open and use the View Cleared Alerts window:

  1. In the Alerts screen, click the View Cleared Alerts button next to the List Filter field to open the View Cleared Alerts window. (See Alerts: Viewing for more information about accessing the Alerts screen of the HPM window.)

  2. Specify the alert View Settings; these define the set of alerts you wish to view:

    • Specify the devices of interest; All devices are selected by default. To select a particular set of devices:

    • Click the Select button to open the Select Devices dialog box.

    • Select the desired device(s); deselect any devices you wish to exclude.

    • Click OK to close the Select Devices dialog box.

    • Specify the types of Alerts to display: select or deselect Critical, Warning and Normal.

    • Define the desired Time Range by choosing a From date and time, and a To date and time. All alerts with a First Seen time within this range will be displayed.

From and To each present a standard drop-down calendar used to select a month and day.

Use the time field below each calendar to specify the precise start or end time, respectively. Highlight a digit and click the up or down arrow, or simply type the desired number. You can also click the Now button to specify the present moment.

  1. Click the Search button to display the defined set of alerts.

Note that the View Cleared Alerts window provides a List Filter field that you can use to filter the cleared-alerts display. Using this field is described in Using The List Filter Fields.

Refer to Working with Table Columns for other methods of filtering this table.

SNMP Trap Forwarding Notification

In 4.6 and earlier versions of Security Manager, e-mail notifications were sent to users when Health and Performance Monitor alerts were generated for ASA, IPS, and VPN.

This framework has been enhanced for Security Manager 4.7 to send SNMP trap notifications in addition to e-mail notifications. Security Manager 4.7 converts the alerts to traps and sends them to the centralized SNMP trap server. SNMP v1, v2c, and v3 are supported. A trap is generated the first time an alert is seen and again if the severity increases, resulting in a trap being generated a maximum of 2 times, as is done with e-mail notification.

SNMP trap forwarding notification has the following pre-requisites:

  1. An SNMP trap receiver (server) is available. More than one server can be used for a given Security Manager installation.

  2. An ASA device is available.

  3. An IPS sensor running IPS 7.0.x or later is available.

  4. Health and Performance Monitor is enabled.


Tip

To verify that Health and Performance Monitor is enabled, navigate to Configuration Manager > Tools > Security Manager Administration... > Health and Performance Monitor.


  1. Normal or priority monitoring for the ASA device and the IPS sensor Device is enabled in Health and Performance Monitor.

  2. The alert settings for firewall, IPS, and VPN are enabled.


Tip

To enable the alert settings for firewall, IPS, and VPN, navigate to Health and Performance Monitor > Tools > Alert Configuration.


MIB Documentation

The information in this section documents which MIB Security Manager uses to send the trap notification and what OID the user has to look for to get the particular alert information.

For the SNMP trap, Security Manager uses "CISCO-DEVICE-EXCEPTION-REPORTING-MIB"

The following list contains the OID details and the information that it contains:

  • iso.org.dod.internet.mgmt.mib-2.system.sysUpTime.0 (shows how long the HPM server has been up and running) – calculated using the formula, System Up time = Current Security Manager server time - HPM Service start up time.

  • snmpTrapOID (1.3.6.1.4.1.9.9.224.2.0.1)

  • .1.3.6.1.4.1.9.9.224.1.1.5.1.2 (lists the alert rule name like memory usage)

  • .1.3.6.1.4.1.9.9.224.1.1.5.1.3 (constant value of 1, specifies IP address type)

  • .1.3.6.1.4.1.9.9.224.1.1.5.1.4 (device display name – device type and if any cluster node, then its name)

  • .1.3.6.1.4.1.9.9.224.1.1.5.1.5 (severity of the alert)

  • .1.3.6.1.4.1.9.9.224.1.1.5.1.6 (time stamp of the alert) – Current Security Manager server time - Alert first seen time

  • .1.3.6.1.4.1.9.9.224.1.1.5.1.7 (maximum 1024 char string describing the alert)

  • .1.3.6.1.4.1.9.9.224.1.1.5.1.8 (Security Manager Server name)

This section contains the following topics:

SNMP Trap Entries Dialog Box

Use the SNMP Trap Entries dialog box as your launching point for SNMP trap forwarding notifications.

Navigation Path

In Health and Performance Monitor, select SNMP Trap Configuration from the Tools menu. The SNMP Trap Entries dialog box contains the following areas:

  • The Settings table, which displays the traps that are currently configured.

  • Add, Edit, and other options for working with SNMP trap entries.

Field Reference

Table 7. The Settings table and other options in the SNMP Trap Entries dialog box

Field

Description

Forward Trap To table

Status column

Enabled or Disabled. A maximum of 5 trap forwarding hosts can be enabled at any given time.

IP/Host column

IP address or hostname of the centralized SNMP trap server. Neither the local host nor the Security Manager server is allowed to be used as the SNMP server, in order to avoid problems with performance.

PORT column

The port used by the centralized SNMP trap server

SNMP Version column

v1, v2c, or v3. The default value is v2c.

Username column

The username for authentication to the SNMP server

Authentication Algorithm column

MD5 or SHA

Encryption Algorithm column

DES, 3DES, AES128, AES192, and AES256

Add

Used to add a new configuration. The Add button opens the Add Trap Settings dialog box.

Edit

Used to edit an existing configuration. The edit button opens the Edit Trap Settings dialog box.

Copy Settings

Used to copy all the settings in an existing configuration. The Copy Settings button opens the Copy SNMP Trap Settings dialog box.

Delete

Used to delete an existing configuration

Enable

Used to enable an existing configuration

Disable

Used to disable an existing configuration

Add/Edit/Copy SNMP Trap Entries Dialog Box

Use the Add/Edit/Copy SNMP Trap Entries dialog box to add, edit, and otherwise work with and configure SNMP traps.

Navigation Path

In Health and Performance Monitor, select SNMP Trap Configuration from the Tools menu. Then select Add, Edit, or Copy Settings.

The Add/Edit/Copy SNMP Trap Entries dialog box contains the following areas:

  • The IP/Host and Port area

  • The Trap Settings area for FW Alerts, IPS Alerts, and VPN Alerts

  • The Trap Settings area for SNMP Options

Field Reference

Table 8. The Trap Settings area and other options in the Add/Edit/Copy SNMP Trap Entries dialog box

Field

Description

Trap Settings

Used to select all or only selected alerts for FW, IPS, and VPN, described in the following topics:

SNMP Options

RO Community String

(SNMP version v1 and v2c only)

The password used for authentication in SNMP version v1 or v2c.

Group Type

(SNMP version v3 only)

NOAUTH, AUTH, or PRIV.

Engine ID

(SNMP version v3 only)

The SNMPEngineID identifier used for authentication in v3.

User Name

(SNMP version v3 only)

The username for authentication to the SNMP server.

Authentication Password

(SNMP version v3 only)

The password for authentication to the SNMP server.

Authentication Protocol

(SNMP version v3 only)

MD5 or SHA.

Encryption Password

(SNMP version v3 only)

The password for MD5 or SHA encryption.

Encryption Protocol

(SNMP version v3 only)

DES, 3DES, AES128, AES192, and AES256.

NOTE: In order to use AES192, AES256, or 3DES, you must follow these steps:

  1. Download the unlimited strength cryptography policy .jar files from http://www.oracle.com/technetwork/ > Downloads > Java SE > Java Cryptography Extension (JCE) Unlimited Strength Jurisdiction Policy Files for JDK/JRE 7. (Click the download button to download the files by accepting the license agreement.)

  2. Replace local_policy.jar and US_export_policy.jar on your Security Manager server in the folder CSCOpx\MDC\vms\jre\lib\security.

  3. Restart your Security Manager server.