- Overview of Cisco IoT Field Network Director
- Installing Cisco IoT FND
- Generating and Installing Certificates
- Managing User Access
- Managing System Settings
- Managing Devices
- Managing Firmware Upgrades
- Managing Tunnel Provisioning
- Monitoring System Activity
- Managing High Availability Installations
- Troubleshooting IoT FND
Monitoring System Activity
This section describes how to monitor IoT FND system activity, including the following topics:
Using the Dashboard
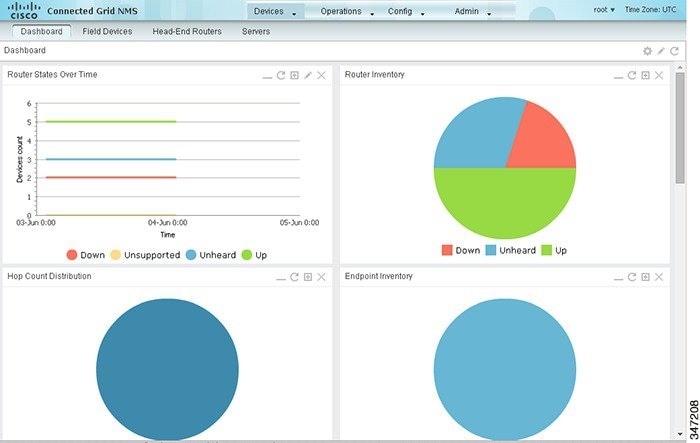
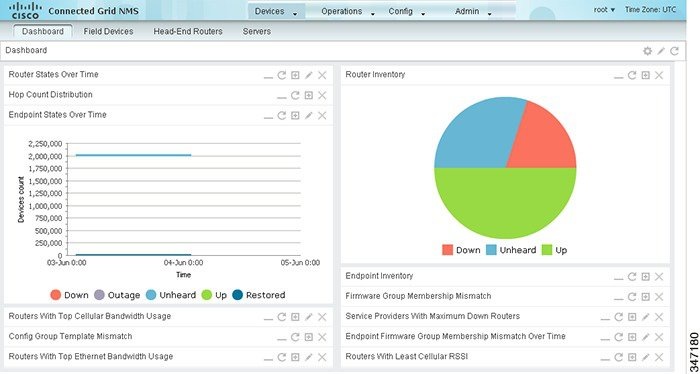
The IoT FND Dashboard (IoT FND Dashboard) displays dashlets to provide a visual overview of important network metrics.
This section describes the following Dashboard features:
■![]() Setting the Dashlet Refresh Interval
Setting the Dashlet Refresh Interval
Types of Dashlets
The Dashboard displays two types of dashlets:
■![]() Pie-chart dashlets display a ratio of device properties as a pie chart.
Pie-chart dashlets display a ratio of device properties as a pie chart.
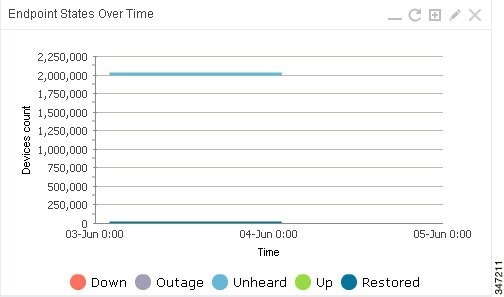
■![]() Line-graph dashlets display graphs that show device counts over time.
Line-graph dashlets display graphs that show device counts over time.
Tip: Graphs set to intervals longer than one day may not display the data at the last datapoint exactly as shown in the matching field on the Device Info page. This is because data aggregation is occurring less frequently than polling to update the fields on the Device Info page. Set these graphs to the 6h or 1d intervals to update the data more frequently. Use intervals longer than one day to view data trends.
Dashboard Dashlets
The IoT FND Dashboard dashlets are described below.
Repositioning Dashlets
The Dashboard is configurable to display charts in your preferred arrangement. To configure the Dashboard:
■![]() Click and drag the title bar of a chart to the desired position.
Click and drag the title bar of a chart to the desired position.
■![]() Click the close box to remove the chart from the page.
Click the close box to remove the chart from the page.
■![]() Click the interval button to do the following:
Click the interval button to do the following:
–![]() Define an interval for line-graph chart displays.
Define an interval for line-graph chart displays.
–![]() Define a custom interval for line-graph chart displays.
Define a custom interval for line-graph chart displays.
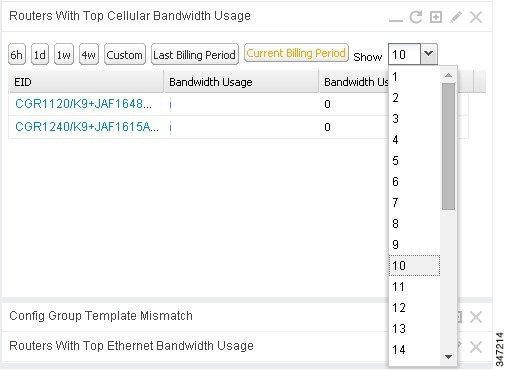
–![]() Select the number of devices to chart for line-graph chart displays.
Select the number of devices to chart for line-graph chart displays.
–![]() Select a series to refine data in line-graph chart displays.
Select a series to refine data in line-graph chart displays.
–![]() Filter line-graph chart displays by group.
Filter line-graph chart displays by group.
■![]() Click the Settings button in the title bar to set the refresh interval for all charts and add dashlets back to the Dashboard.
Click the Settings button in the title bar to set the refresh interval for all charts and add dashlets back to the Dashboard.
To better view dashlets in the bottom of the Dashboard, collapse a dashlet to just its title bar by clicking the dashlet show/hide button (  ). In Dashboard with Collapsed Dashlets the Config Group Template Mismatch dashlet is expanded in the Dashboard with several other dashlets collapsed above it. To refresh the Dashboard, click the Refresh button (
  ). To refresh a dashlet, click its Refresh button.
Figure 2 Dashboard with Collapsed Dashlets
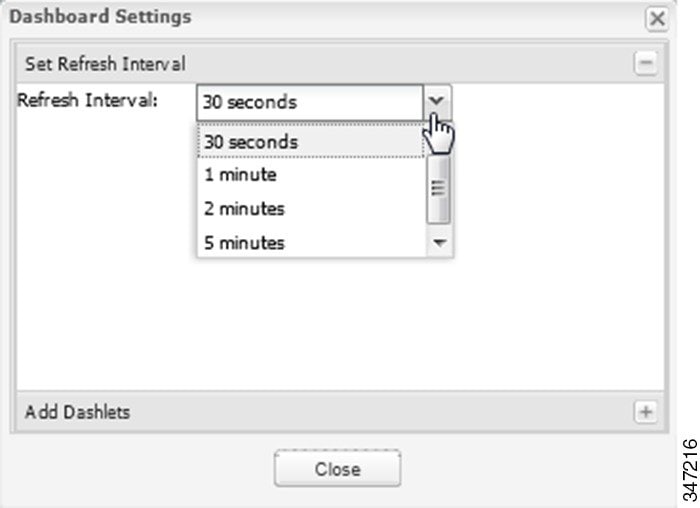
Setting the Dashlet Refresh Interval
To set the refresh interval for dashlets:
1.![]() Choose Devices > Dashboard.
Choose Devices > Dashboard.
2.![]() Click the Settings button (
Click the Settings button (  ).
).
3.![]() Click Set Refresh Interval.
Click Set Refresh Interval.
Note: On line-graph dashlets, open the filter bar and click an interval button to display metrics for that time period.
Adding Dashlets
To add dashlets to the Dashboard:
1.![]() Choose Devices > Dashboard.
Choose Devices > Dashboard.
2.![]() Click the Settings button ( ).
Click the Settings button ( ).
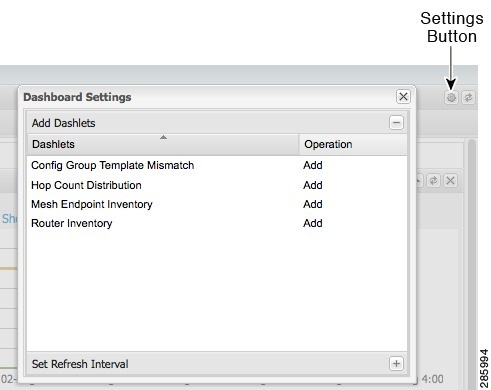
Note: No dashlets display in this dialog box if all are displaying on the Dashboard.
Removing Dashlets
To delete dashlets from the Dashboard:
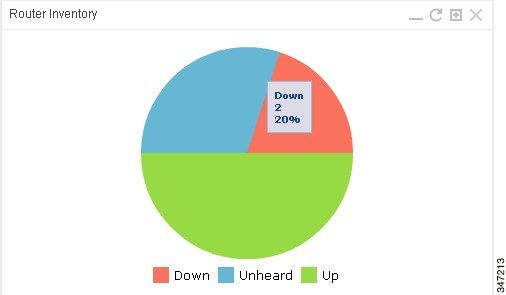
Using Pie Charts to Get More Information
Mouse over any segment of a pie chart to display a callout with information on that segment. Click any segment in the Router Inventory and Mesh Endpoint Inventory pie charts to display the devices in List View.
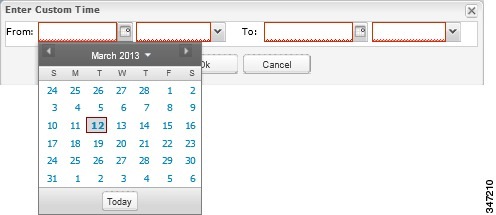
Setting Dashlet Time Properties
To specify the time interval for data collection for line-graph dashlets, click the interval icon (  ) in the title bar to display the 6h, 1d, 1w, 4w, or Custom buttons. The 6h button sets the data-collection time interval to the last six hours. The 1d button sets the time interval to the last 24 hours.
To specify a custom time interval for a line-graph dashlet:
2.![]() In the From fields, specify the beginning date and time.
In the From fields, specify the beginning date and time.
Collapsing Dashlets
Click the show/hide icon ( ) at the top-right of the dashlet to collapse it to its title bar.
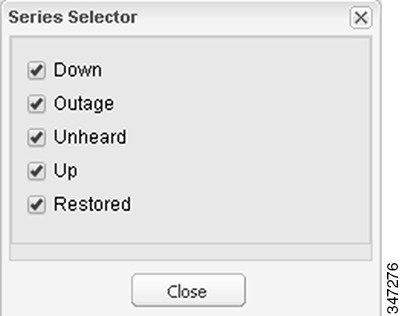
Using the Series Selector
You use the Series Selector to refine line-graphs to display by device status. The device options are:
■![]() Routers: Down, Outage, Unsupported, Unheard, and Up
Routers: Down, Outage, Unsupported, Unheard, and Up
■![]() Mesh Endpoint Config Group: Config Out of Sync and Config In Sync
Mesh Endpoint Config Group: Config Out of Sync and Config In Sync
■![]() Mesh Endpoint Firmware Group: Membership Out of Sync and Membership In Sync
Mesh Endpoint Firmware Group: Membership Out of Sync and Membership In Sync
■![]() Mesh Endpoint States: Down, Outage, Unheard, and Up
Mesh Endpoint States: Down, Outage, Unheard, and Up
2.![]() In the Series Selector dialog box, check the check boxes for the data series to show in the graph.
In the Series Selector dialog box, check the check boxes for the data series to show in the graph.
Using Filters
You use filters to refine the displayed line-graph data by groups. Applied filters display after the dashlet title.
1.![]() Click Add Filter in the line-graph dashlet pane.
Click Add Filter in the line-graph dashlet pane.
2.![]() From the first drop-down menu, choose a group type.
From the first drop-down menu, choose a group type.
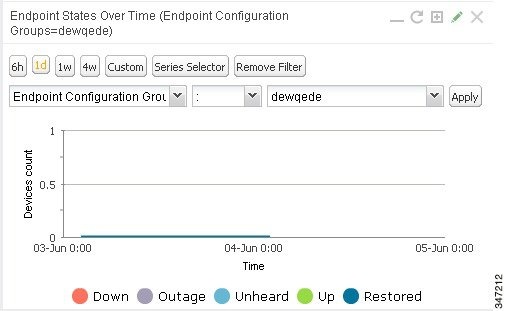
3.![]() From the third drop-down menu, choose a group.
From the third drop-down menu, choose a group.
The pencil icon is green and the filter displays next to the dashlet name to indicate that a filter is applied.
Note: Click the Remove Filter![]() button to remove the filter and close the filter options.
button to remove the filter and close the filter options.
Exporting Dashlet Data
You can export dashlet data to a CSV file.
1.![]() On the desired dashlet, click the export button (
On the desired dashlet, click the export button ( ).
).
A browser download session begins.
2.![]() Navigate to your default download directory to view the export file.
Navigate to your default download directory to view the export file.
The filename begins with the word “export-” and includes the dashlet name (for example, export-Node_State_Over_Time_chart-1392746225010.csv).
Monitoring Events
This section provides an overview of events and how to search and sort events, including the following topics:
Viewing Events
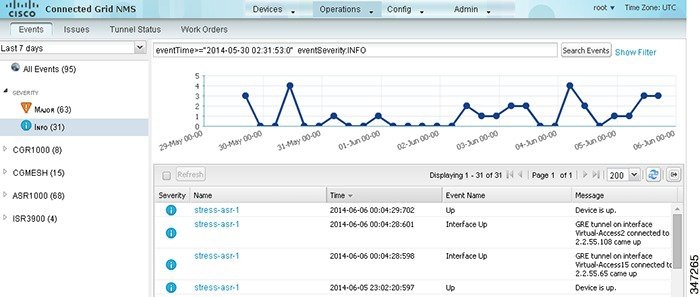
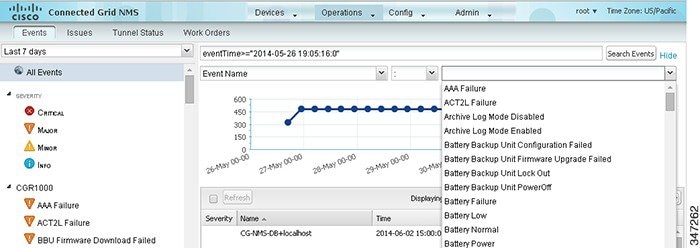
As shown in Events Page, the Events page (Operations > Events) lists all events for those devices that IoT FND tracks. All events are stored in the CG-NMS database server.
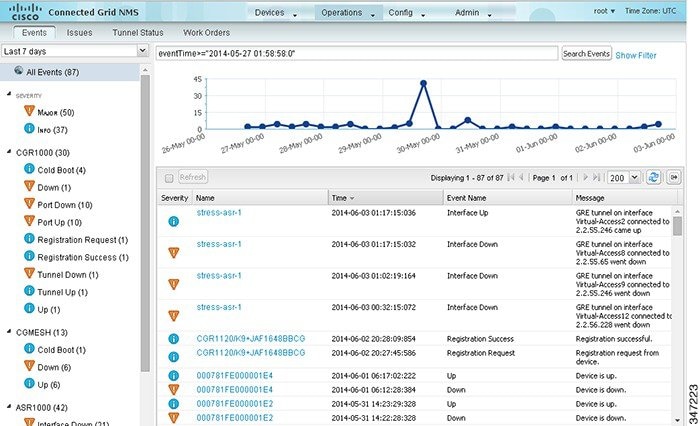
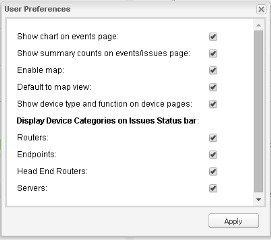
By default, the Events page displays the Events chart, which is a visual view of events in a time line. However, depending on the number of devices the CG-NMS server manages, this page can sometimes time out, especially when the system is fully loaded. In that case, open the Preferences window by choosing username > Preferences (top right), clearing the check boxes for showing chart and summary counts on the Events page, and clicking Apply.
To limit the amount of event data displayed on this page, use the Filter drop-down menu (at the top of the left pane). For example, you can show the events for the last 24 hours relative to the last 30 days, or events for a specific day within the last seven days.
To enable automatic refresh of event data to refresh every 14 seconds, check the check box next to the Refresh button. To immediately refresh event data click the Refresh button or the refresh icon.
Note: The amount of event data displayed on the Events page is limited by the data retention setting for events (Admin >![]() System Management > Data Retention).
System Management > Data Retention).

All Events Pane Filters
Use the preset filters in the All Events pane to only view those event types.
Device Events
In the left pane, IoT FND tracks events for the following devices:
Event Severity Level
In the left pane, select an event severity level to filter the list view to devices with that severity level:
Each event type has a preset severity level. For example, a Router Down event is a Major severity level event.
Preset Events By Device
IoT FND has a preset list of events it reports for each device it tracks. A list of those events is summarized under each device in the left pane on the Events page. For example, in the left pane click the show/hide icon ( ) next to Routers to expand the list of all events for routers.
Filtering by Severity Level
1.![]() Choose Operations > Events.
Choose Operations > Events.
2.![]() Click the SEVERITY show/hide arrow.
Click the SEVERITY show/hide arrow.
Note: Only severity levels that have occurred display.
3.![]() Click a severity level (CRITICAL, MAJOR, MINOR, OR INFO).
Click a severity level (CRITICAL, MAJOR, MINOR, OR INFO).
All events of that severity level display in the Events pane.
Advanced Event Search
To use the filter to search for events:
1.![]() Choose Operations > Events.
Choose Operations > Events.
2.![]() Under All Events (left pane), select an event category to narrow down your search.
Under All Events (left pane), select an event category to narrow down your search.
3.![]() Click the Show Filter link at the top of the main pane.
Click the Show Filter link at the top of the main pane.
4.![]() Use the filter drop-down menus and fields to specify your search criteria.
Use the filter drop-down menus and fields to specify your search criteria.
5.![]() Click the plus button (
Click the plus button ( ) to add the search strings to the Search field.
Repeat the process of adding search strings to the Search field as needed.
6.![]() Click Search Events or press Enter.
Click Search Events or press Enter.
The search results display in the Events pane.
You can also add search strings manually, as shown in the following examples:
| ■ |
|
| Note: Note the use of the asterisk (*) wild card with this filter. |
| ■ |
| Note: Do not enter a space between eventTime Figure 4 Search Events by Time Filter Example 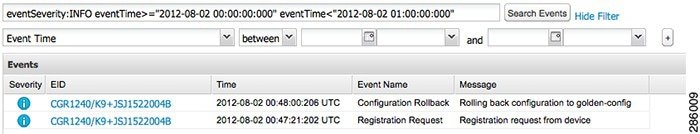
|
Sorting Events
To sort events in ascending or descending order, mouse over any column and select the appropriate option from the heading drop-down menu.
Searching By Event Name
To search by event name (for example, Battery Low):
1.![]() Choose Operations > Events.
Choose Operations > Events.
2.![]() Click the device type to search for in the left pane.
Click the device type to search for in the left pane.
3.![]() Click the Show Filter link at the top of the right pane.
Click the Show Filter link at the top of the right pane.
The filter fields display under the Search Events field.
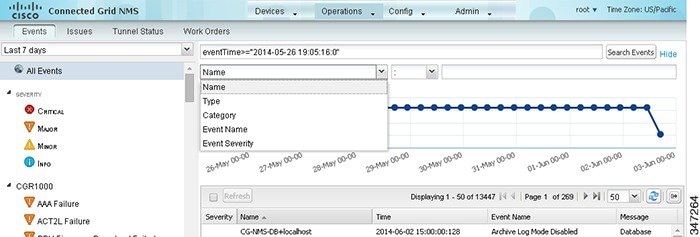
4.![]() Choose Event Name from the left drop-down menu.
Choose Event Name from the left drop-down menu.
5.![]() Choose the event name from the options in the right drop-down menu.
Choose the event name from the options in the right drop-down menu.
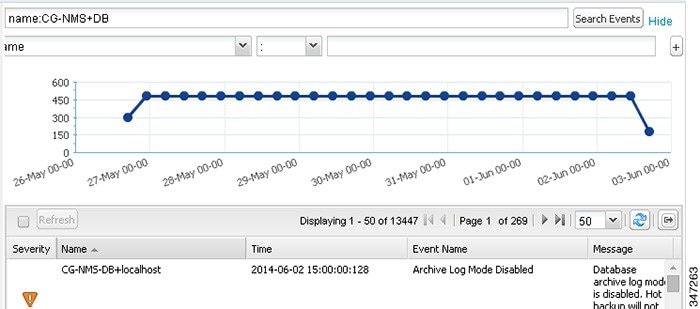
6.![]() Click the plus button () at the right to add the filter to the Search Events field.
Click the plus button () at the right to add the filter to the Search Events field.
The filter syntax appears in the Search Events field.
Exporting Events
You can export events to a CSV file to examine as a log of event severity, time, name and event description by device.
1.![]() Choose Operations > Events.
Choose Operations > Events.
2.![]() Click the desired severity level or device type in the left pane.
Click the desired severity level or device type in the left pane.
3.![]() Click the Export button (
Click the Export button (  ).
).
A browser download session begins.
4.![]() Navigate to your default download directory to access the CSV file.
Navigate to your default download directory to access the CSV file.
Monitoring Issues
This section provides an overview of issues and how to search for and close issues in IoT FND, including the following topics:
■![]() Viewing Device Severity Status on the Issues Status Bar
Viewing Device Severity Status on the Issues Status Bar
■![]() Searching Issues Using Predefined Filters
Searching Issues Using Predefined Filters
■![]() Search Issues Using Custom Filters
Search Issues Using Custom Filters
Viewing Issues
IoT FND offers different ways to monitor issues:
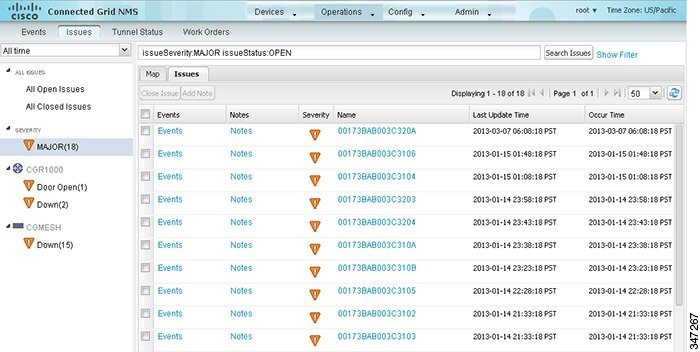
■![]() The Operations > Issues page (Issues Page) provides a snapshot of the health of the network by highlighting only major and critical events that are active within the network.
The Operations > Issues page (Issues Page) provides a snapshot of the health of the network by highlighting only major and critical events that are active within the network.
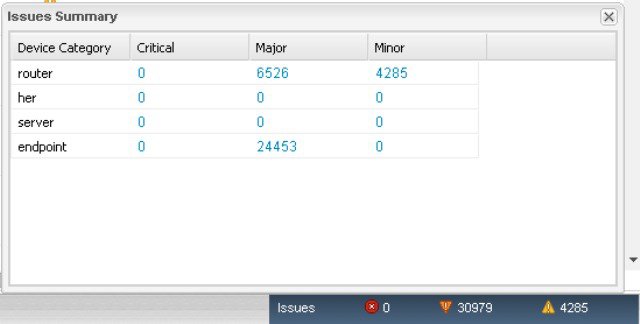
■![]() The Issues Status bar (Issues Status Bar) displays in the footer of the browser window and shows a count of all issues by severity for selected devices.
The Issues Status bar (Issues Status Bar) displays in the footer of the browser window and shows a count of all issues by severity for selected devices.
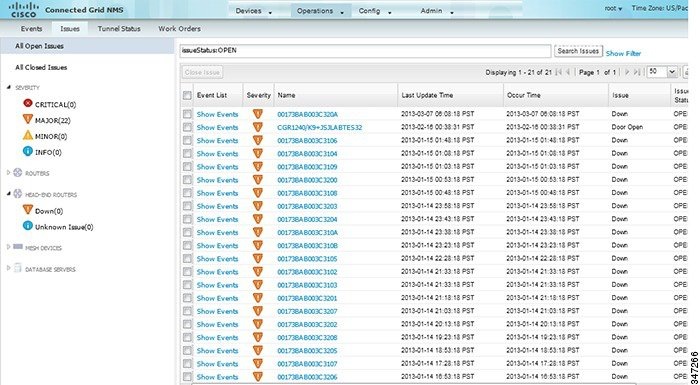
The Issues page provides an abbreviated subset of unresolved network events for quick review and resolution by the administrator. Issues remain open until either the associated event is resolved (and IoT FND generates a resolution event) or the administrator manually closes the event.
Only one issue is recorded when multiple entries for the same event are reported. Each issue has a counter associated with it. As an associated event is closed, the counter decrements by one. Every open or closed issue has an associated event.
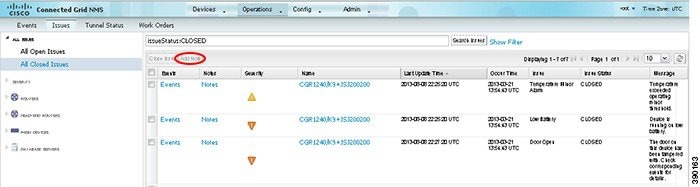
Note: The amount of closed issues data that displays on the Issues page is limited by the Keep Closed Issues for![]() data retention setting (Admin > System Management > Data Retention), which is based on the time the issue was closed. When the issue was closed displays as the Last Update Time for the issue.
data retention setting (Admin > System Management > Data Retention), which is based on the time the issue was closed. When the issue was closed displays as the Last Update Time for the issue.
Viewing Device Severity Status on the Issues Status Bar
A tally of issues listed by severity for the selected devices displays in the Issues status bar in the bottom-right of the browser window frame (Issues Status Bar). You can set the device types for issues that display in the Issues status bar in User Preferences (see Setting User Preferences).

Click the Issues status bar to view the Issues Summary pane (Issues Summary Pane), which displays issues listed by the selected device category. Click count links in the Issues Summary pane to view complete issue criteria filtered by severity on the Operations > Issues page.
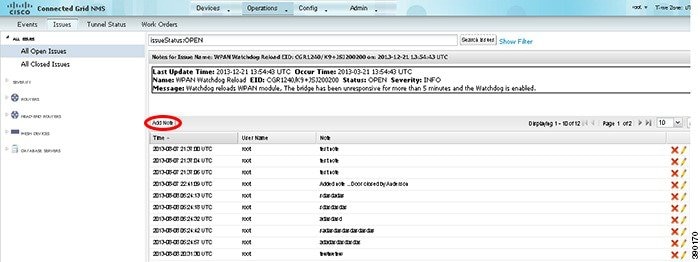
Adding Notes to Issues
On the Operations > Issues page, you can maintain notes on issues for the device. Click the Notes link inline with the issue to access any notes entered in the issue or add a note on the Notes for Issues Name page. You can and edit and delete notes from issues on this page. Issues can have multiple notes. The Notes for Issues Name page displays the time the note was created, the name of the user who wrote the note, and the text of the note. You can also add a note when closing a issue. Notes are purged from the database with the issue.
1.![]() Click the Notes link inline with the desired issue or check the check box of the device and click Add Note.
Click the Notes link inline with the desired issue or check the check box of the device and click Add Note.
The Notes for Issues Name pane displays. The issue in the following example has existing notes.
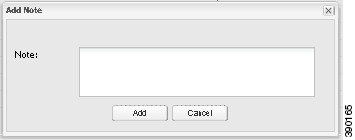
3.![]() Insert your cursor in the Note field and type your note.
Insert your cursor in the Note field and type your note.
The note text displays on the Notes for Issues Name pane in the Note column.
To add notes to issues with existing notes:
1.![]() Click the Notes link inline with the issue or check the check box of the device and click Add Note.
Click the Notes link inline with the issue or check the check box of the device and click Add Note.
The Notes for Issues Name pane displays.
2.![]() To add a new note to the issue, click Add Note.
To add a new note to the issue, click Add Note.
3.![]() Insert your cursor in the Note field and type your note.
Insert your cursor in the Note field and type your note.
To edit an existing note in an issue:
1.![]() Click the Notes link inline with the issue.
Click the Notes link inline with the issue.
The Notes for Issues Name pane displays.
2.![]() To edit an existing note, click the pencil icon (
To edit an existing note, click the pencil icon ( ) at the right of the note that you want to edit.

3.![]() Edit the note, and click Done when finished.
Edit the note, and click Done when finished.
To delete a note from an issue:
1.![]() Click the Notes link inline with the issue.
Click the Notes link inline with the issue.
The Notes for Issues Name pane displays.
2.![]() To delete a note, click the red X icon (
To delete a note, click the red X icon ( ) at the right of the note.

3.![]() Click Yes to confirm the deletion.
Click Yes to confirm the deletion.
To add a note when closing an issue:
1.![]() Check the check box of the issue to close.
Check the check box of the issue to close.
3.![]() In the Confirm dialog box, insert your cursor in the Note field and type the note text.
In the Confirm dialog box, insert your cursor in the Note field and type the note text.
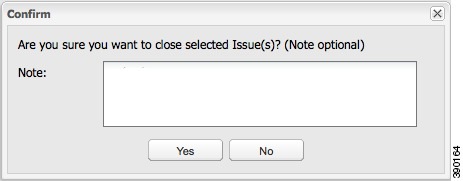
4.![]() To confirm that you want to close the issue and save the note, click Yes.
To confirm that you want to close the issue and save the note, click Yes.
Searching Issues Using Predefined Filters
To search for open issues for a specific system or severity level:
1.![]() Choose Operations > Issues.
Choose Operations > Issues.
To list only open issues, click All Open Issues (left pane).
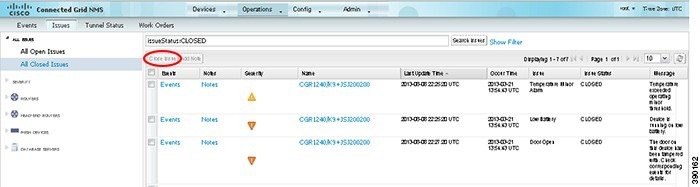
Note: By default, IoT FND displays all issues that occurred within the specified data retention period (see Configuring Data Retention). To see Closed Issues associated with an event type or severity level, change issueStatus:OPEN![]() to issueStatus:CLOSED in the Search Issues field, and then click Search Issues. To list all closed issues, in the left pane, click All Closed Issues.
to issueStatus:CLOSED in the Search Issues field, and then click Search Issues. To list all closed issues, in the left pane, click All Closed Issues.
2.![]() Click a device category, event type, or severity level to filter the list.
Click a device category, event type, or severity level to filter the list.
The filter syntax appears in the Search Issues field, and the search results display in the main pane.
Search Issues Using Custom Filters
To search by creating custom filters:
1.![]() Choose Operations > Issues.
Choose Operations > Issues.
3.![]() From the Filter drop-down menus, choose the appropriate options.
From the Filter drop-down menus, choose the appropriate options.
For example, to filter severity levels by EID:
| ■ |
You can also enter the search string in the Search Issues field. For example:
issueSeverity:CRITICAL issueStatus:OPEN eid:CG-NMS-DB+localhost
The issues, if any, display in the Search Issues section (right pane).
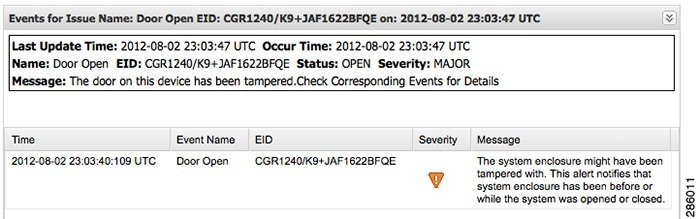
5.![]() Click the Events link to display events associated with an issue.
Click the Events link to display events associated with an issue.
The Events for Issue Name pane displays all events for that device.
6.![]() Click Search Issues or any link in the left pane to return to the Issues pane.
Click Search Issues or any link in the left pane to return to the Issues pane.
Closing an Issue
In most cases, when an event is resolved, the issue is closed automatically by the software. However, when the administrator has actively worked on resolving the issue, it might make sense to close the issue directly. When the issue is closed, IoT FND generates an event.
1.![]() Choose Operations > Issues.
Choose Operations > Issues.
2.![]() Locate the issue by following the steps in either the Searching Issues Using Predefined Filters or Search Issues Using Custom Filters section.
Locate the issue by following the steps in either the Searching Issues Using Predefined Filters or Search Issues Using Custom Filters section.
3.![]() In the Search Issues section (right pane), check the check boxes of the issues to close.
In the Search Issues section (right pane), check the check boxes of the issues to close.
Viewing Device Charts
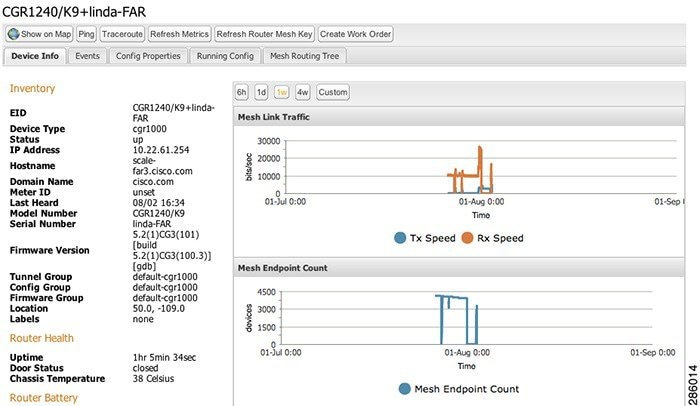
Router Charts
IoT FND provides these charts in the Device Info pane on the Device Details page for any FAR:
FAR Device Charts shows the Mesh Link Traffic and Mesh Endpoint Count charts.
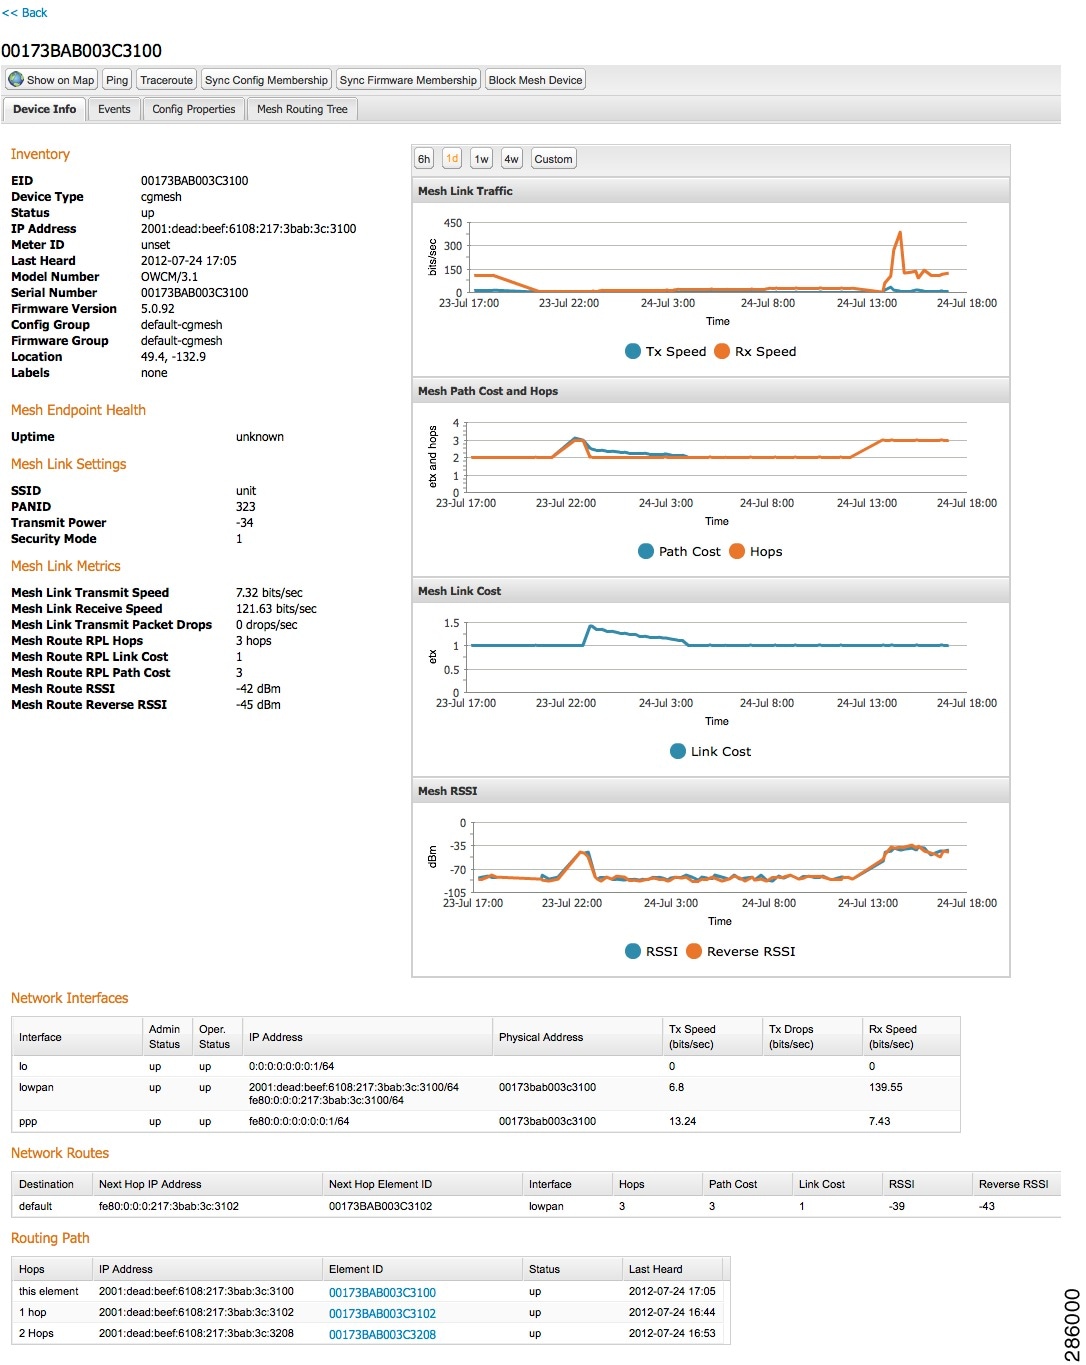
Mesh Endpoint Charts
IoT FND provides the charts listed in Device Detail Charts in the Device Info pane on the Device Details page (Mesh Endpoint Device Charts) for any ME.
|
|
|
|---|---|
Shows the RPL path cost value between the element and the root of the routing tree over time (see Configuring RPL Tree Polling). |
|
Shows the RPL cost value for the link between the element and its uplink neighbor over time. |
|
Shows the measured RSSI value of the primary mesh RF uplink (dBm) over time. |
Figure 9 Mesh Endpoint Device Charts
 Feedback