Add-Ons and GUI Customizations
WAE Design supports tools for customizing the GUI, enabling you to tailor it to meet your specific needs.
Add-On Applications
WAE Design provides basic tools for incorporating add-ons (scripts or executables) into the WAE Design GUI.
- CLI tools for editing plan files, such as
table_extract,table_edit, andtable_replace. - A framework for creating dialog boxes for data entry to the add-on (see Create Add-Ons).
Once registered with the WAE Design GUI, add-ons are accessible from the Add-Ons menu. If you do not see an add-on that you expect, choose Add-Ons > Find Add-Ons.
Create Add-Ons
Step 1![]() Create an executable to perform the add-on task. This executable processes specific CLI parameters, which the GUI then uses to pass details of plan files, reports, and options specified through the add-on dialog box. See Construct Add-On Executable.
Create an executable to perform the add-on task. This executable processes specific CLI parameters, which the GUI then uses to pass details of plan files, reports, and options specified through the add-on dialog box. See Construct Add-On Executable.
Step 2![]() Construct the add-on’s configuration file (
Construct the add-on’s configuration file ( addon.txt), which contains two tables. See Construct addon.txt.
Step 3![]() Construct the
Construct the return-config-file parameter of the executable to specify the WAE Design GUI behavior upon exiting the add-on. See Construct return-config-file.
Step 4![]() Register the add-on with the WAE Design GUI, which is putting the executable and
Register the add-on with the WAE Design GUI, which is putting the executable and config.txt file where they can be discovered by WAE Design. See Register Add-Ons.
Construct Add-On Executable
The add-on can invoke any executable file, such as a shell script or binary executable. The executable must recognize the parameters listed in Table 7-1 , which are passed to the add-on executable when it is called from the GUI.
All parameters except -plan-file are used by the WAE Design GUI to pass a temporary file or directory name to the add-on script. The script then optionally adds the contents to create the desired file or report. For example, you can create an add-on that generates reports on the existing plan file, as well as one that returns a new plan for display in the GUI.
|
|
|
|---|---|
Required: The plan file in.pln format that is currently active in the GUI. |
|
Optional: A filename to which the add-on saves a modified version of the plan file. The WAE Design GUI opens this new plan file after the add-on has completed. |
|
Optional: A filename to which the add-on writes a report in PDF format. When exiting the add-on, this report is opened using the default PDF viewer. For information on creating PDF reports, see Reporting Tools . |
|
Optional: A directory name in which the add-on creates a report that is imported into the currently active plan file and opens the report to its first section. The ShowReport value in the <AddOnReturnConfig> table can show this same report. The ShowReport value also overrides the report-dir value. See Construct return-config-file. For information on creating reports that can be stored in plan files, see Reporting Tools . |
|
Optional: A filename to which the add-on writes a plain text report section. The WAE Design GUI places this report section in an Add-Ons report in the active plan file. This parameter is available for backward compatibility. We recommend you use the report-dir parameter instead. The ShowReport value in the <AddOnReturnConfig> table overrides this property value. See Construct return-config-file. |
|
The filename to which the add-on writes the instructions on WAE Design GUI behavior after the add-on has completed. This file contains an <AddOnReturnConfig> table. For information, see Construct return-config-file. This parameter is required if using the report-file parameter. |
Error Messages and Warnings
The add-on can generate error messages and warnings by writing them to the standard output to the GUI log window (accessed via Window > Log Window).
- Error messages must start with the word 'Error:' on a new line.
- Warning messages must start with the word 'Warning:' on a new line.
The add-on can inform the WAE Design GUI of its progress by writing the percentage completed to the standard output. This must be a single line containing a number followed by the '%' character. The GUI displays this progress in a progress bar while the add-on is running.
A return value of 0 from the add-on indicates that the add-on ran successfully. Any other value indicates an add-on failure.
Construct addon.txt
The addon.txt configuration file contains two tables.
-
<AddOnConfigs>—Defines the add-on name, provides a description of the add-on, and identifies how to invoke the executable should be invoked ( Table 7-2 ). -
<AddOnOptions>—Optional: Defines input fields in the add-on dialog box ( Table 7-3 ). A CLI parameter is specified for each field, and these are passed to the executable, together with the input values. The rows are sequentially read.
Construct return-config-file
The file named by the return-config-file parameter stores the return configuration information in the <AddOnReturnConfig> table ( Table 7-4 ). This table contains a pair of columns, Property and Value, where the values define the WAE Design GUI behavior upon exiting the add-on. For information on the GUI behavior of views, traffic levels, service classes, and queues see the Cisco WAE Design User Guide. For information on plot layouts and traffic utilization colors, see the Cisco WAE Network Visualization Guide.
|
|
|
|---|---|
Output (resulting) plan filename. The string can contain a $1 variable, which is the name of the input plan file (without file extension). The default is $1-out. Example: If the input plan filename is euro_geo.pln, by default the output filename is euro_geo-out.pln. |
|
The GUI displays the specified layout view. If not specified, the GUI displays the Default layout, which is customary for a newly opened plan file. |
|
The GUI displays traffic for the specified queue. If both ServiceClass and Queue are specified, the ServiceClass value has priority. |
|
The GUI displays traffic for the specified service class. If not specified, the GUI displays undifferentiated traffic. |
|
The GUI opens the report, including the report-dir report, which should be inserted into the plan before this rule is applied. |
|
The report opened by ShowReport opens to this section. If not specified, the report opens to the first section. |
|
The GUI displays this traffic level. If not specified, the GUI displays the Default traffic level, which is customary for a newly opened plan file. |
|
The GUI fills interfaces with these colors to show levels of traffic utilization. If not specified, the default threshold settings and colors are used. Following is the format, where threshold is a real number and colors are of the form #RRGGBB (standard HTML color names): Format: threshold%<=color<=threshold% |
|
The GUI displays this user-defined plot view. If both View and UserView are specified, the View value has priority. For information on creating plot views, see Customized Network Plot Views. |
|
The GUI displays one of these views. If not specified, the GUI displays whichever view is appropriate for the output plan file: |
Register Add-Ons
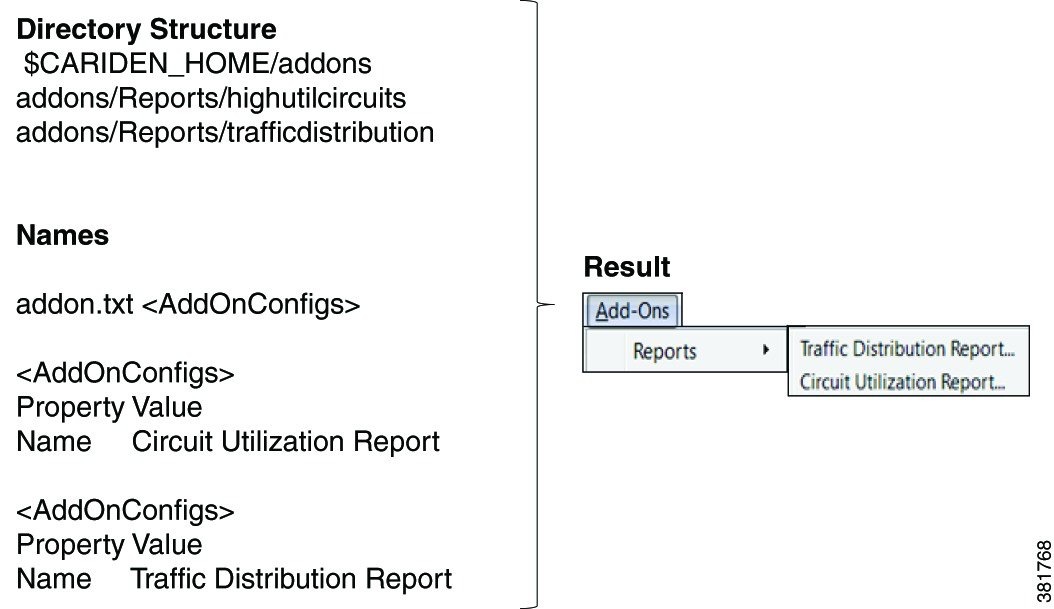
To register an add-on with WAE Design, create a subdirectory for the add-on in the $CARIDEN_HOME/addons directory. At a minimum, this directory must contain the addon.txt configuration file that defines the dialog box and information about the executable.
WAE Design adds a menu item in the Add-Ons menu using the Name parameter in the <AddOnConfigs> table. If this parameter is omitted, WAE Design uses the name of the subdirectory.
To create multiple levels of submenus in the WAE Design GUI, simply create nested subdirectories. See Figure 7-1 for an example.
Add-ons and their submenus appear in the Add-Ons menu the next time you launch the GUI, or after you choose Add-Ons > Find Add-Ons.
Figure 7-1 Example Add-On Submenus
Example Add-Ons
WAE Design includes three example add-ons: Circuit Upgrade, Circuit Utilization Report, and Traffic Distribution Report.
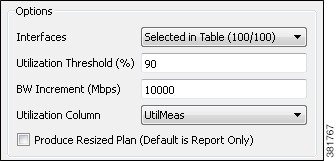
Circuit Upgrade Add-On
The $CARIDEN_HOME/addons/CircuitUpgrade directory includes a sample add-on named CircuitUpgrade that analyzes the Interfaces table Utilization columns. Upon exiting the add-on dialog box (Figure 7-2), the add-on executable does the following:
- For every interface whose utilization (in the specified utilization column) exceeds a threshold, the circuit capacity is increased by the specified increment until the condition is met.
- A report named Circuit Upgrade is generated. The report contains only one section, which is named List of Upgrades.
- The WAE Design GUI opens a new plan file using the same name with -upgrade added as a suffix.
Figure 7-2 Example Circuit Upgrade Dialog Box
Tab and Group Customizations
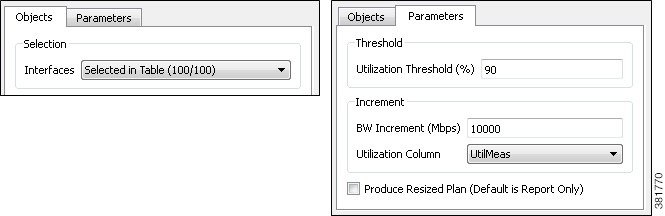
This example <AddOnOptions> table customizes the default sample addon.txt file as follows (Figure 7-3).
- Creates two tabs: Objects and Parameters
- In the Objects tab, creates a group named Selection.
- In the Parameters tab, creates two groups: Threshold and Increment. Another available selection is created to give the option to produce the resized plan file is left ungrouped. A resized plan is an output plan that identifies which circuits need to be upgraded; they are resized based on the criteria set. If not used, you only receive a report detailing the actions WAE Design suggests making.
|
|
|||||||
Figure 7-3 Example Customizable Tabs and Groups
Customized Network Plot Views
Map Server
WAE Design uses an online detailed geographic map database to draw the detailed map background, which is one of the canvas plot options available in the WAE Design GUI.
For information on viewing a detailed background map and changing plot options, see the Cisco WAE Network Visualization Guide.
Static Backgrounds
By editing the plan file directly (for example, through an add-on), you can add a user-defined static view to display interfaces with customized color fills and fill percentages. The view then appears as an option in the Network Plot drop-down list located in the far left corner of the visualization toolbar.
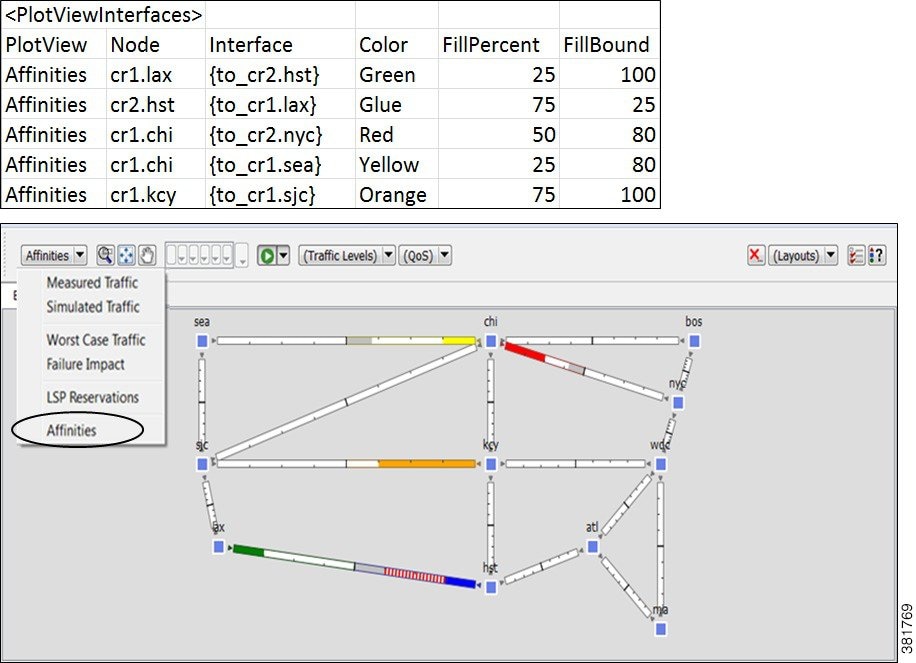
To create this custom network plot view, create or edit a <PlotViewInterfaces> table ( Table 7-5 ). You must have an entry (row) for each interface you want you want color filled, and each of these interfaces must have the same PlotView name. For example, Figure 7-4 shows four interfaces in the user-defined plot view named Affinities.
|
|
|
|---|---|
Name of the plot view; this name appears in the Network Plot drop-down list. |
|
Used only if the FillPercent color represents a utilization percentage. FillBound is the maximum utilization percentage possible, or the QoS bound. The remainder of the interface is gray. The default is 100%.
|
Figure 7-4 Example <PlotViewInterfaces> Table Defining an Affinities View and Coloring Five Interfaces
 Feedback