- Overview
- Understanding Objects, Properties, and Data
- Viewing Graphs
- Working with Tables and Filters
- Exploring Network Data
- Viewing Inventory
- Configuring and Running Reports
- Running Traffic Reports
- Running Health Reports
- Running Deviation Reports
- Running Ad Hoc Reports
- Managing Reports
- Using the Report Log
- Viewing Network Health and Weathermaps
Cisco WAE Live 6.4.1 User Guide
Bias-Free Language
The documentation set for this product strives to use bias-free language. For the purposes of this documentation set, bias-free is defined as language that does not imply discrimination based on age, disability, gender, racial identity, ethnic identity, sexual orientation, socioeconomic status, and intersectionality. Exceptions may be present in the documentation due to language that is hardcoded in the user interfaces of the product software, language used based on RFP documentation, or language that is used by a referenced third-party product. Learn more about how Cisco is using Inclusive Language.
- Updated:
- January 19, 2016
Chapter: Viewing Network Health and Weathermaps
Viewing Network Health and Weathermaps
The Map page provides a high-level view of the current network health through a near-realtime weathermap and health panels of critical peering traffic and network issues. Because the information is current and highly visual, you can see at a glance whether and where there are problems in the network, such as congestion. Because the Map and Explore capabilities are tightly coupled, you can immediately drill down to detailed information to troubleshoot network issues.
WAE Live weathermaps are generated by the network topology and traffic information that WAE Collector discovers. This information is stored in a series of plan files called snapshots that are navigable by date.
Two panels, Peering and Events, offer immediate information on network health. The Peering panel enables you to monitor top peers and verify traffic is balanced across peers and sites. The Events panel lists the predominate types of network concerns, such as interfaces down, enabling you to determine how many there are total and how many have changed since the last snapshot was taken.
To view a weathermap for a specific network, select it from the Network list (top left). If there is only one network configured, the word “default” appears.

Note![]() The visualization of the weathermap is based on how your administrator laid out the template. For detailed descriptions of the objects, backgrounds, and traffic utilization colors, see the Cisco WAE Network Visualization Guide.
The visualization of the weathermap is based on how your administrator laid out the template. For detailed descriptions of the objects, backgrounds, and traffic utilization colors, see the Cisco WAE Network Visualization Guide.
Reading Network Health
Assessing Traffic Utilization
WAE Live offers multiple ways to quickly assess network health. The most immediate way is to look at the color of the interfaces, nodes, and sites in the weathermap and to look at the color of the peer icons in the Peering health panel. These colors represent the outbound traffic utilization on the interface. If parallel circuits1 have been grouped, these utilizations represent the average of the grouped interfaces.
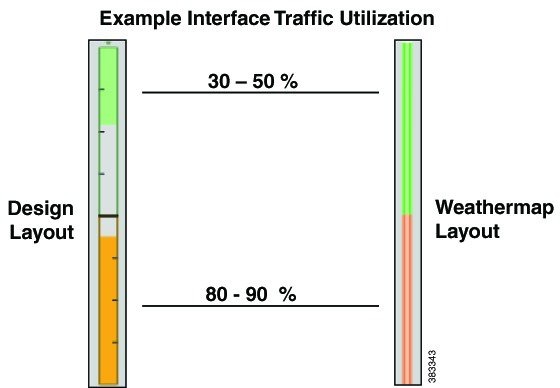
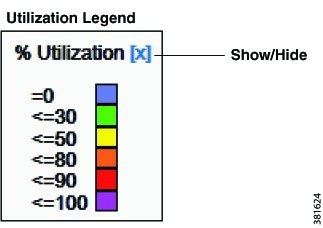
Default utilization colors depends on how your administrator set up the visualization of the plan file. This visualization might be either in a Design or Weathermap color scheme. Default colors are blue, green, yellow, orange, red, and purple (Design) or magenta (Weathermap), and sequentially each of these colors represents increased utilization.
Note these colors are configurable in the WAE Design GUI where the administrator creates the template for the WAE Live plan files. The utilization legend at the bottom of the weathermap identifies the template’s utilization colors and their values.
Peering Health Panel
The Peering health panel (Figure 14-1) is based on BGP information. It shows the highest traffic utilization per peer and per site. This panel enables you to monitor critical peers and their growth so that you can quickly detect and overcome congestion issues.
Figure 14-1 Peering Health Panel
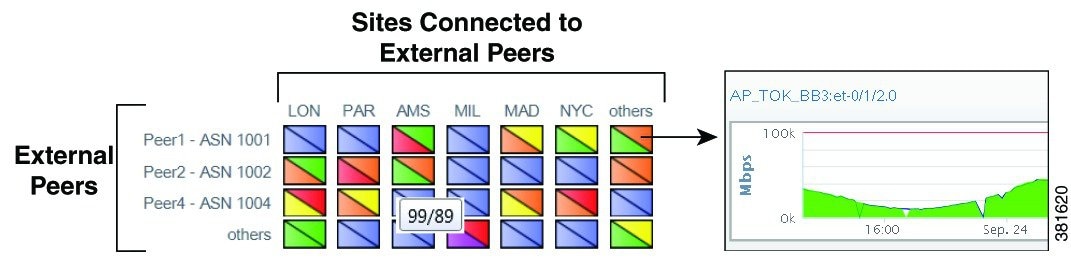
The far left column lists the peers, while each top column lists the associated sites. The icons represent the traffic flowing between the two. While the color gives you a visual indication of traffic, hovering the mouse over each icon lists the numeric values.

To navigate to graphs for all interfaces connected to that peer, click the icon. Graphs appear for only those interfaces connecting this peer on its associated site. To go to the associated Explore page for these interfaces, click the All Interfaces link at the top of the graphs.
Note![]() The administrator can configure this panel name to something other than “Peering.” For information, see the Cisco WAE Live Administration Guide.
The administrator can configure this panel name to something other than “Peering.” For information, see the Cisco WAE Live Administration Guide.
Events Health Panel
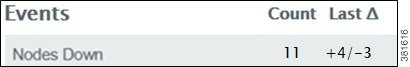
The Events health panel lists the number of current events and the number of changes since the last plan file was received.
- Event —The event being tracked. The default set is as follows, though these can be configured differently.
–![]() External (peering) interfaces over 80%
External (peering) interfaces over 80%
–![]() Internal (non-peering) interfaces over 80%
Internal (non-peering) interfaces over 80%
Example: If there are 10 nodes total that are down, the Nodes Down Count is 10.
Example: If 4 nodes came up since the last snapshot, and 3 nodes went down, the Last Delta column would show +4/-3. Note, if the Count was previously 10, it would now be 11.
Note![]() The administrator can configure this panel name to something other than “Events” and can configure a different set of events to appear in this panel. For information, see the Cisco WAE Live Administration Guide.
The administrator can configure this panel name to something other than “Events” and can configure a different set of events to appear in this panel. For information, see the Cisco WAE Live Administration Guide.
Navigating to Related Explore Information
From a weathermap, you can navigate to related Explore information for nodes and interfaces. Note that regardless of the plan file date, the resulting Explore information is the most recent. For more information on Explore capabilities, see Exploring Network Data .
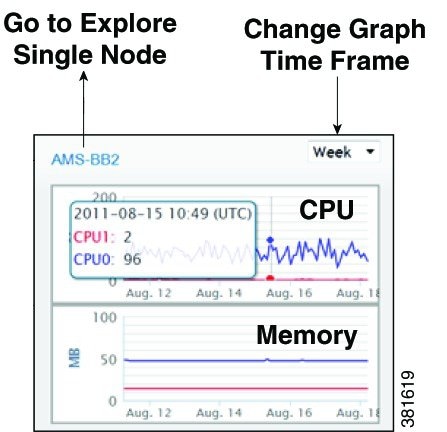
Graphing Node CPU and Memory Usage
To graph node CPU and memory usage, click its parent site. From here you can graph usage for this particular node, or you can go to the Explore tables for one or more nodes in the site.
|
|
|
|---|---|
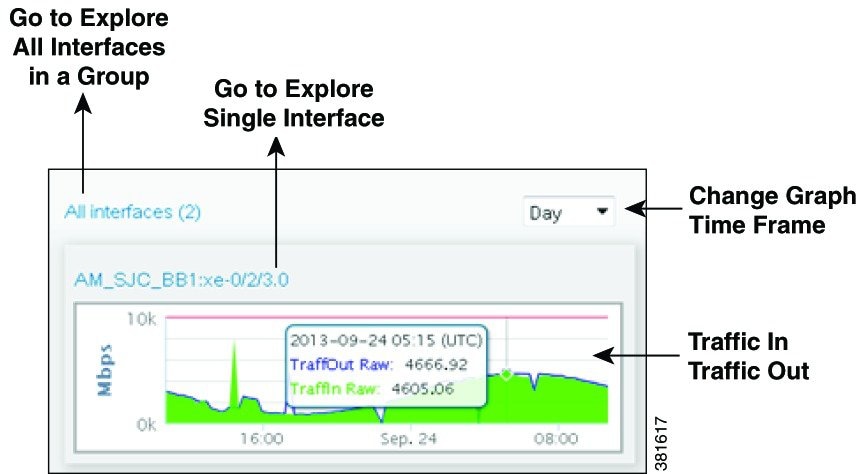
Graphing Interface Traffic In/Traffic Out
To graph the traffic coming into an interface and leaving it, click the interface. The height of the interface is in relationship to the capacity so you can see how close the interface is to being filled. If the weathermap is displaying an interface group, all interfaces within it appear in the graph.
From here you can go to the Explore tables for one or more interfaces in the group by clicking on name of the interface.
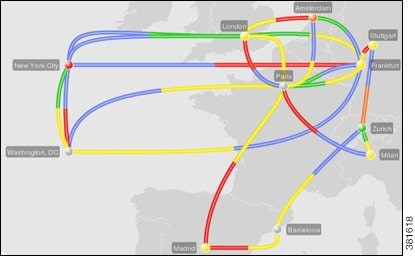
Weathermap
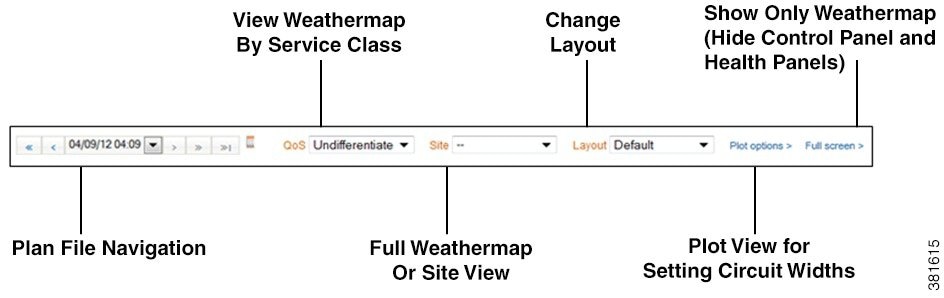
By default, the weathermap shows the current topology. The control panel (Figure 14-2) at the top enables you to navigate to different snapshots (plan files from different times and dates), view different QoS service classes and layouts, view specific plots, and change the manner in which circuits are displayed (Plot Options). From the weathermap and from its sites, you can navigate to more specific information about interfaces and nodes as described in Navigating to Related Explore Information.
Map Objects
The objects appearing in on the Map page represent the network topology. How they appear can differ depending on how the layout was set up to visualize the network.
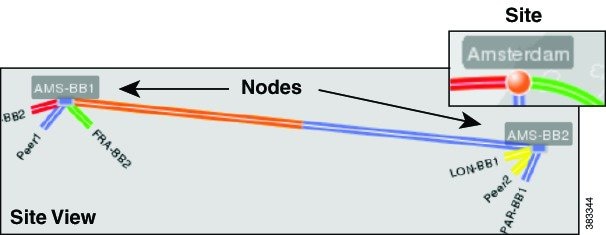
- A node (router) appears as either a disk or a rectangle. Nodes can reside both inside and outside of sites.
- A site is a WAE construct to make visualization of networks easier to read. Sites appear as either a square (which is a peer or non-peer site), a circle (non-peer site), or cloud (peer site).
Unless a site is empty, there is a hierarchy of the sites and nodes that a site contains. A site can be both a parent and a child site. A site that contains another site is called a parent site. The contained nodes and sites are called children. Often the child nodes and sites are geographically co-located. For example, a site might be a PoP where the routers reside.
–![]() In the weathermap, the parent site shows all egress inter-site interfaces of all nodes contained within it, no matter how deeply the nodes are nested. Similarly, this is true for each child site view within it.
In the weathermap, the parent site shows all egress inter-site interfaces of all nodes contained within it, no matter how deeply the nodes are nested. Similarly, this is true for each child site view within it.
–![]() In a site view, the “All Nodes” and “All Interfaces” links show a count for (and filter to) all nodes and interfaces directly within that site. That is, it does not show nodes and interfaces for nested sites.
In a site view, the “All Nodes” and “All Interfaces” links show a count for (and filter to) all nodes and interfaces directly within that site. That is, it does not show nodes and interfaces for nested sites.
–![]() To open a site view, follow one of these two steps.
To open a site view, follow one of these two steps.
– Select a site from the Site drop-down list in the control panel.
– Double-click a site in the weathermap.
- Interface—Each pair of interfaces connects two different nodes. Their colors represent the outbound traffic utilization. For more information, see Assessing Traffic Utilization.
Control Panel Options
- Plan File Navigation —Click to save the file to a location of your choice. See Navigating to a Specific Weathermap.
- QoS —Displays the type of traffic to view in the weathermap as differentiated by the QoS model. Note that if you navigate to an Explore page while displaying QoS traffic, the Explore page shows only undifferentiated traffic.
–![]() Undifferentiated traffic—Aggregate traffic on an interface.
Undifferentiated traffic—Aggregate traffic on an interface.
–![]() Service class—Administratively defined classification of traffic that is not discovered.
Service class—Administratively defined classification of traffic that is not discovered.
–![]() Queue—Interface traffic belonging to the selected queue. Queues and their traffic are discoverable by WAE Collector.
Queue—Interface traffic belonging to the selected queue. Queues and their traffic are discoverable by WAE Collector.
– They can be manually created and configured during the snapshot process to be associated with a set of user-defined QoS parameters that specify how these queues are prioritized and what percentage of traffic they carry.
– Queue names are preceded by a “Q:” in the list.
- Site —Displays a list of sites available for viewing, as well as the entire weathermap. If you click on a site, the weathermap shows the nodes and intrasite circuits within the site.
- Layout —The manner in which plan files are laid out to visualize the network is called a layout. This option displays a list of available weathermap layouts. Example layouts might include schematic layouts, geographic layouts, or separate layouts for different continents.
The default layout is configurable by the administrator. Upon first opening WAE Live, this is the layout that you see. However, the last layout viewed before closing the browser is the one that appears the next time you open WAE Live provided you are using the same browser.
- Plot Options —Enables you to modify visual circuit attributes of the weathermap. See Set Plot Options.
- Full Screen —Enables you to view an enlarged weathermap without the control panel and without the health panels.
Figure 14-2 Weathermap Control Panel
Navigating to a Specific Weathermap
By default, the weathermap shows the most recent snapshot (plan file) taken. You can, however, navigate to plan files created at different times and on different days.
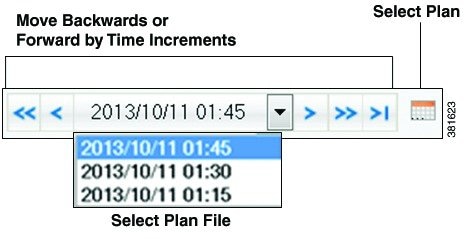
Plan File Navigation Options
- Single forward and back arrows (< >)—Move forward or backward by one increment in time.
- Double left arrow (<<)—View a plan file from yesterday.
- Double right arrow (>>)—View a plan file for the next day (assuming you are not on the current day).
- Single arrow with a bar ( >|)—View the most recent plan file.
- Drop-down list—Choose a different plan file based on its date and time.
- Calendar icon—Use the calendar to navigate to the desired month and date.
Set Plot Options
To modify the visual attributes of the circuits, click the Plot Options link. Options are retained for future sessions. To restore values to the system defaults, click the Reset to Defaults button.
The circuit width is based on its capacity (the higher the capacity, the wider the circuit). Using these options, you can set the minimum width and the capacity it represents, as well as how fast the width grows as the capacity grows.
 Feedback