- Overview
- Understanding Objects, Properties, and Data
- Viewing Graphs
- Working with Tables and Filters
- Exploring Network Data
- Viewing Inventory
- Configuring and Running Reports
- Running Traffic Reports
- Running Health Reports
- Running Deviation Reports
- Running Ad Hoc Reports
- Managing Reports
- Using the Report Log
- Viewing Network Health and Weathermaps
Cisco WAE Live 6.4.1 User Guide
Bias-Free Language
The documentation set for this product strives to use bias-free language. For the purposes of this documentation set, bias-free is defined as language that does not imply discrimination based on age, disability, gender, racial identity, ethnic identity, sexual orientation, socioeconomic status, and intersectionality. Exceptions may be present in the documentation due to language that is hardcoded in the user interfaces of the product software, language used based on RFP documentation, or language that is used by a referenced third-party product. Learn more about how Cisco is using Inclusive Language.
- Updated:
- January 19, 2016
Chapter: Running Traffic Reports
Running Traffic Reports
Access: WAE Live > Analytics, click New Report, and select Traffic Report Type
Access: WAE Live > Explore, select objects, and click Run Report
Traffic reports enable you to find trends for interface traffic, LSP traffic, and demands over a specified time range. These trends are based on time aggregations of the raw traffic data (for example, P95 traffic per week). The resulting report tables provide additional information, such as the number of aggregated objects on which the trending is computed. They also list the percentage at which the traffic is growing or shrinking.
Additional Traffic Report Options
Besides the required Object Type and Filter options, the traffic report presents you with the following additional configuration options:
–![]() Carry these historical trends into the future to determine at what date the traffic would be projected to surpass a given threshold.
Carry these historical trends into the future to determine at what date the traffic would be projected to surpass a given threshold.
–![]() Determine the state of traffic at a specific date.
Determine the state of traffic at a specific date.
- Group objects to trend aggregated (summed) traffic data. For information on the effects of grouping objects, see Configuring and Running Reports .
Grouping objects is useful for aggregating traffic that can then be imported into WAE Design for use in creating growth plans. For more information, see the Cisco WAE Design Integration and Development Guide.
To configure reports for a specific network, select it from the Network list (top left). If there is only one network configured, the word “default” appears.
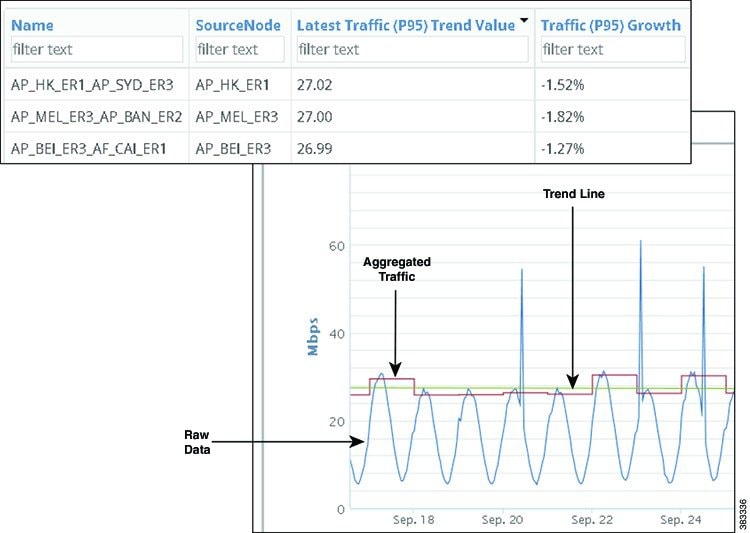
Example: This basic LSP traffic report shows the LSP traffic aggregated on a daily P95 basis. The trend values, growth, and trend line are all fairly even, and the traffic is spiking upwards with some regularity.
Projecting Traffic
Project Traffic to Cross Thresholds
One projection option is to project which objects will exceed a specified utilization in a specified future time range. Once the report is generated, you can graph the historical and projected trend on a per-object or per-group basis over any period of time. These graphs allow you to visualize the trends and underlying data. They can show a pattern of when thresholds are surpassed, and they can show threshold violations narrowed to a single event. For example, if you set 50% for 2 years using a maximum monthly trend, the resulting projected threshold tells you when aggregated monthly maximum traffic is expected to exceed 50% of the interface capacity over the next two years.
The resulting graphs display two lines: one showing the trend within the report time period and within the projected time period, and the other showing the threshold. For an example graph, see Figure 8-1.
Example: If you set 50% for 2 years using a maximum monthly trend, the resulting projected threshold tells you when aggregated monthly maximum traffic is expected to exceed 50% of the interface capacity over the next two years.
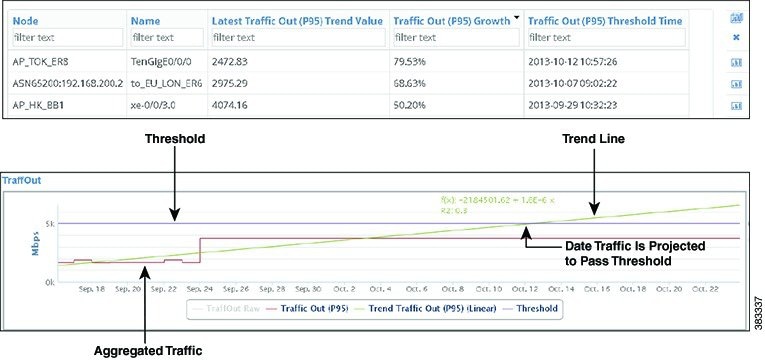
Example: Figure 8-1 shows an example traffic report generated to determine which interfaces will exceed 80% of their outbound traffic utilization in the next 5 weeks based on last month’s traffic trend. The trend is based on aggregating daily P95 Traffic Out. Sorting on Traffic Out (P95) Growth shows that the TenGigE0/0/0 interface on the AP_TOK_ER8 node has the highest percentage of traffic utilization growth.
Figure 8-1 Example Date Traffic is Projected to Pass Threshold
Projecting Traffic by Date
One projection option is to project the amount of traffic for a specified date. This is useful for planning purposes, such as determining when you might need to configure more LSPs or add more capacity.
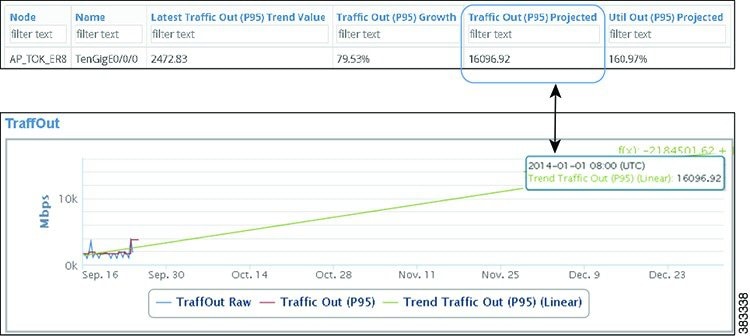
Example: Figure 8-2 shows an example report output when projecting traffic by date to January 1, 2014. The report shows that the projected traffic on January 1 will be 16,096.92 Mbps for the same interface shown in Figure 8-1.
Figure 8-2 Example Traffic Projection by Date
Example: Linear Trend Data Aggregation
If one plan file exists per day, and if the month has 28 days, then each interface in the datastore has 28 Traffic Out values for that month. If you run a traffic report on an interface and specify that you want to trend the weekly P95 of Traffic Out over this month, each week raw data would be aggregated into a single P95 value. So the first weekly value is an aggregation of seven P95 values. The remaining weekly values are an aggregation of the seven P95 values for their respective weeks. The result is a time-series aggregation with four data points on which the report is trended. These trends are viewable as graphs. For information on how raw data is collected, see Understanding Objects, Properties, and Data .
Traffic Report Tabs
Required Tabs
- For Objects, Filter, and Time Range, see Configuring and Running Reports .
- Trends —How to compute the trends. See Trend Fields.
Trend Fields
WAE Live first calculates the trend at which the property value is moving (its direction and frequency), and then uses this trend to determine the projected traffic. Set the following parameters to determine how this percentage is calculated.
- For interfaces, trend the traffic on Traffic Out, Traffic In, or both. For LSPs and demands, only Traffic is available, and it is preselected.
- Interval —The aggregation basis for the trend: P99, P98, P95, P90, P85, Maximum, Average, or Minimum.
- Per —The aggregation interval that is applied to the raw data before calculating the trend. This interval must be less than the report time range.
- Trending Algorithm —Algorithm used to compute the trend. Both the calculation and the graph differ, depending on which option you choose. Following is a list of how these graphs are commonly used.
–![]() Exponential —Commonly used when data values increase or decrease at a constantly increasing rate.
Exponential —Commonly used when data values increase or decrease at a constantly increasing rate.
–![]() Linear —Commonly used with linear data that often shows a steady rate of increase or decrease.
Linear —Commonly used with linear data that often shows a steady rate of increase or decrease.
–![]() Logarithmic —Commonly used when data changes by increasing or decreasing quickly and then stabilizing and leveling.
Logarithmic —Commonly used when data changes by increasing or decreasing quickly and then stabilizing and leveling.
–![]() Power —Commonly used with data measurements that increase at a specific rate.
Power —Commonly used with data measurements that increase at a specific rate.
Optional Tabs
- Group By —Aggregate the report results by groups. The Overall option aggregates the results for all objects. For more information, see Configuring and Running Reports .
In the output, you can expand the group to see its objects by clicking the number in the Count column.
Example: If you select interfaces as the object and group by nodes, the resulting report includes a row for each node. The data in that row is for all interfaces connected to that node. To see the names of interfaces on that node, click the number in the Count column.
–![]() Find <Object> Over ___ % or Mbps —Project the traffic trend into the future based on the computed trend. WAE Live determines and graphs when the trend will exceed this threshold. See Project Traffic to Cross Thresholds.
Find <Object> Over ___ % or Mbps —Project the traffic trend into the future based on the computed trend. WAE Live determines and graphs when the trend will exceed this threshold. See Project Traffic to Cross Thresholds.
–![]() To Date —Project the traffic amount on a specified date. See Projecting Traffic by Date.
To Date —Project the traffic amount on a specified date. See Projecting Traffic by Date.
 Feedback