- Overview
- Understanding Objects, Properties, and Data
- Viewing Graphs
- Working with Tables and Filters
- Exploring Network Data
- Viewing Inventory
- Configuring and Running Reports
- Running Traffic Reports
- Running Health Reports
- Running Deviation Reports
- Running Ad Hoc Reports
- Managing Reports
- Using the Report Log
- Viewing Network Health and Weathermaps
Cisco WAE Live 6.4.1 User Guide
Bias-Free Language
The documentation set for this product strives to use bias-free language. For the purposes of this documentation set, bias-free is defined as language that does not imply discrimination based on age, disability, gender, racial identity, ethnic identity, sexual orientation, socioeconomic status, and intersectionality. Exceptions may be present in the documentation due to language that is hardcoded in the user interfaces of the product software, language used based on RFP documentation, or language that is used by a referenced third-party product. Learn more about how Cisco is using Inclusive Language.
- Updated:
- January 19, 2016
Chapter: Exploring Network Data
Exploring Network Data
The Explore tool enables you to interactively navigate current network data and retrieve historical object performance data. For example, you can use Explore to do the following:
- Identify which LSPs are currently off their shortest TE paths.
- Determine which LSPs are currently going through a specific interface, or which IP address carries a specific interface and the historical changes on that interface.
- Determine whether IP address or metric changes have occurred on an interface during the last week.

Note![]() See also Viewing Graphs and Working with Tables and Filters.
See also Viewing Graphs and Working with Tables and Filters.
Navigating with Explore
The Explore page organizes network data in the following tabs:
- Interfaces —Enables you to filter and view network interfaces.
- Interface Queues —Enables you to filter and view network interface queues.
- Nodes —Enables you to filter and view network nodes or connection points.
- LSPs —Enables you to filter and view network label-switched paths.
- Demands —Enables you to filter and view network demands.
- Reports —Enables you to view summaries of the named reports over a period of time. Interactions with this report summary is the same as with the objects.
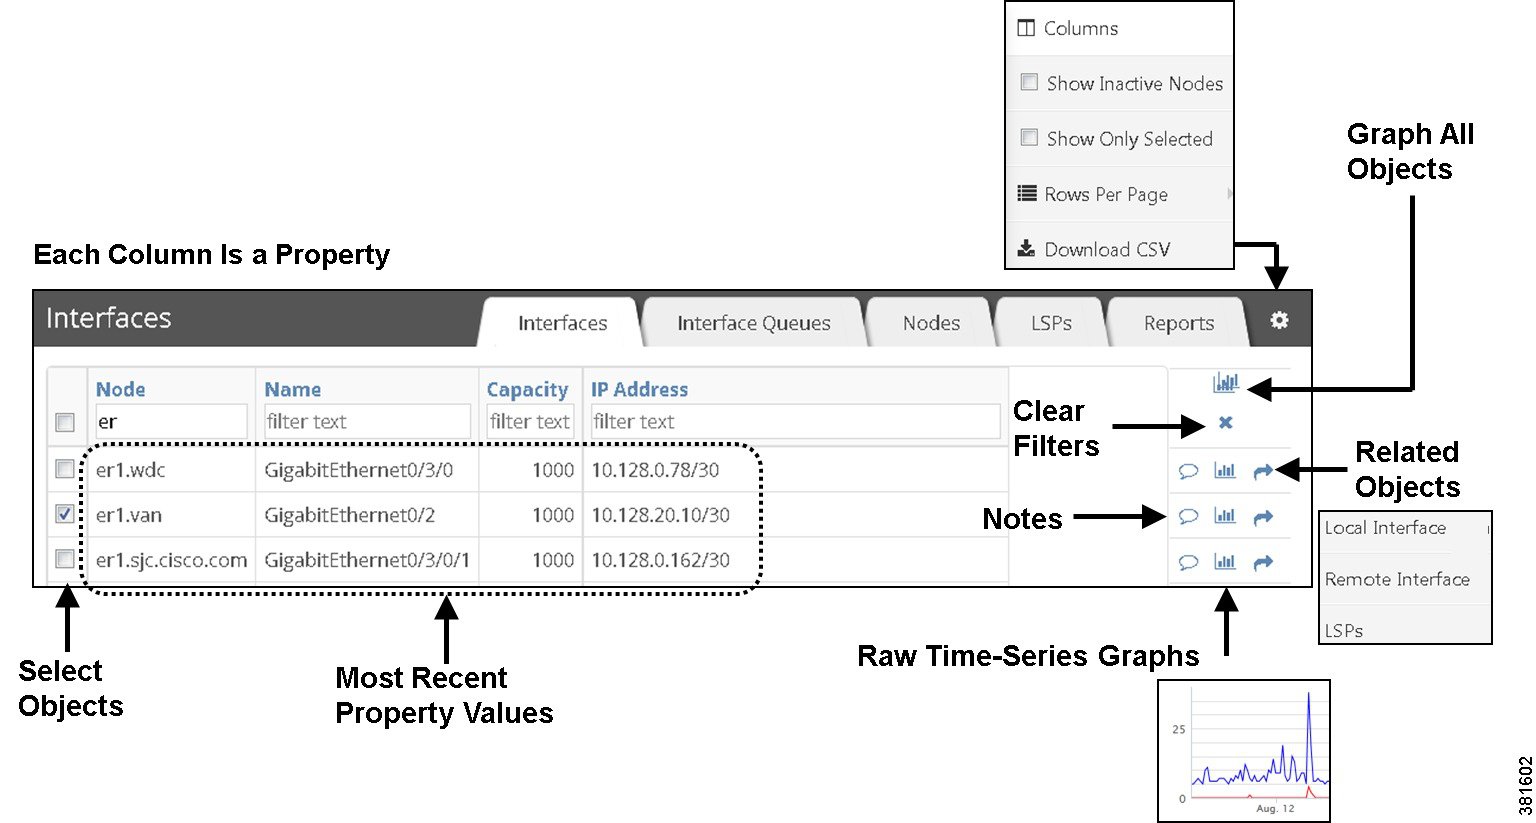
Each tab represents a table of objects that you can view and filter based on their current values, as well as to graph those values (raw data) over time and to navigate to related objects.
Figure 5-1 shows the Interfaces tab and its components.
Figure 5-1 Example Explore Interfaces Table
Working with Tables
In Explore, there are several common tasks that you can perform on table data. This includes the following:
- Selecting Objects to Include in Reports
- Clearing Filters
- Finding Related Objects
- Viewing More Data
- Viewing Graphs
- Adding Notes to Object Rows
Selecting Objects to Include in Reports
In Explore, you can select the objects that you want to include in reports. You can choose to select all objects (broad scope) or just a subset of the objects (narrow scope) on which to report. Each table includes the following check boxes:
- Per-row check boxes—Select the check box next to the desired object. This is a toggle that selects or deselects a single object.
When running reports, these selections are the default filters. For more information on report filters, see Configuring and Running Reports .
- Top check box—This is a toggle that selects or deselects all objects of the type you are viewing. For example, you can select all demands or all nodes.
If you have previously filtered to a subset of objects, this top check box applies only to them.
Clearing Filters
To clear all filters applied on particular objects, click the X button (Clear All Filters).
Finding Related Objects
In Explore, you can view objects in one table and then find their related (associated) objects in another table. This enables you to jump back and forth between objects. The related object pop-up menu options vary depending on the table you select and what objects are included in your network model. This can be particularly useful for viewing LSP node hops.
Table 5-1 describes the related objects and where to find them.
|
|
|
|
|---|---|---|
Step 1![]() Navigate to the table whose related object you want to find, for example, the LSPs table.
Navigate to the table whose related object you want to find, for example, the LSPs table.
Step 2![]() In the LSPs table, click the Related Objects (arrow).
In the LSPs table, click the Related Objects (arrow).
Step 3![]() In the Related Objects pop-up menu, select an object of interest, for example, Destination Node. The Explore page changes to list the related information.
In the Related Objects pop-up menu, select an object of interest, for example, Destination Node. The Explore page changes to list the related information.
Viewing More Data
Table cell information that is blue or cell data that has a small arrow by it can be expanded to show more data. You can view more data in:
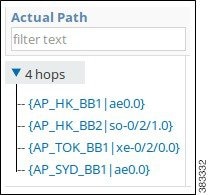
LSP Actual Path column—Click the right arrow of an actual path in an LSPs table to see an expanded list of its individual LSP hops. Click any hop to show it in the Nodes table. For an example, see Selecting LSP Hops and Related Nodes.
Viewing Graphs
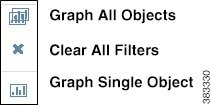
When viewing graphs, you have the following object options:
- Graph all Objects icon—Graph the data for all objects in the table.
- Graph Single Objects icon—Graph raw data of an object. From here, you can also list the raw data, which you can then save or send to others.
For more information on viewing graphs, see Viewing Graphs .
Adding Notes to Object Rows
You can add notes to the object rows in the Explore tables. All other users can read the notes and add further information to them. This enables multiple WAE Live users to share information that others might need to know, such as notes on interfaces that are reaching capacity or notes on when nodes are temporarily down for maintenance.
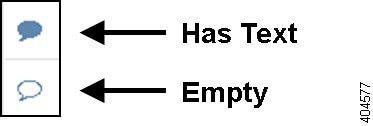
Notes that have information show as a solid blue to signal there is something to read.
To add a note, read a note, or add content to an existing note, click the Note icon.
Filtering on Interface Descriptions
The Interfaces and Interface Queues tabs enable you to filter text in the Description column on both interface and interface queue object types. This can be useful when your naming scheme for interfaces includes easy to filter patterns.
Step 1![]() Navigate to WAE Live > Explore and select the network (top left) on which you want to explore objects.
Navigate to WAE Live > Explore and select the network (top left) on which you want to explore objects.
If there is only one network configured, the word “default” appears in the top left side on the Analytics page.
Step 2![]() Select the Interfaces or Interface Queues tab.
Select the Interfaces or Interface Queues tab.
Step 3![]() In the Description text field, enter the text on which to filter the table rows.
In the Description text field, enter the text on which to filter the table rows.
You can use partial or full strings and regular expressions as descriptive text. For more information on filtering text, see Filtering Report Output.
After filtering the interface descriptions, you can create reports based on these filtered results on the interfaces or interface queues.
Exploring LSPs
You can explore related LSP objects from the LSPs table as well as drill down on LSP details and then create applicable reports.
Selecting LSP Hops and Related Nodes
From the LSPs tab, you can expand an actual LSP path in the LSPs table to see all of its individual hops in the Actual Path column, Clicking on any hop takes you to the Nodes table where you can see the source node or remote node associated with this LSP.
Step 2![]() In the Actual Path column, click the blue triangle to expand on the available hops.
In the Actual Path column, click the blue triangle to expand on the available hops.
Step 3![]() Click the Related Objects (arrow) and choose the Source Node or Remote Node that you want to explore for this hop.
Click the Related Objects (arrow) and choose the Source Node or Remote Node that you want to explore for this hop.
This takes you to the applicable source node or remote node for this LSP hop.
Drilling Down on LSP Details
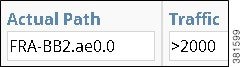
The next procedure assumes that you want to find the three LSPs with the highest setup bandwidth that are currently going through interface ae0.0 on node FRA-BB2 and that exceed 2,000Mbps (2 Gbps) of traffic. It then shows how to find the source node of the LSP with the highest setup bandwidth with these parameters.
Step 2![]() On the LSPs page, enter FRA-BB2.ae0.0 as the filter in the Actual Path column.
On the LSPs page, enter FRA-BB2.ae0.0 as the filter in the Actual Path column.
Step 3![]() In the Traffic column, enter > 2000 as the filter, and then press Enter.
In the Traffic column, enter > 2000 as the filter, and then press Enter.
Step 4![]() Click the Setup BW column heading to toggle the list in descending order.
Click the Setup BW column heading to toggle the list in descending order.
Step 5![]() Click the Related Objects (arrow) of the LSP with the highest setup bandwidth.
Click the Related Objects (arrow) of the LSP with the highest setup bandwidth.
Step 6![]() In the Related Objects pop-up menu, select Source Node.
In the Related Objects pop-up menu, select Source Node.
The resulting table is the source node of the LSP with the highest setup bandwidth that is currently going through interface ae0.0 on node FRA-BB2 and that exceeds 2 Gbps of traffic.
Viewing an LSP Hop Changes Report
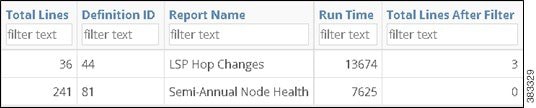
The next example report table indicates that in the last LSP Hop Changes report, only 3 out of 36 possible report entries were generated. For the Semi-Annual Node Health report, there were no lines in the report of possible 241 rows once filtering was applied.
Reports
The Reports Explore page provides a report summary on the total number of lines in a report and the number of lines when run against a user-specified filter. Explore records only named reports and the most recently run reports.
This high-level report trend can be an indicator of the network’s health. For example, if you run a node health report every week and filtered the percentage of time CPUs were over a given threshold, this table could show the number of nodes surpassing this threshold improving or worsening over time. If the number of nodes passing the threshold was increasing, it could be an indicator that the network is running hotter and you need to buy more nodes.
Gear Tool Options
The same set of gear tool options are available across all Explore pages with the exception of the Interface Type. To select any of the following Explore table options, click the gear tool.
Note![]() If you select specific interface types from the Explore Interfaces page for use in a report, then the report is only on those interfaces of those selected types. If you select Interfaces as the Object from a Configure Report page, then the report is run on all interfaces regardless of their type.
If you select specific interface types from the Explore Interfaces page for use in a report, then the report is only on those interfaces of those selected types. If you select Interfaces as the Object from a Configure Report page, then the report is run on all interfaces regardless of their type.
Run Report
Select the objects on which you want to run a report, and then click the Run Report button. The Configure Report page appears. For more information, see Configuring and Running Reports .
 Feedback