- Overview
- Understanding Objects, Properties, and Data
- Viewing Graphs
- Working with Tables and Filters
- Exploring Network Data
- Viewing Inventory
- Configuring and Running Reports
- Running Traffic Reports
- Running Health Reports
- Running Deviation Reports
- Running Ad Hoc Reports
- Managing Reports
- Using the Report Log
- Viewing Network Health and Weathermaps
Cisco WAE Live 6.4.1 User Guide
Bias-Free Language
The documentation set for this product strives to use bias-free language. For the purposes of this documentation set, bias-free is defined as language that does not imply discrimination based on age, disability, gender, racial identity, ethnic identity, sexual orientation, socioeconomic status, and intersectionality. Exceptions may be present in the documentation due to language that is hardcoded in the user interfaces of the product software, language used based on RFP documentation, or language that is used by a referenced third-party product. Learn more about how Cisco is using Inclusive Language.
- Updated:
- January 19, 2016
Chapter: Configuring and Running Reports
Configuring and Running Reports
This chapter describes the analytics report use cases, an example report creation workflow, and how to configure and run WAE Live Analytics reports.
Analytics Use Cases
The Analytics pages enable you to generate traffic, health, ad hoc, and deviation reports, as well as to visualize their results. These reports provide a series of options that enable you to customize the reports and answer the following questions:
- Which objects do you want to report on?
- What object properties do you want report on?
- What is the time frame for the report? Do you need to project a trend farther out from that time frame?
- Do you want to run a report on individual or grouped objects?
- Do you want to apply time aggregation operations, and if so, what are they (for example, maximum or average)?
Reports Workflow
There are several report configuration options that you can choose from when creating analytics reports for the first time. Configuration options vary depending on the report type (see Report Types, Object Types, and Configuration Options).
The next procedure outlines an example ad hoc report configuration process.
Step 1![]() Navigate to WAE Live > Analytics and select the network (top left) on which you want to create the report.
Navigate to WAE Live > Analytics and select the network (top left) on which you want to create the report.
If there is only one network configured, the word “default” appears in the top left side on the Analytics page.
Step 2![]() On the Analytics page, click New Report.
On the Analytics page, click New Report.
Step 3![]() In the Configure Report dialog box, select the report type, for example, Ad hoc, and the object type, for example, LSPs, from the drop-down menus.
In the Configure Report dialog box, select the report type, for example, Ad hoc, and the object type, for example, LSPs, from the drop-down menus.
The Summary page summarizes your selections so far and presents you with several additional tabs: Filter, Time Range, Group By, Time Interval, and Data Columns.
Step 4![]() Select the Filter tab and the filter type to use. By default, WAE Live assumes you want to select relevant objects in the Explore view.
Select the Filter tab and the filter type to use. By default, WAE Live assumes you want to select relevant objects in the Explore view.
To change the default filter, see Selecting a Filter Type.
Step 5![]() Select the Time Range tab and specify a time range for the report to run. By default, WAE Live selects the last one week of data when running the ad hoc report.
Select the Time Range tab and specify a time range for the report to run. By default, WAE Live selects the last one week of data when running the ad hoc report.
To change the default time range, see Defining Time Ranges.
Step 6![]() Select the Group By tab, and then select a group or aggregation option. By default, WAE Live selects the None radio button (no objects).
Select the Group By tab, and then select a group or aggregation option. By default, WAE Live selects the None radio button (no objects).
To change the grouping or aggregation options, see Grouping Objects and Grouping and Aggregating Objects for more information.
Step 7![]() Select the Time Interval tab and specify the time period over which attributes are aggregated, for example, 1 day. For more information, see Time Aggregation Options.
Select the Time Interval tab and specify the time period over which attributes are aggregated, for example, 1 day. For more information, see Time Aggregation Options.
Step 8![]() Select the Data Columns tab and select the property and time aggregation operation to apply time aggregation combinations. For more information, see Ad Hoc Report Tabs.
Select the Data Columns tab and select the property and time aggregation operation to apply time aggregation combinations. For more information, see Ad Hoc Report Tabs.
Step 9![]() To run the report just once, click Run. For more information, see Running the Report without a Name.
To run the report just once, click Run. For more information, see Running the Report without a Name.
Step 10![]() To save and run the report, click Save & Run. For more information see, Running the Report with a Saved Name.
To save and run the report, click Save & Run. For more information see, Running the Report with a Saved Name.
Step 11![]() Name the report. For more information, see Naming Reports.
Name the report. For more information, see Naming Reports.
After naming and saving a report, it becomes available from the Reports page.
Configuring Reports
You can configure reports on a per network basis to view network elements of interest and then group these elements to tailor a report for your particular use case.
To create an analytics report, you must configure the following report options:
- the type of report to run from the Report Type drop-down menu
- the type of object to report on from the Object drop-down menu
- the type of filter to use for filtering objects from the Filter tab
You can configure a report to be run just once (ad hoc basis), or you can save the report and run it again later on.
Report Types, Object Types, and Configuration Options
Table 7-1 describes the WAE Live report and object types that you can configure for report creation purposes. Besides the mandatory configuration options, some reports include additional report-specific configuration options.
Table 7-1 Report Types, Object Types, and Report-Specific Configuration Options
|
|
|
|
|
|---|---|---|---|
A custom report that can be run on any data column object type found in the Explore table. For more information on setting the group by and aggregate by options, see Grouping Objects, Grouping and Aggregating Objects, and Time Aggregation. For more information on setting ad hoc time intervals ad hoc report examples, see Running Ad Hoc Reports . |
|||
A report to determine the health of network objects and whether LAGs are imbalanced. For more information on setting thresholds and health report examples, see Running Health Reports . |
|||
A report to determine current and projected traffic trends. For more information on grouping, aggregate, and projection options, and traffic report examples, see Running Traffic Reports . |
|||
A report to determine sudden shifts in property values. For more information on setting parameters and example deviation reports, see Running Deviation Reports . |
Selecting a Filter Type
After deciding the type of report to create and the objects to report on, you must select a filter type to use when creating your analytics report.
The filter you select operates on a subset of objects. The complete list of objects and properties that you can filter on is described in Understanding Objects, Properties, and Data . There are two filter types to choose from when creating a report:
- Selected objects in the Explore View —this filter is selected by default. This filter is available from the Configure Report > Filter tab as well as from the various Explore tables. If there are no objects currently selected, the Filter page displays (0 Objects).
- Latest value of —this filter represents the latest value of an object. Each object type has different filter values depending on the object type selected. Filter values can include user-defined properties set up by the WAE Live administrator, if any.
You can specify the filter to use in creating a report from the drop-down list on the Filter tab, or you can base them on selections in the Explore tables.
Both filters enable you to have a broad scope report or a more narrow scope report depending on what data you are looking for in the report.

Note![]() If you select specific interface types from the Explore Interfaces page for use in a report, then WAE Live generates the report only on those interfaces of those selected types. If you select Interfaces as the Object from a Configure Report page, then the report is run on all interfaces regardless of their type.
If you select specific interface types from the Explore Interfaces page for use in a report, then WAE Live generates the report only on those interfaces of those selected types. If you select Interfaces as the Object from a Configure Report page, then the report is run on all interfaces regardless of their type.
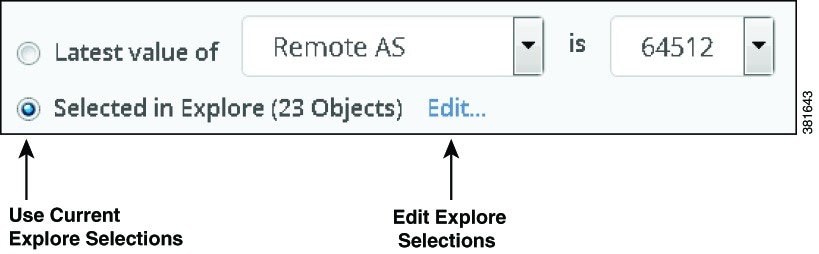
Selecting Objects in Explore
The next procedure assumes that you want to narrow your current report scope from the 23 selected LSPs objects in the Explore LSPs table to just three LSPs by selecting the Edit option in the Configure Report > Filter tab.
Step 1![]() Navigate to the Configure Report > Filter tab.
Navigate to the Configure Report > Filter tab.
Step 2![]() Click Edit, which takes you to the relevant Explore page.
Click Edit, which takes you to the relevant Explore page.
Step 3![]() In the LSPs table, select the three LSPs on which you want to report.
In the LSPs table, select the three LSPs on which you want to report.
For more information on selecting objects and navigating in Explore, see Exploring Network Data .
Selecting the Latest Value Filter
When you create reports from the Analytics > New Report > Configure Report > Filter tab, the default filter is Selected in Explore. You can change the default by selecting the Latest Value of radio button instead.
Note![]() The object type properties and value filters that you see in the drop-down menus vary depending on the object you select.
The object type properties and value filters that you see in the drop-down menus vary depending on the object you select.
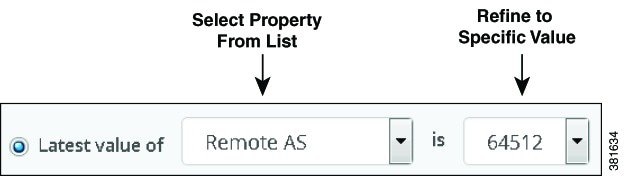
The next procedure shows how to use the Latest value of filter and to further refine a remote autonomous system (Remote AS) to a specific value for reporting purposes.
Step 1![]() In the Filter tab, select the object property to filter on from the drop-down box, for example, Remote AS.
In the Filter tab, select the object property to filter on from the drop-down box, for example, Remote AS.
Step 2![]() Refine the Latest value of list by selecting a specific value from the second list, for example, 64512.
Refine the Latest value of list by selecting a specific value from the second list, for example, 64512.
This enables you to run the report on all objects based on the selected property or on all objects matching the refined property value.
Defining Time Ranges
The Time Range tab defines the time frame for when WAE Live generates the report. You can select a time range using one of these methods:
- Creating a Time Range with the Last Button
- Creating a Custom Date Range
- Creating a Date Range with the Previous Time Window Button
Report time ranges use the time zone that you specify in your user profile.
Creating a Time Range with the Last Button
You can specify that reports use the time range radio button and the time selected from the Last pull-down menu. For example, you might create a deviation report with a time range that includes all the data collected within the last year.
Step 1![]() In the Configure Report window, select the Time Range tab.
In the Configure Report window, select the Time Range tab.
Step 2![]() Select the Last Radio button.
Select the Last Radio button.
Step 3![]() Enter an integer, for example, 1 and select year(s) from the pull-down menu. You can also choose: hour(s), day(s), week(s), and month(s).
Enter an integer, for example, 1 and select year(s) from the pull-down menu. You can also choose: hour(s), day(s), week(s), and month(s).
Creating a Custom Date Range
You can specify a custom date range for when WAE Live runs reports. You can enter the range manually in yyyy-mm-dd hh:mm:ss format, or you can select dates from the calendar pickers.
Step 1![]() In the Configure Report window, select the Time Range tab.
In the Configure Report window, select the Time Range tab.
Step 2![]() Select the Custom Dates radio button.
Select the Custom Dates radio button.
Step 3![]() In the From field, enter the from date for the time range.
In the From field, enter the from date for the time range.
Step 4![]() In the To field, enter the to date for the time range.
In the To field, enter the to date for the time range.
Creating a Date Range with the Previous Time Window Button
You can configure reports with a floating window (Previous Time Window). This option reports data based on the time frame when the report was run (the last full window), for example, 7:00 a.m.–7:00 p.m., instead of the time when the report was defined, for example, 6:00 p.m.
The time range for the floating window uses the 24-hour clock and can be defined between 00:00:00 and 23:59:59. You can enter the time range in hh:mm:ss format manually (00:00:00), or by selecting the appropriate times from the time pickers.
The time range can transition through two days, for example, you can specify the time window to be: From : 22:00:00 (10:00 p.m.) and To : 10:00:00 (10:00 a.m.).
The next procedure shows how to a create report that defines a time window to include data collected from 7:00 a.m. to 7:00 p.m.
Step 1![]() In the Configure Report window, select the Time Range tab.
In the Configure Report window, select the Time Range tab.
Step 2![]() Select the Previous Time Window radio button.
Select the Previous Time Window radio button.
Step 3![]() In the From field, enter the from time, for example, 07:00:00 (7:00 a.m.).
In the From field, enter the from time, for example, 07:00:00 (7:00 a.m.).
Step 4![]() In the To field, enter the to time, for example,19:00:00 (7:00 p.m.).
In the To field, enter the to time, for example,19:00:00 (7:00 p.m.).
Ad Hoc and Traffic Report Specific Options
The ad hoc and traffic reports support the following additional configuration options:
Grouping Objects
The traffic and ad hoc reports support the ability to group (or aggregate) a set of objects and sum their property values. In the resulting report table, each row represents a group of objects. The columns represent the aggregated values for each group.
The next procedure shows how to create a traffic report that operates on LSPs and is grouped by source nodes and remote nodes.
Step 1![]() In the Configure Report window, select the Group By tab.
In the Configure Report window, select the Group By tab.
Step 2![]() Click the Select radio button and select Source Node from the pull-down menu.
Click the Select radio button and select Source Node from the pull-down menu.

Step 3![]() Click the plus button (+) and select Remote Node from the drop-down menu.
Click the plus button (+) and select Remote Node from the drop-down menu.
Group By Options
Table 7-3 describes the Group By tab options and how they affect the report generation process.
Grouping Examples
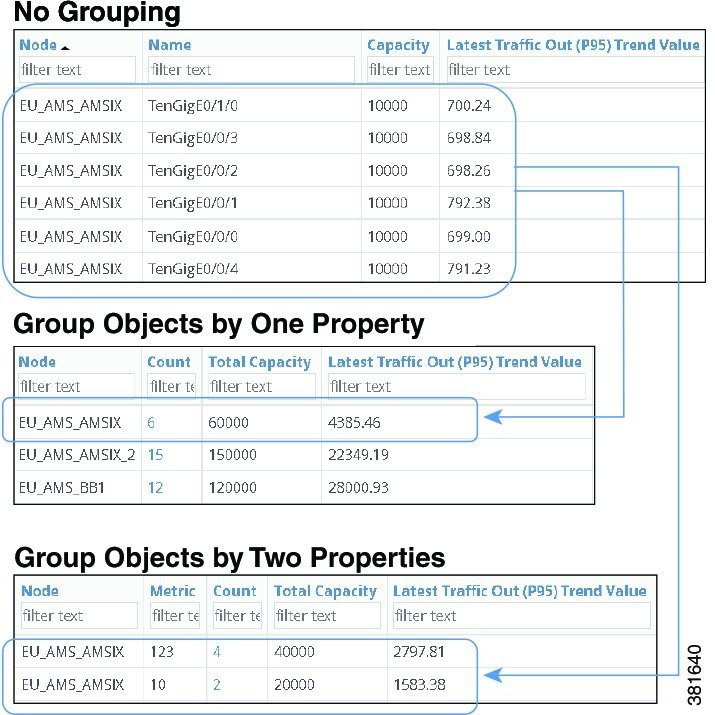
Figure 7-1 shows a report generated three times:
- one without grouping objects (No Grouping)
- one with objects grouped by nodes (Group Objects by One Property)
- one grouping first by nodes and then by metric (Group Objects by Two Properties)
Notice that both the Capacity and the Latest Traffic Out (P95) columns adjust according to whether and how the objects are grouped.
Figure 7-1 Example Effects of Grouping Objects
Grouping and Aggregating Objects
Grouping is the process of choosing what objects to sum together as a group, for example, all interfaces with a specific capacity. Aggregation is a function where multiple values of different objects are grouped together to form a single value, for example, “maximum” or “average.” Note that “average” represents an additional grouping.
Aggregation Options
Table 7-2 details the aggregation options and their meanings.
Figure 7-2 Aggregation Option Values and Their Meanings
Time Aggregation
The traffic and ad hoc reports support time aggregation features that aggregate multiple property values into a single value for a given time range. For example, you can aggregate maximum raw data values for traffic on a weekly basis.
Time aggregation operations are applied to raw data. For a description of raw data, see Understanding Objects, Properties, and Data . For more information and examples of aggregating data in the reports, see Running Traffic Reports and Running Ad Hoc Reports .
Running Reports
You can run new reports or existing reports from any of the locations listed in the next sections.
Running New Reports
Running Existing Reports
There are two ways to run existing reports (with existing or changed parameters):
- From the Analytics > Reports page, click View > Run, which runs immediately with the same parameters. To keep or change the parameters, click View > Run or click the name in the Report Name cell.
- From the Analytics > Report Log page, to keep or change the parameters, click View > Edit or click the name in the Report Name cell.
Note![]() If you need to email the report, you must give the report a unique name when you run it (see Naming Reports).
If you need to email the report, you must give the report a unique name when you run it (see Naming Reports).
Naming Reports
You can run reports with a saved name or without a name. Additionally, you can change the name of an existing report.
Running the Report with a Saved Name
To run the report with a saved name, click the Save & Run button after configuring the report. By giving the report a name, you automatically add it to the Analytics Reports page where you can easily identify and schedule it for future use.
Running the Report without a Name
To run the report without giving it a name, click the Run button after configuring the report. If you do not save the report with a name, it is given a default name with the format Report Type-Object Type-Definition ID. Reports that use a default name appear only on the Analytics Report Log page.
Changing the Name of an Existing Report
To change the name of an existing report, there are two options:
Applying Filters and Sorting Named Reports
You can apply filters and sorting to a named report so that it displays according to these filters and sorting each time you open or run the report. Thereafter, you can schedule email alerts to be sent when these conditions are met using the Managing Reports page.
These saved report parameters do not affect the generation of the report. Rather they affect what is displayed in the output (based on the filters that were applied), how the information is displayed (based on how the columns were sorted), and if scheduled appropriately, whether the report is sent via email.
Step 1![]() Run and name the report. See Naming Reports.
Run and name the report. See Naming Reports.
Step 2![]() On the report output page, apply filters and/or sorting.
On the report output page, apply filters and/or sorting.
- Enter a value in one or more Filter Text cells at the top of a table column, and press Enter. See Working with Tables and Filters for more details on acceptable filter text options.
- To sort the results of a property in a specific order, click its column heading one or two times.
Step 3![]() Save the filters and sorting by clicking the Save icon.
Save the filters and sorting by clicking the Save icon.
Report Output
The output of all reports is available in a table format that can be exported, and most reports enable you to graph the resulting data. For information on how to use tables and graphs, see Working with Tables and Filters and Viewing Graphs .
You can view reports from two primary locations, both accessed from Analytics. For more information, see:
- Using the Report Log —The Report Log page provides a list of previous reports that you can view or run again.
- Managing Reports —The Analytics Reports page provides a list of uniquely named reports that you can schedule and email.
Gear Tool Options
From a report’s output page, click the gear tool to select any of the following options:
- Edit —Open the Configure Report page to run or configure the report again.
- Save As —Name or change the name of the report.
- Columns —Click to select which report columns show in the output. If a column check box is gray, then you cannot turn it off. These non-optional properties always appear in the left-most columns of the output.
- Download CSV —Export the table in a tab-delimited format.
- Permalink —Save the report’s URL.
- Rows per page —Select the number of objects per page to show in the table.
 Feedback