Monitor CPU Utilization Using Telemetry Data to Plan Network Infrastructure
The use case illustrates how, with the dial-out mode, you can use telemetry data to proactively monitor CPU utilization. Monitoring CPU utilization ensures efficient storage capabilities in your network. This use case describes the tools used in the open-sourced collection stack to store and analyse telemetry data.
 Note |
Watch this video to see how you configure model-driven telemetry to take advantage of data models, open source collectors, encodings and integrate into monitoring tools. |
-
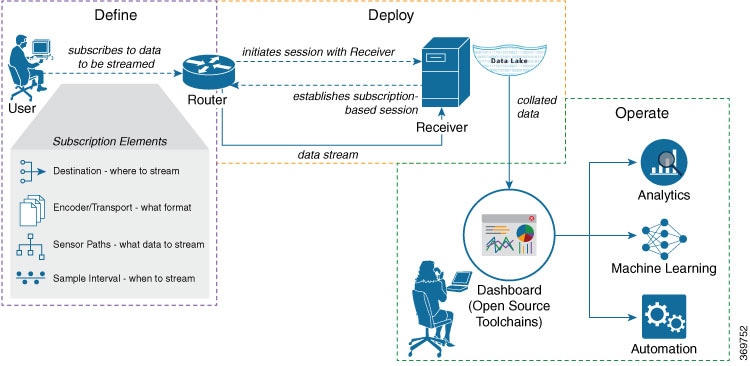
Define: You define a subscription to stream data from the router to the receiver. To define a subscription, you create a destination-group and a sensor-group.
-
Deploy: The router establishes a subscription-based telemetry session and streams data to the receiver. You verify subscription deployment on the router.
-
Operate: You consume and analyse telemetry data using open-source tools, and take necessary actions based on the analysis.
Before you begin
Define a Subscription to Stream Data from Router to Receiver
Procedure
|
Step 1 |
Create one or more destinations to collect telemetry data from a router. Define a destination-group to contain the details about the destinations. Include the destination address (ipv4 or ipv6), or FQDN, port, transport, and encoding format in the destination-group. Example:Create a destination-group using data model This example uses the native data model Create a destination group using CLI
|
||
|
Step 2 |
Specify the subset of the data that you want to stream from the router using sensor paths. The sensor path represents the path in the hierarchy of a YANG data model. Create a sensor-group to contain the sensor paths. Example:
|
||
|
Step 3 |
Subscribe to telemetry data that is streamed from a router. A subscription binds the destination-group with the sensor-group and sets the streaming method. The streaming method can be cadence-driven or event-driven telemetry. Example:
Create a subscription using data model Create a subscription using CLI
|
Verify Deployment of the Subscription
The router dials out to the receiver to establish a session with each destination in the subscription. After the session is established, the router streams data to the receiver to create a data lake.
You can verify the deployment of the subscription on the router.
Procedure
|
Step 1 |
View the model-driven telemetry configuration on the router. Example: |
|
Step 2 |
Verify the state of the subscription. An Example:The router streams data to the receiver using the subscription-based telemetry session and creates a data lake in the receiver. |
Operate on Telemetry Data for In-depth Analysis of the Network
-
Pipeline is a lightweight tool used to collect data. You can download Network Telemetry Pipeline from Github. You define how you want the collector to interact with routers and where you want to send the processed data using
pipeline.conffile. -
Telegraph (plugin-driven server agent) and InfluxDB (a time series database (TSDB)) stores telemetry data, which is retrieved by visualization tools. You can download InfluxDB from Github. You define what data you want to include into your TSDB using the
metrics.jsonfile. -
Grafana is a visualization tool that displays graphs and counters for data streamed from the router.
In summary, Pipeline accepts TCP and gRPC telemetry streams, converts data and pushes data to the InfluxDB database. Grafana uses the data from InfluxDB database to build dashboards and graphs. Pipeline and InfluxDB may run on the same server or on different servers.
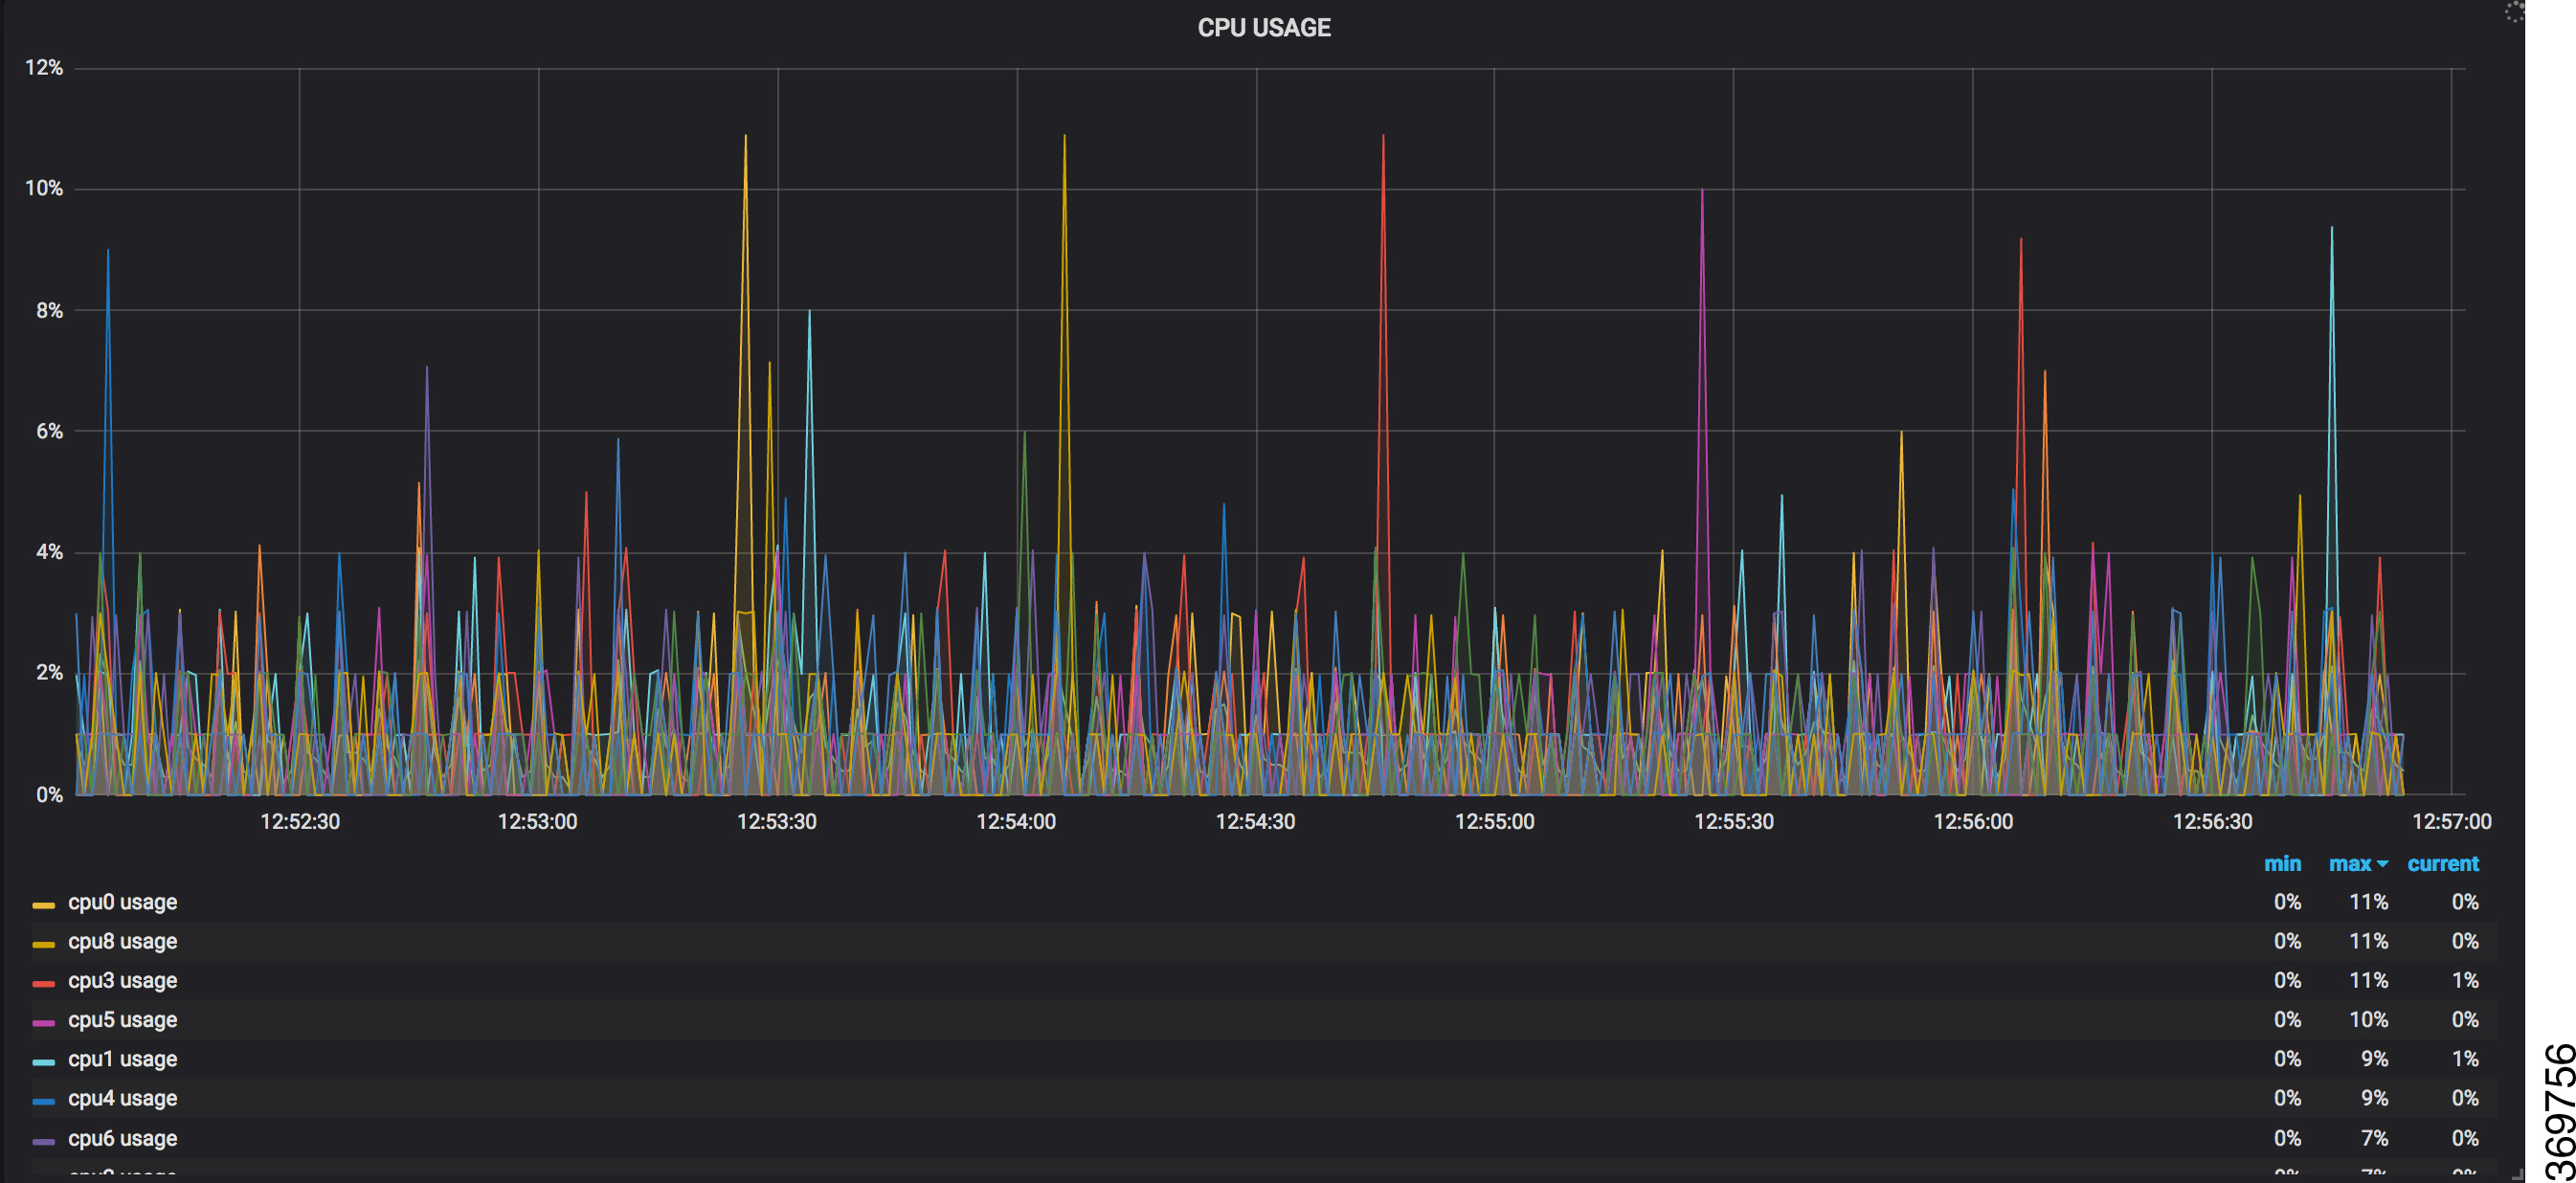
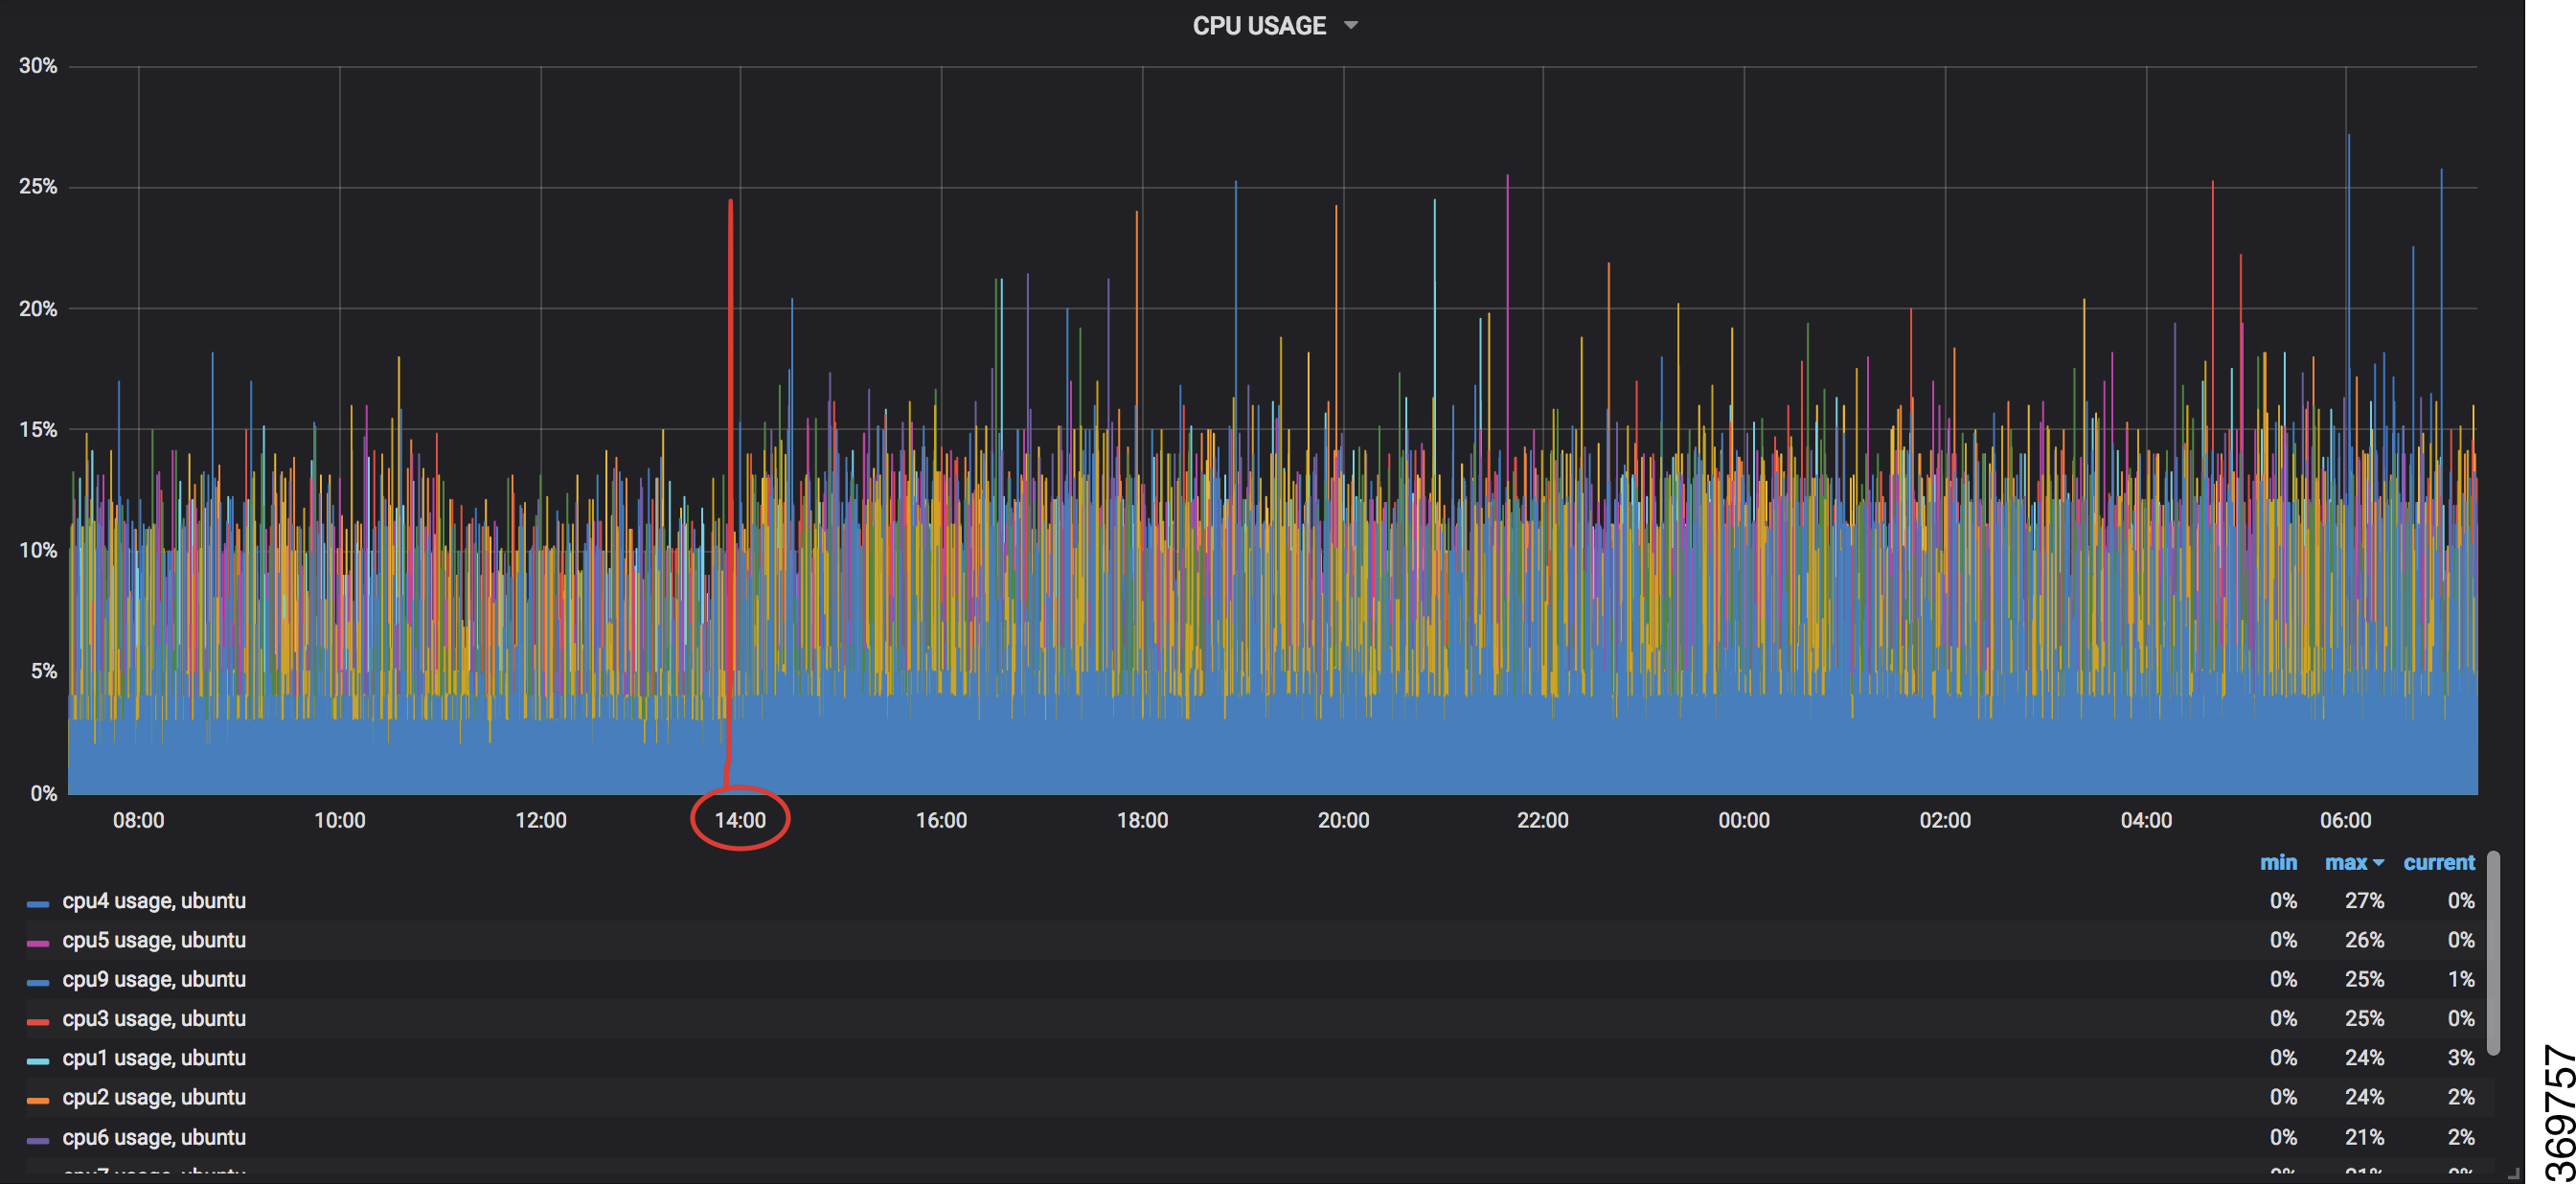
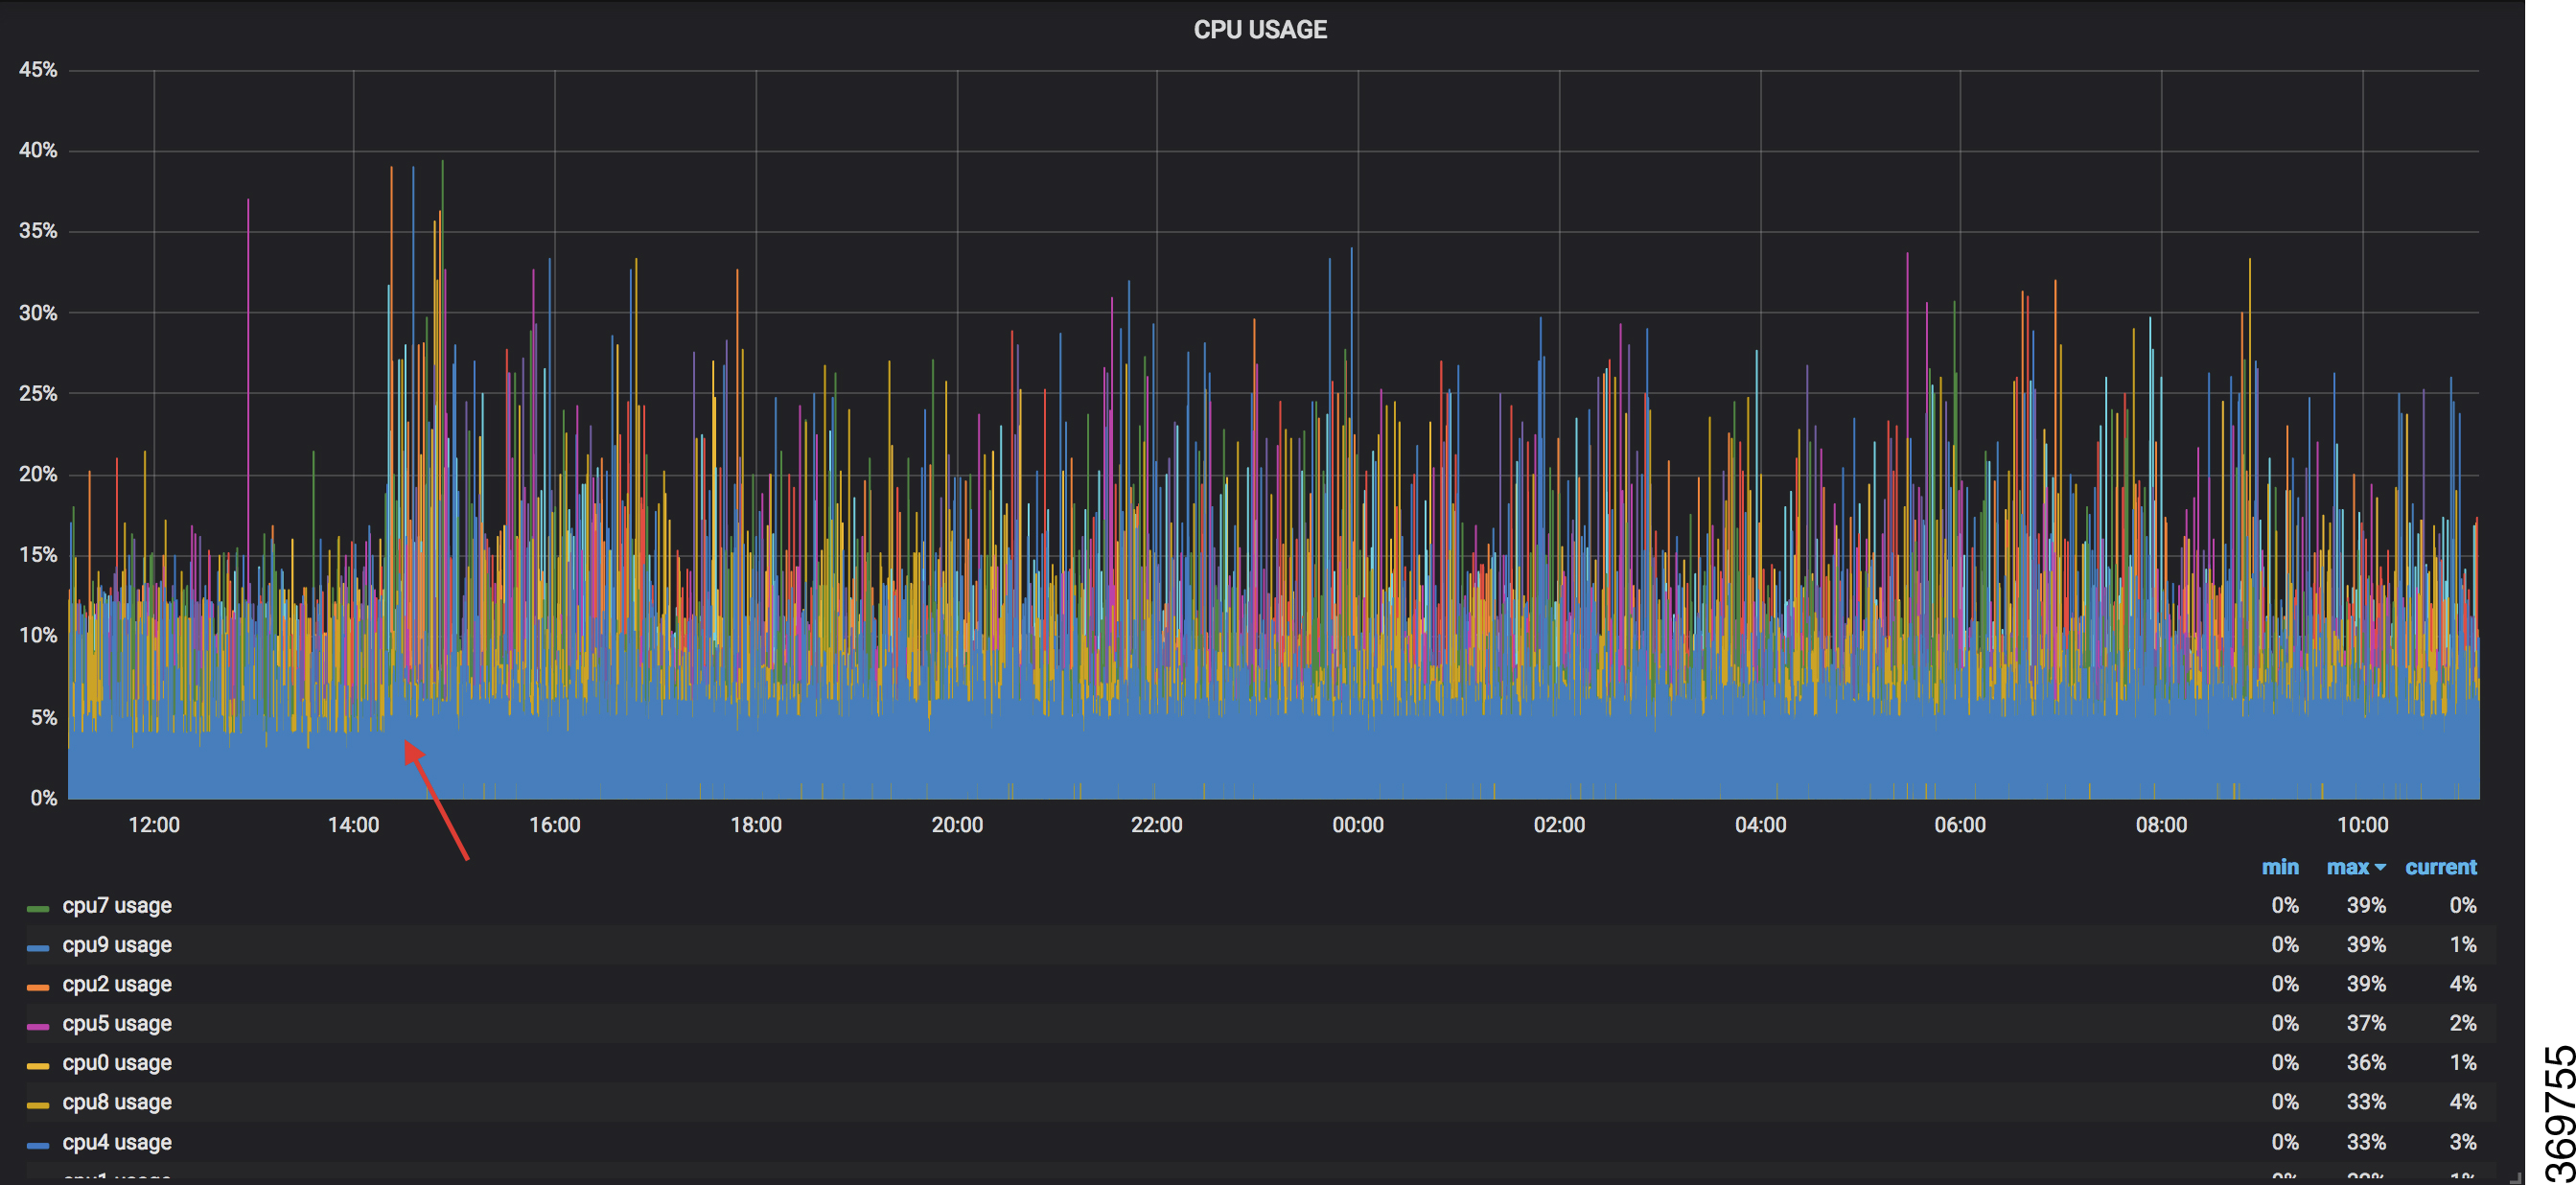
Consider that the router is streaming data of approximately 350 counters every 5 seconds, and Telegraf requests information from the Pipeline at 1 second intervals. The CPU usage is analysed in three stages using:
-
a single router to get initial values
-
two routers to find the difference in values and understand the pattern
-
five routers to arrive at a proof-based conclusion
Procedure
|
Step 1 |
Start Pipeline, and enter your router credentials.
Example: |
||
|
Step 2 |
In the Telegraph configuration file, add the following values to read the metrics about CPU usage. Example: |
||
|
Step 3 |
Use Grafana to create a dashboard and visualize data about CPU usage. One router The router pushes the counters every five seconds. All CPU cores are loaded equally, and there are spikes up to approximately 10 or 11 percent.  Two routers The second router is added at  Five routers With five routers, the spikes peak upto approximtely 40 percent with midpoint in the range of 22 to 25 percent.  |


 Feedback