Visualizing the Topology

Visualization Overview

The visualization phase allows you to see how the nodes interact in terms of routing protocol connectivity, autonomous system (AS) numbers, Open Shortest Path First (OSPF) area, and so on. Before entering the visualization phase, you must have designed the topology and built the node configurations.

Note


Visualization is only available where node configurations are generated using parameters defined in AutoNetkit.


The AutoNetkit visualization runs in a browser window, either within the Cisco Modeling Labs client or in a separate browser window. Ensure that you use a compatible browser, as described in the Cisco Modeling Labs Installation Guides for the version of Cisco Modeling Labs that you are using.
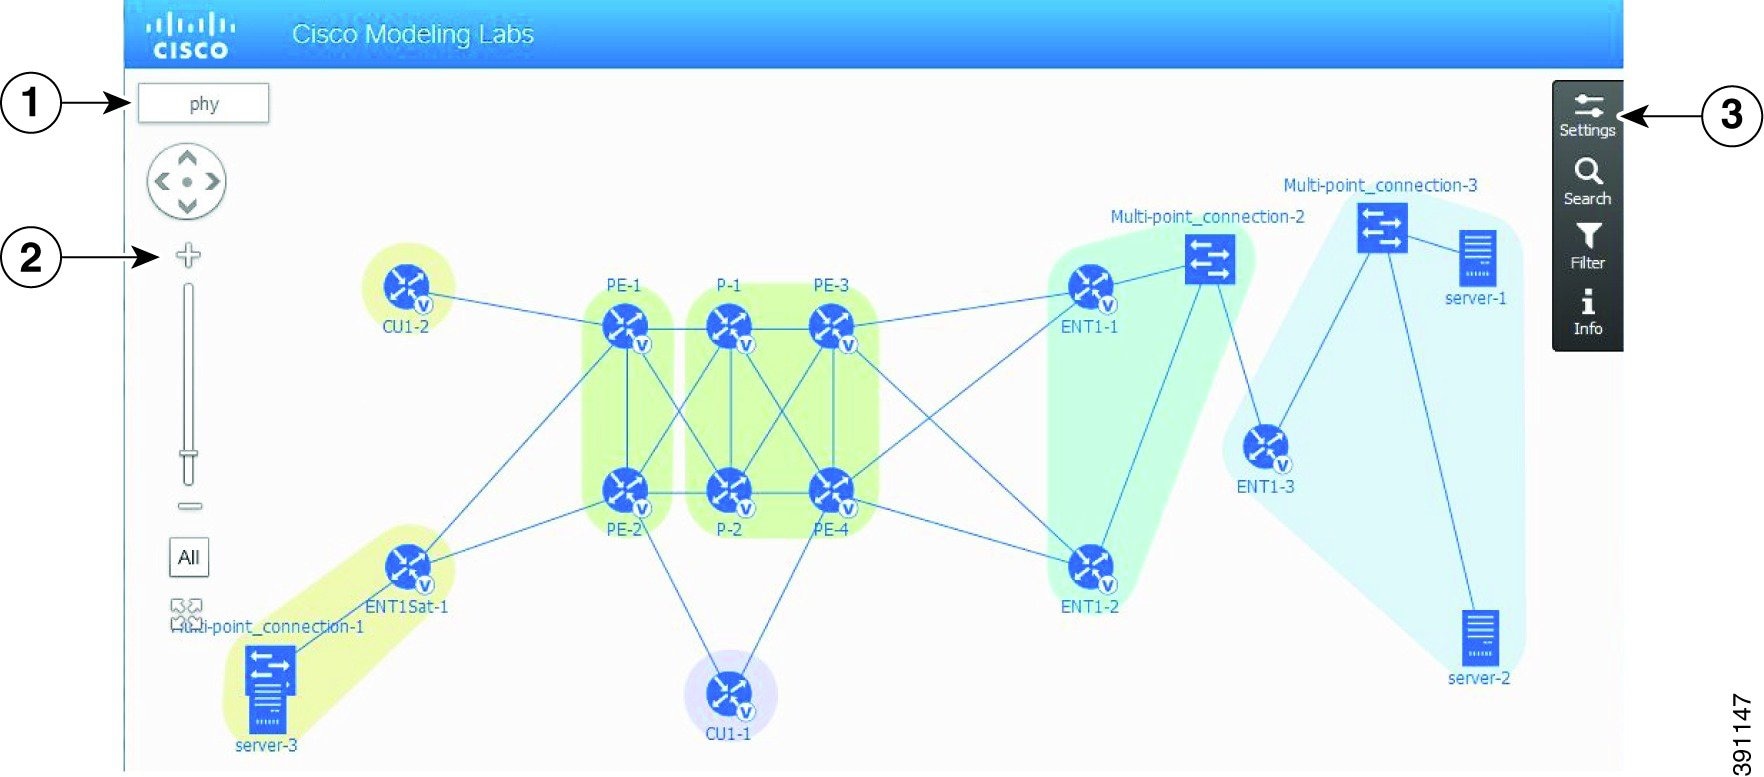
The following figure shows an overview of the visualization phase as it appears in a browser window.
Figure 1. Visualization Overview


Table 1 Visualization Overview
Identifier Description
1 Layers view selection. The layers shown correspond to the values selected when generating the configuration. For example, if IGP is chosen as OSPF, an OSPF layer will be shown. If MPLS is not used in the configuration, no MPLS layer will be shown.
2 Pan and zoom controls. Use the controls to pan the topology, zoom in and out on the topology, adjust the display so that all the nodes are shown, and switch to a full-screen view.
3 Settings, search, and filter controls. Use the settings control to change the appearance of the display. Use the search and filter controls to highlight specific nodes and connections.
The following figure shows how the visualization compares to the topology design.
Figure 2. Topology Design


During the visualization phase, you perform the tasks described in the following sections.

Enabling AutoNetkit Visualization (for Windows Users)

To enable visualization for the Cisco Modeling Labs client on Windows, complete the tasks described in this section.
Before You Begin
  • Ensure that you have access to the Cisco Modeling Labs client.

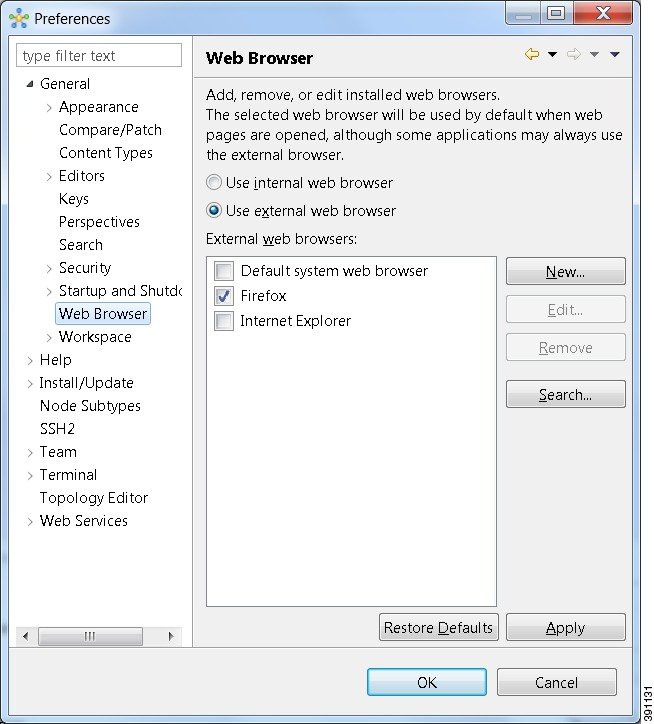
    Step 1   From the Cisco Modeling Labs client toolbar, choose File > Preferences > General > Web Browser.

    The Web Browser Preferences dialog box appears.

    Figure 3. Web Browser Preferences


    Step 2   Click the Use external web browser radio button.

    Note    On Windows, only Mozilla Firefox, Google Chrome, or Apple Safari are supported as default web browsers. Internet Explorer is not supported for AutoNetkit Visualization.
    Step 3   In the External web browsers pane, check the Firefox check box.
    Step 4   Click Apply and OK.
    Step 5   Choose Preferences > Web Services > AutoNetkit Visualization.
    Step 6   Under Open AutoNetkit Visualization, select the Always option.
    Step 7   Click Apply and OK. If the Firefox executable cannot be found, you will need to edit the path to find it (firefox.exe).
    1. To do this, in the External web browsers pane (Step 3), select Firefox and click Edit.
    2. Click Browse to navigate to the corresponding location and choose the Firefox executable.
    3. Click OK to save the changes.

    Opening AutoNetkit Visualization

    Before You Begin

    Complete the task of building nodes and interfaces.


      Step 1   Generate a configuration for the topology.

      Click Update Router Configurations from the toolbar. Alternatively, from the menu bar, choose Run > Update Router Configurations.

      Step 2   View the configuration changes.
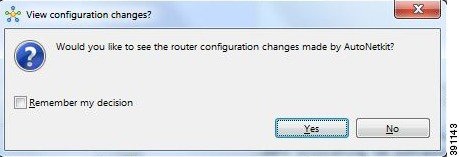
      AutoNetkit displays a notification after it generates the configuration.
      Figure 4. View Configuration Change Notification


      • Click No to skip this step.
      • Click Yes to open a comparison view of the configuration changes.
      Step 3   Display the AutoNetkit Visualization view of the topology. When you close the comparison view, a notification prompts you whether or not to open the AutoNetkit Visualization.
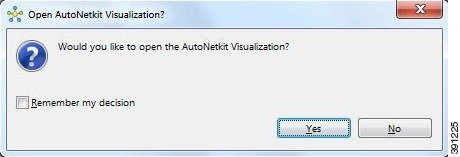
      Figure 5. Open AutoNetkit Visualization


      • Click No to skip this step.
      • Click Yes to display the visualization.

        The AutoNetkit Visualization opens in a browser window.

      Note    Choose File > Preferences > Web Services > AutoNetkit Visualization to control the prompts for visualization.

      Figure 6. AutoNetkit Visualization Window


      What to Do Next

      Explore the features in AutoNetkit Visualization.

      Using Layers


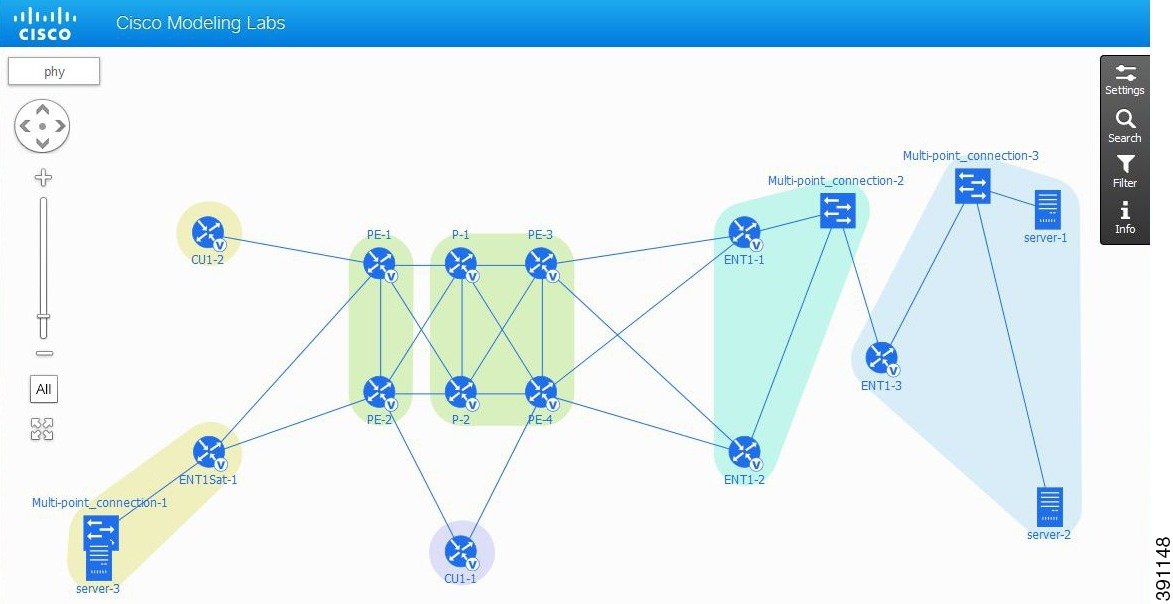
        Step 1   Verify if visualization is open in a browser window. The initial layer that is displayed in the browser window is the physical model of the topology, as shown in the following figure. The physical model shows the nodes and interface connections between the nodes. It is similar to the Cisco Modeling Labs topology view.
        Figure 7. Physical Layer View


        Note    The options change depending on the router protocols configured. For example, if IPv6 is configured, you will also see ebgp_v6

        Step 2   To select another view, place the cursor over the Layers view selection in the browser window. See Visualization Overview for information on the Layers view selection. When you place the cursor over the layers view, several choices appear. For example, selecting ebgp_v4 will show the IPv4 eBGP topology. This is constructed based on the AS property and node connections created in the Topology Editor, as shown in the following figure.
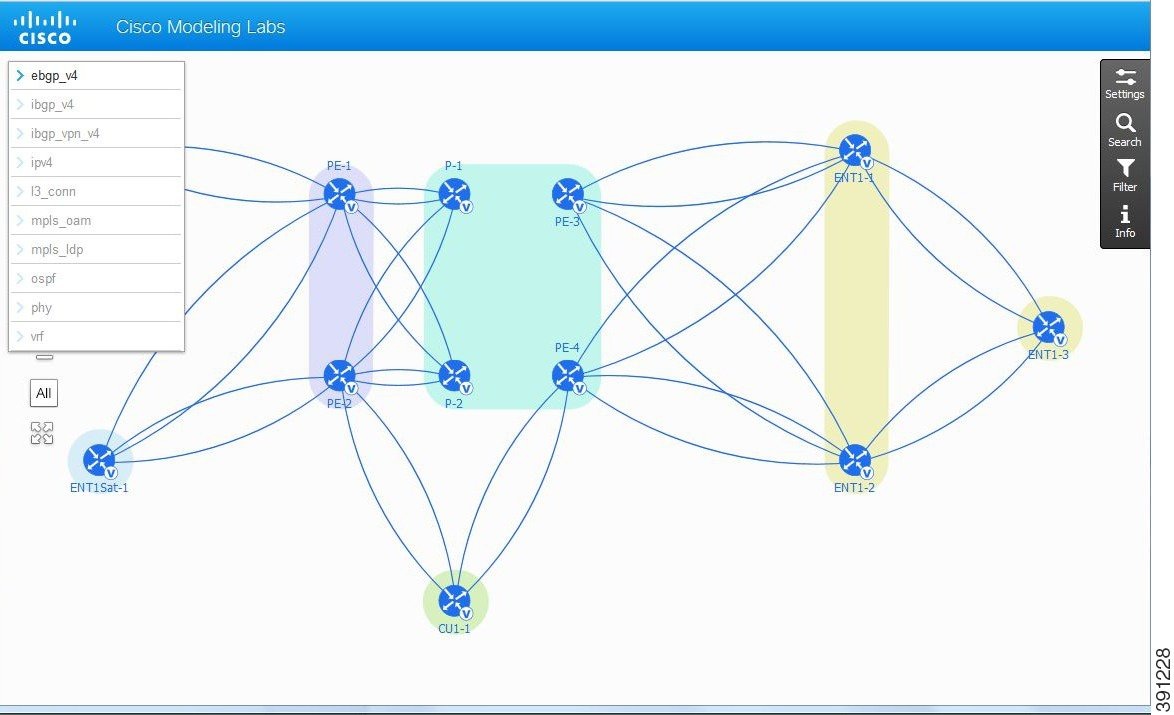
        Figure 8. ebgp_v4 Layers View


        Step 3   Place the cursor over one of the nodes. This action displays a pop-up view of information about that node. The type of information displayed depends on the selected layer and node configuration.
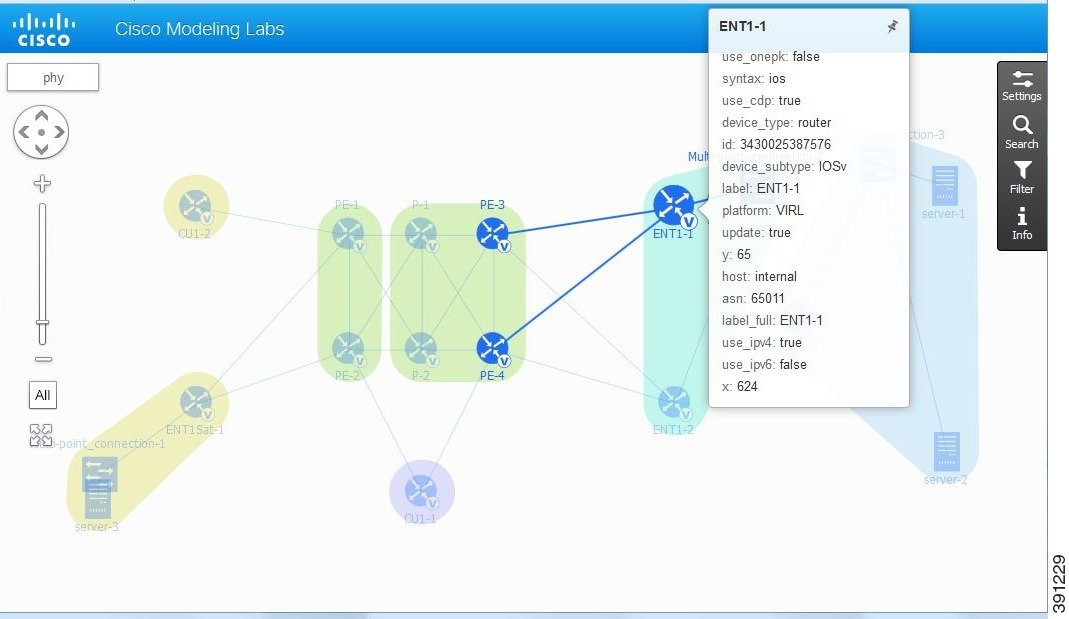
        Note    You can also hover over the connections to see connection details.

        Figure 9. Node Pop-Up Information


        Step 4   Continue selecting layer views and observe how the protocol-centric view changes. In a complex topology, you can use the Layers views to verify that the protocols, nodes, and connections meet the design requirements.

        What to Do Next

        • (Optional) Change settings, use the Search feature, or use the Filter feature.
        • (Optional) Return to the design and build phases to modify the topology and generate new configurations and AutoNetkit Visualizations.
        • (Optional) Run the topology simulation when you are satisfied with your configuration.

        Changing the Settings


          Step 1   In the AutoNetkit Visualization browser window, click Settings. The Settings window opens, as shown in the following figure.
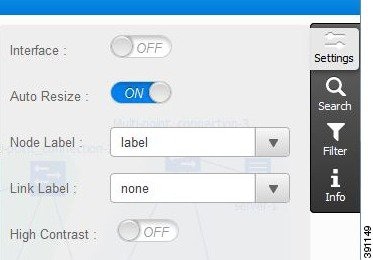
          Figure 10. AutoNetkit Visualization Settings Window


          The following table lists the main settings.
          Table 2 Main Settings
          Setting Description
          Interface Select ON to display the interface connection points. The default value is OFF.
          Auto Resize Select OFF to not resize the visualization automatically. The default value is ON.
          Node Label Select a value from the drop-down list. The default value is label, which is the node name. This node name is configured in Cisco Modeling Labs for each node.
          Link Label Select a value from the drop-down list. The default value is none.
          High Contrast Select ON to change the visualization display to a high-contract color scheme. The default value is OFF.
          Step 2   Observe the changes in the display when you select different settings.
          Step 3   To close the Settings view, click the Settings tab.

          What to Do Next

          • (Optional) Change settings, use the Search feature, or use the Filter feature.
          • (Optional) Return to the design and build phases to modify the topology and generate new configurations and AutoNetkit Visualizations.
          • (Optional) Run the topology simulation.

          Using Search


            Step 1   In the AutoNetkit Visualization browser window, click Search. The Search window opens.
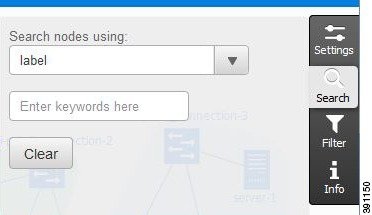
            Figure 11. AutoNetkit Visualization Search Window


            The Search window contains the main options that are listed in the following table.
            Table 3 Search Window Main Options
            Option Description
            Search nodes using Selects a search attribute from the drop-down list. The default value is label.
            Enter keywords here Identifies keywords based on the attribute selected in the Search nodes using drop-down list. Keywords are case-sensitive.

            Wildcard selections are not supported. For example, searching asn with the keyword 65* does not modify the display, even if ASN values of 65000 and 65001 exist in the topology configuration. Partial matches are not supported for numeric node values.

            Partial matches are supported in alphanumeric fields. For example, selecting label and entering the keyword P matches all the node labels that begin with a capital P or have a capital P anywhere in the label.

            Clear Clears the keywords.
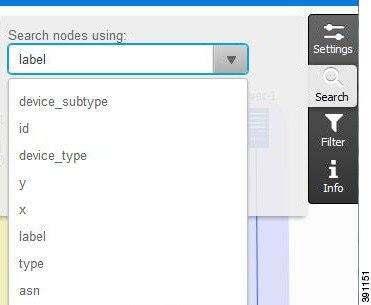
            The following figure shows the values you can select from the Search nodes using drop-down list.
            Figure 12. Search Window Drop-Down List


            Step 2   Observe the visualization and how the different items are highlighted when they match the combination of Search nodes using and keywords that you enter.
            Step 3   To close the Search window, click the Search tab.

            What to Do Next

            • (Optional) Change settings, use the Search feature, or use the Filter feature.
            • (Optional) Return to the design and build phases to modify the topology and generate new configurations and AutoNetkit Visualizations.
            • (Optional) Run the topology simulation.

            Using Filters


              Step 1   In the AutoNetkit Visualization browser window, click Filter. The Search window opens.
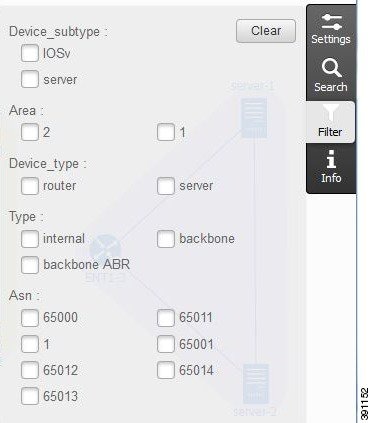
              Figure 13. AutoNetkit Visualization Filter Window


              The Filter window contains the main options that are listed in the following table.
              Table 4 Filter Window Main Options
              Option Description
              Clear Clears all the checked selections.
              Selections The selections that are available for filtering depend on the topology configuration. Values that do not exist in the topology configuration do not appear in the selection window.
              Note    You can further drill down or expand your search using the parameters OR within a keyword and AND between keywords.
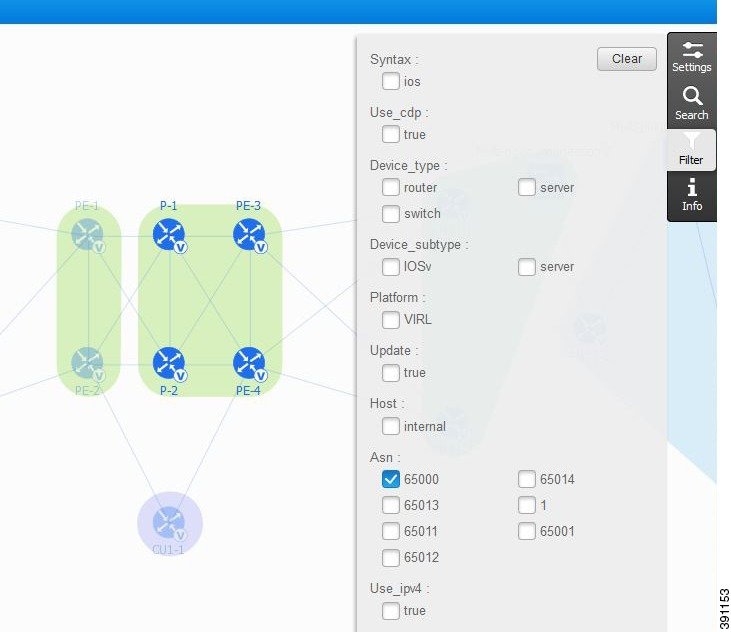
              For example, if your configuration contains multiple AS values, you can filter the display to show only AS values that match 65000.
              Figure 14. Filter AS Value 65000


              Step 2   To close the Filter window, click the Filter tab.

              What to Do Next

              • (Optional) Change settings, use the Search feature, or use the Filter feature.
              • (Optional) Return to the design and build phases to modify the topology and generate new configurations and AutoNetkit Visualizations.
              • (Optional) Run the topology simulation.