Work with Wireless 2D and 3D Floor Maps

Work with Floor Maps

There are several reasons to add floors with floor maps. One reason is to see your wireless network the way it exists today. Another reason is to help you plan and visualize future changes.

You can visualize your wireless network by creating or importing a floor map that contains various building components, like walls and windows, and then positioning your wireless devices on it. Using the floorplan, Cisco DNA Center computes 2D and 3D heatmaps that show the relative intensity of the RF signals in the coverage area. For 2D wireless maps, the heatmap is only an approximation of the actual RF signal intensity because it does not consider the attenuation of various building materials, such as drywall or metal objects, nor does it display the effects of RF signals bouncing off obstructions. In either case, we recommend that you import a file with an existing floor plan to get started.

Interactive planning helps you plan a floor layout by drawing planned, or hypothetical, APs and obstacles with a raster image or a CAD floor plan as the backdrop. You can export the floor map as a PDF and share it with the technicians who are mounting the APs. The floor drawing helps the technicians to visualize the floor layout and the exact AP mount locations.

With interactive floor planning, you can:

  • Create a floor layout with a raster or CAD floor plan as the canvas.

  • Place the planned APs or hypothetical APs on the floor map based on the signal coverage requirement. These hypothetical APs or planned APs are not yet installed or discovered by Cisco DNA Center.

  • Assign the antenna type and orientation.

  • Draw obstacles, such as walls and shelving on the floor, that impact the signal attenuation.

  • Plan all APs in sequence.

  • Export the floor map as a PDF.

Add a Floor with a Map File

When you create a floor, you can include a floor map at the same time. The following topics help you understand the different floor creation methods depending on the floor map file type that you use. Procedures for each method are also provided.

Floor Map Creation Methods

To view a wireless map, first you need to create or import a floor map:

  • Create a Floor Map: To create a floor map from scratch, you need to manually create all of the floor elements, such as the walls and shelving, for them to be represented in the wireless map. For details, see 2D Floor Map Devices and Overlay Objects.

  • Import a CAD file: When you use a CAD file (DXF or DWG file type) to import the floor map, Cisco DNA Center imports the CAD layers and allows you to specify which layers appear as floor elements in the wireless map.

    Because the computation of a 3D heatmap requires significant computing power, we recommend that you include only the CAD layers that contribute significantly to the heatmap computation. You should include enough information to get an accurate heatmap, but not unnecessary information that overloads the computation process and delays the heatmap display.

    Cisco DNA Center takes these initial steps to minimize the time it takes to generate a heatmap:

    • Restricts the maximum number of walls for 2D and 3D maps. The maximum number of walls for a 3D heatmap is 3000, after optimization. If your CAD file contains more, Cisco DNA Center alerts you and preserves the 3000 most relevant walls (based on the length of the wall multiplied by its attenuation).

      The maximum number of walls for a 2D heatmap is 300, after optimization. If your CAD file contains more, Cisco DNA Center alerts you and preserves the 300 most relevant walls (based on the length of the wall multiplied by its attenuation).

    • Automatically removes small obstructions (under 0.75 ft) and the second sides of the walls, leaving only one side per wall. (Cisco DNA Center applies an attenuation value for each wall, not for each side of a wall.)

    When deciding which layers and elements to import, focus on obstacles that create the most attenuation. In principle, the longer and thicker a wall is, the higher its attenuation. Low walls, like cubicles, and narrow walls, like columns, have low attenuation and have little effect on the heatmap. Even if the material of an obstacle is heavy, the attenuation is not significant, because the signal can radiate around the obstacle. Likewise, if you are not interested in the coverage outside of a building, do not include external walls or windows. Doing so provides better 3D visualization of the inside of the building.

    If your CAD file does not have walls in specific layers, but has walls mixed with other elements, do not select them for import. You can add walls manually later. For information, see Add, Edit, and Remove Walls.

    Block inserts and proxy entities cannot be imported. Please make imported layers contain only native elements like lines, polylines, arcs, and so on.

    For the procedure, see Add a Floor with a CAD Map File.

  • Import a non-CAD image file: You can use JPG, GIF, PNG, or PDF files to import the floor plan. Typically, this type of file is used to create 2D floor maps. However, you need to manually create the floor elements, such as the walls and shelving, for them to be represented in the wireless map. For the procedure, see Add a Floor with a Non-CAD Map File.

  • Import a Ekahau Pro Project plan: You can import Ekahau project data, such as the obstacles, APs, and more, to create a wireless map. For the procedure, see Import an Ekahau Project to Cisco DNA Center.

Guidelines for Image Files to Use in Maps

Follow these guidelines to use map image files:

  • Use a graphical application that can save the map image files to any of these formats—.jpg, .gif, .png, .pdf, .dxf, and .dwg.

  • Map image files can be of any size. Cisco DNA Center imports the full definition of the original images to its database, but during display, it automatically resizes them to fit the workspace.

  • Obtain the horizontal and vertical dimensions of the site in feet or meters before importing. This helps you to specify these dimensions during map import.

  • Avoid using floor map images with rotation metadata, because the images might not render correctly when synced to CMX or Cisco Spaces. Although the floor map images might be in formats that are supported by Cisco DNA Center, the ways in which certain tools add the metadata can be rendered differently. For example, an image file with rotation metadata that is opened in three different applications might render horizontally in two applications and vertically in the other.

Add a Floor with a CAD Map File

To view a wireless map, you must create a floor map. You can use CAD files (DXF or DWG file types) to create a floor map.

For 2D floor maps, you must choose the CAD layers that you want to be displayed in the 2D view. For 3D floor maps, Cisco DNA Center imports CAD layers as walls, shelving, obstacles, and other elements in the map.

Procedure


Step 1

Click the menu icon () and choose Design > Network Hierarchy.

Step 2

From the left hierarchy tree, hover your cursor over the ellipsis next to the building and choose Add Floor.
Step 3

In the Floor Name field, enter a name for the floor.

Step 4

From the Type (RF Model) drop-down list, choose the RF model to apply to the floor. The RF model determines how the RF is calculated based on the characteristics of the floor.

Step 5

Drag and drop the CAD file (the DXF or DWG file type) to the Floor Image area.

Note


By default, overlays are not displayed after you import a map. So, after you import a floor plan, make sure that you enable the overlay visibility. From the map toolbar, click View Options. From the right pane, expand Overlay Objects and click the toggle button for each object you want to display.

Step 6

In the Floormap dialog box, choose the CAD layers that you want to be displayed as floor elements in the map:

  1. For the 2D column, check the check boxes of the CAD layer that you want to be displayed in the 2D view.

  2. For the 3D Wall/Shelving Type column, use the drop-down list to choose a CAD layer that specifies the type of the wall or shelving.

    Note


    For a layer to appear in the 3D view, a 3D Wall/Shelving Type value is required. The wall/shelving type affects attenuation and how the heatmap is calculated. For more information, see Floor Map Creation Methods.

  3. Click Use Selected Layers.

Step 7

Enter the floor map dimensions in the Width, Length, and Height fields.

Step 8

Click Add.

By default, the map is displayed with a grid. To turn the grid off or on, use the Show Grid toggle button at the bottom-left side of the map.

Note


After you import a floor plan, make sure that you enable the overlay visibility. (From the floor, click View Options and enable the overlay toggles in Overlay Objects). By default, overlays are not displayed after you import a map.


Add a Floor with a Non-CAD Map File

You can use non-CAD files (JPG, GIF, PNG, or PDF file types) to create a floor map. However, when using a non-CAD file, the 3D floor elements, such as walls and shelvings, cannot be imported, and you must add them manually later. For more information, see 2D Floor Map Devices and Overlay Objects.

Procedure


Step 1

Click the menu icon () and choose Design > Network Hierarchy.

Step 2

From the left hierarchy tree, hover your cursor over the ellipsis next to the building and choose Add Floor.

Step 3

In the Floor Name field, enter a name for the floor.

Step 4

From the Type (RF Model) drop-down list, choose the RF model to apply to the floor. The RF model determines how the RF is calculated based on the characteristics of the floor.

Step 5

Drag and drop the non-CAD file (JPG, GIF, PNG, or PDF file type) onto the Floor Image area.

Note


Ensure to provide the precise dimensions of floors that are in PDF format, because the image width and height ratio cannot be extracted from them.

Step 6

Click Add.

The floor map is created.

Note


After you import a floor plan, make sure that you enable the overlay visibility. (From the floor, click View Options and enable the overlay toggles in Overlay Objects). By default, overlays are not displayed after you import a map.

Step 7

From the map toolbar, click Add/Edit.

Step 8

To add walls as a 3D floor element, do the following:

  1. From the map toolbar, click Add/Edit > Overlays > Walls.

  2. From the left pane of the map, click the wall type that you want to add.

    If the wall type is not in the list, click Add Wall Type to create a new wall type.

  3. Use the drawing tool to create a wall on the map:

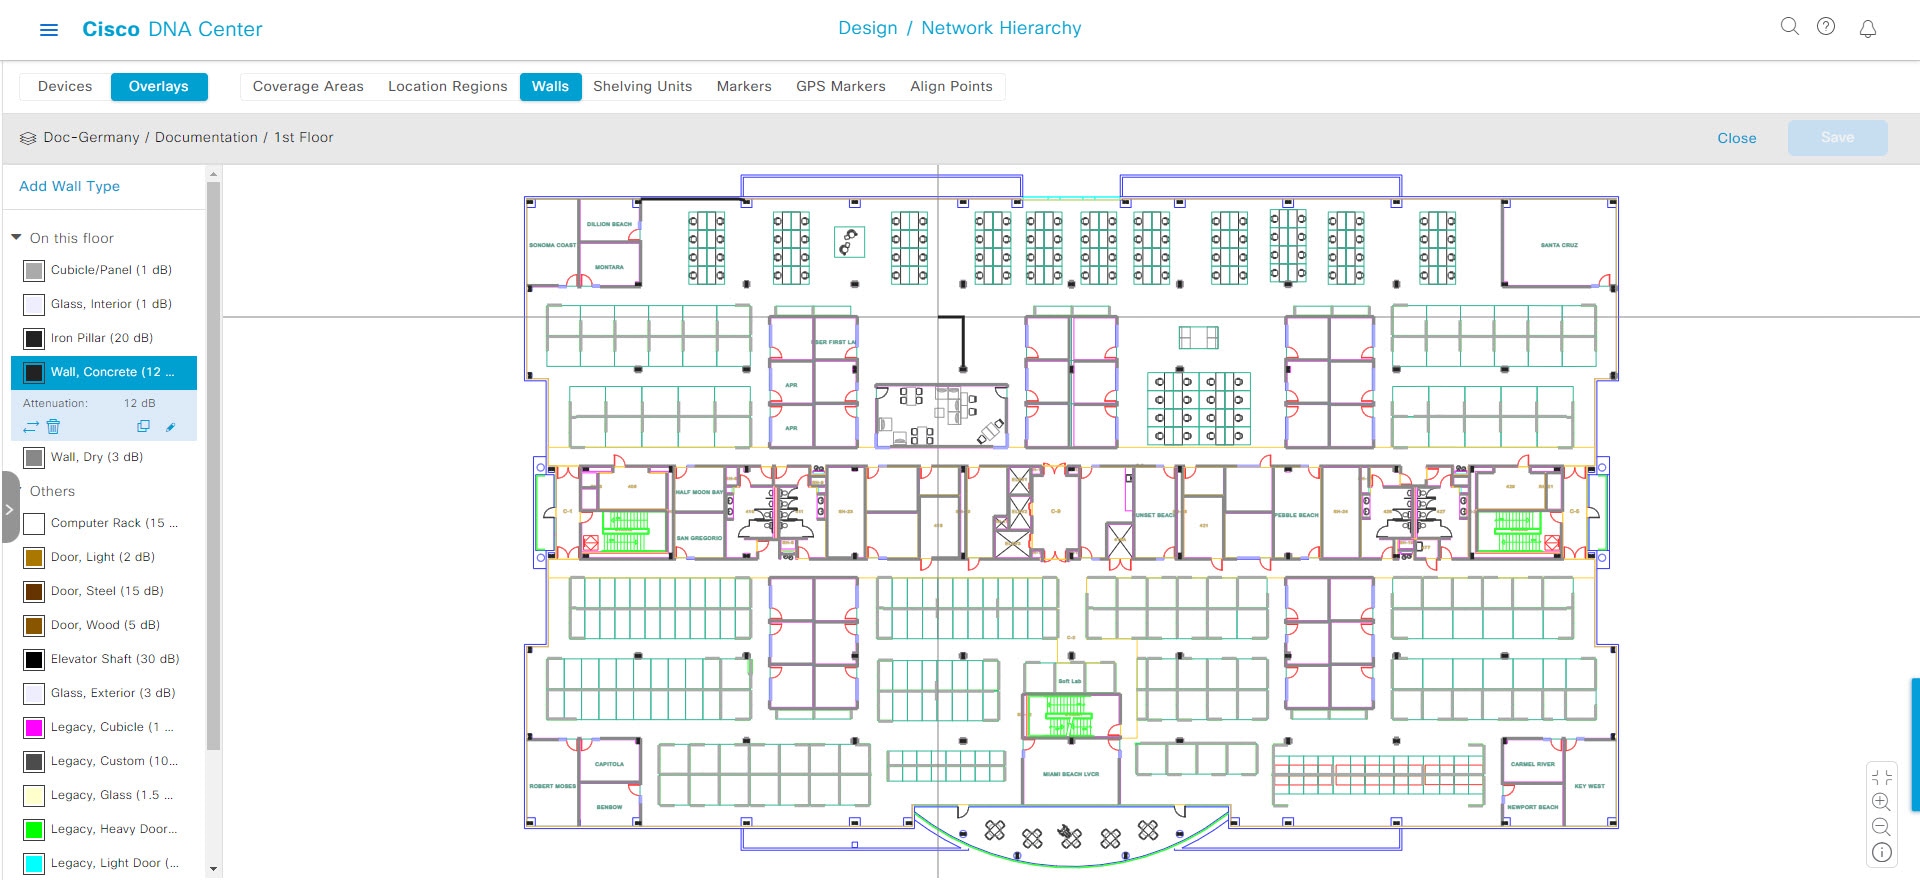
    • Click where you want to begin the wall. Then move your cursor to the next point and click again. Continue this process until you have created the wall in the shape you want.

    • To finalize the wall, double click where you want the wall to end. To cancel the drawing, right-click the map.

    • To change the type of an existing wall, right-click the shape and choose Change Type.

    • To move an existing wall, drag and drop the shape to the new location.

    • To remove an existing wall, right-click the shape and choose Delete.

    Figure 1. Adding a Wall with the Drawing Tool
    Add a wall with a drawing tool

Step 9

To add shelving units as a 3D floor element, do the following:

  1. In the map toolbar, click Shelving Units.

  2. In the left pane of the map, click the shelving type that you want to add.

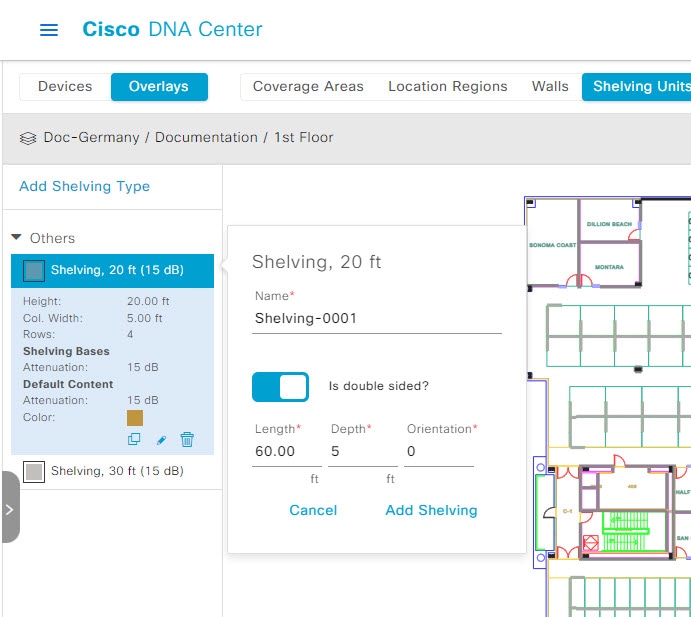
    • In the Shelving dialog box, you can edit the name, dimensions, and orientation of the shelving type. Orientation refers to the angle of the shelving, for example, 0 means that the shelving is vertical and parallel to the y axis.

    • If a shelving type is not in the list, click Add Shelving Type to create a new shelving type.

    Figure 2. Choosing a Shelving Type to Add
    Choose a shelving unit to add.
  3. In the Shelving dialog box, click Add Shelving to add the shelving to the floor map.

  4. Drag and drop the shelving to move it to a location on the floor map.

  5. Right-click the shelving and choose one of the following actions:

    • Edit: Edit the name, dimensions, and orientation of the shelving.

    • Clone: Create a copy of the shelving.

    • Array: Create an array of shelving by specifying the number of shelves and the distance between them.

    • Delete: Remove the shelving from the floor map.

Step 10

When you're done, click Save in the map toolbar.


Work with 2D Maps

2D maps are primarily used to configure elements on a floor map and view heatmaps.

Using 2D maps, you can add floor map elements and overlays. While viewing a 2D map, you can manipulate the display of the various elements and overlays. You can also filter device data and identify wireless interferers.

Cisco DNA Center calculates the strength and quality of wireless signals. These RF predictions are commonly known as heatmaps, because they show the relative intensity of the RF signals on the 2D wireless coverages area map.

2D Floor Map Devices and Overlay Objects

In 2D maps, you can configure devices and overlay objects on your floor maps.

Devices

  • APs: An access point (AP) serves as the connection point between wireless and wired networks or as the center point of a stand-alone wireless network. In 2D maps, an AP represents an actual, installed device. For a list of APs that Cisco DNA Center supports, see the Cisco DNA Center Compatibility Matrix.

  • Planned APs: Planned APs are representations of APs that have not been installed yet. By placing planned APs on a map, you can envision your wireless network RF coverage and make changes before you actually install the APs.

  • Sensors: A sensor is a dedicated Cisco Aironet 1800S Active Sensor that gets bootstrapped using Cisco PnP. After it obtains the Assurance server reachability details, it communicates directly with the Assurance server. For more details, including information about sensor tests, see the Cisco DNA Assurance User Guide.

Overlay Objects

  • Coverage Areas: By default, any area defined as part of a floor map is considered as a wireless coverage area. However, if you have a building that is nonrectangular or you want to mark a nonrectangular or polygon-shaped area on a floor, you can use the Coverage Areas drawing tool to create a coverage area.

  • Openings: An opening, also called an atrium, is an open-air or skylight-covered area within a building. An opening can extend through multiple floors and can affect wireless signal coverage areas.

  • Location Regions: Location regions define areas that are included in or excluded from the computation of heatmaps. Inclusion areas are included in the calculations. and exclusion areas are not included. For example, you might want to exclude areas such as openings, atriums, or stairwells within a building, but include a work area, such as cubicles, labs, or manufacturing floors.

  • Walls: Walls are exterior or interior vertical structures in a building and can be made of different materials and thicknesses. As such, they affect how heatmaps are calculated.

  • Shelving Units: Shelving units are obstacles that affect signal attenuation. A high-ceiling warehouse is an example of a location with shelving units.

  • Markers: A marker identifies a location on a map. When you create a marker, you can name it and position it to help you identify it later.

  • GPS Markers: When integrated with Cisco DNA Center, location services, such as Cisco Spaces or Cisco Connected Mobile Experiences (CMX), use GPS markers to calculate the approximate geographical location of clients.

  • Align Points: Align points are markers that are used to position multiple floors that have different physical shapes. In 3D maps, floors are aligned at the top-left corner of the map (point 0,0). If you manage each floor independently, the misalignment is not a problem. However, to use some of the features of 3D maps, the floors need to be aligned as they are in reality. To compensate this misalignment, you can insert one or more align points on two or more floors, so that the floors align properly one on top of the other in a 3D map.

Work with APs on a Floor Map

Cisco DNA Center computes heatmaps for the entire map that show the relative intensity of the Radio Frequency (RF) signals in the coverage area. For 2D wireless maps, the heatmap is only an approximation of the actual RF signal intensity because it does not consider the attenuation of various building materials, such as drywall or metal objects, nor does it display the effects of RF signals bouncing off obstructions.

Follow these guidelines while placing APs on the floor map:

  • Place APs along the periphery of coverage areas to keep devices close to the exterior of rooms and buildings. APs placed in the center of these coverage areas provide good data on devices that would otherwise appear equidistant from all other APs.

  • Location accuracy can be improved by increasing overall AP density and moving APs close to the perimeter of the coverage area.

  • In long and narrow coverage areas, avoid placing APs in a straight line. Stagger them so that each AP is more likely to provide a unique snapshot of the device location.

  • Although the design provides enough AP density for high-bandwidth applications, location suffers because each AP view of a single device is not varied enough. Therefore, location is difficult to determine. Move the APs to the perimeter of the coverage area and stagger them. Each has a greater likelihood of offering a distinctly different view of the device, resulting in higher location accuracy.

  • For optimal heatmap visibility on floor maps, configure the AP height to approximately 10 feet (3 meters) or lower.

Export Bulk APs from Cisco Prime Infrastructure and Import into Cisco DNA Center

Cisco DNA Center allows you to import, assign, and position a collection of access points to the floor map. If you have an existing collection of access points on Cisco Prime Infrastructure, you can import it into Cisco DNA Center, saving time and effort spent in importing, assigning, and positioning access points to the floor map.

This procedure describes how to export an existing collection of access points from Cisco Prime Infrastructure, and import into Cisco DNA Center.

Before you begin
  • To perform the following task, you must be a Super Admin or Network Admin.

  • Make sure that you have APs in your inventory. If not, discover them using the Discovery feature.

  • Add and position APs on a floor map.

  • The area, building, and floor must be present in the site hierarchy.

Procedure

Step 1

Export the bulk AP positions from Cisco Prime Infrastructure as a CSV file to your workstation.

Step 2

Click the menu icon () and choose Design > Network Hierarchy.

Step 3

From the left hierarchy tree, hover your cursor over the ellipsis next to the site and choose Import Bulk AP.

Step 4

In the Import Bulk AP pop-up window, drag and drop the AP file, or click Choose a file to select the file from your workstation.

Note

 
  • To manually create the AP Positions CSV file with Prime Template, export a Prime Template to your workstation by clicking Download Prime Template. Prime Template does not support nested files.

  • To manually create the AP Positions CSV file with Cisco DNA Template, export a Cisco DNA Template to your workstation by clicking Download Template. Cisco DNA Template supports nested files.

Wait for the CSV file to download. The CSV file contains information about AP positions of various sites in the network.

Step 5

Click Import.

The Import Summary window is displayed.

  • The Information tab shows the list of successfully imported APs.

  • Click the Warning tab to see the list of warnings.

  • Click the Error tab to see the list of errors.


Add APs to a Map

This procedure describes how to add APs to a map.

Before you begin

Make sure that you have Cisco APs in your inventory. If not, discover them using the Discovery feature. See Discovery Overview.

Procedure

Step 1

Click the menu icon () and choose Design > Network Hierarchy.

Step 2

From the left hierarchy tree, choose a floor.

Step 3

From the map toolbar, click 2D > Add/Edit > APs.

Step 4

In the map left pane, click Add APs.

Step 5

In the Add APs slide-in pane, do one of the following:

  • To add a single AP: Click Add next to an AP that you want to add.
  • To add multiple APs: Check the check boxes next to APs you want to add and click Add Selected.

Note


You can search for APs using the search option available. Use the Filter field to search for APs using the AP name, MAC address, model, or Cisco Wireless Controller. The search is case-insensitive. The search results appear in a table. Click Add to add one or more of these APs to the floor area.

In edit mode, newly added APs appear in the Unpositioned category in the map left pane. For more information, see Position an AP on a Map.

Step 6

After adding the APs to a floor, close the Add APs window.


What to do next

When you add an AP to a map, the wireless map automatically stores the following data even after the AP is deleted from the inventory:

  • AP name

  • AP MAC address

  • Current site of the AP

  • Current position of the AP on the map


Note


If you delete the corresponding site from the network hierarchy, the stored AP data is also removed.


When you delete the wireless controller with all its managed APs from the inventory, Cisco DNA Center displays a planned AP icon for the corresponding APs on the map. For more information, see AP Icon Legend.

If the same AP is rediscovered in the inventory later, Cisco DNA Center automatically places it back on the map at the same site and position even if a different wireless controller manages it.

To remove the AP data from the map when the AP is deleted from the inventory, you can do one of the following:

  • Before deleting the wireless controller from the inventory, assign the corresponding APs to the Global site. For more information, see Add a Device to a Site.

  • After deleting the wireless controller from the inventory, remove the corresponding planned APs from the map. For more information, see Remove APs from a Map.

Add Planned APs to a Map

This procedure shows you how to use the AP Model Catalog feature to add a planned AP to a floor and configure its model, antenna type, azimuth, and elevation orientation. Using the planned AP that you just created and placed, you can add more planned APs with the same properties.
Procedure

Step 1

Click the menu icon () and choose Design > Network Hierarchy.

Step 2

From the left hierarchy tree, choose a floor.

Step 3

In the map toolbar, click 2D > Add/Edit > APs.

Step 4

In the left pane of the map, in the AP Models area, click the AP model of the planned AP to add.

Note


If the AP model that you want to add is not listed, click Add Model to choose the AP model to add to the list.

Step 5

On the floor map, click the location where you want to place the planned AP.

A planned AP of the selected model is added to the floor map and the Edit Planned AP slide-in pane is displayed to the right, with an AP name added to it by default.

Step 6

In the Edit Planned AP slide-in pane, click the gear icon that is located next to the AP Name field.

The Name pattern dialog box is displayed.

Step 7

When you add the first AP to the floor, make sure that you enter a valid name pattern, for example, SJC-BLD21-FL2-AP####, and then click Set name pattern.

Note


The planned APs must be unique within Cisco DNA Center. So, make sure that the name pattern identifies the floor.

The #### in the name pattern is replaced by numbers in the AP Name, for example, SJC-BLD21-FL2-AP0001, SJC-BLD21-FL2-AP0002, and so on.

Step 8

From the Antenna drop-down list, choose the appropriate antenna type, including dual antennas, for the AP.

Note


The antenna image reflects the selected antenna.

Step 9

Depending on the antenna type, enter the Azimuth and Elevation orientation, in degrees.

Step 10

Perform the following actions, as needed:

  • To add another planned AP with the same properties as that of the planned AP that you just added, on the floor map, click a location where you want to position the new AP.

    A new AP icon is displayed on the map with all of the properties inherited and the AP name appended, for example, BLD1-AP0002-TX.

  • To add more planned APs with the same properties and appended AP name, click the floor map.

  • To stop adding planned APs to the floor map, press Esc or right-click the floor map.

  • To reposition the planned APs, drag and drop them to the appropriate location in the floor map.

  • To delete a planned AP, right-click the AP icon and click Delete.

  • To edit a planned AP, right-click the AP icon and click Edit.

Step 11

In the map toolbar, click Save.


Assign Actual APs to Planned APs

After you install the actual APs in your wireless network, you can assign them to the planned APs on your map. This procedure describes how to assign planned APs to actual APs.

Procedure

Step 1

Click the menu icon () and choose Design > Network Hierarchy.

Step 2

From the left hierarchy tree, choose a floor.

Step 3

In the map toolbar, click 2D > Add/Edit > APs.

Step 4

In the left pane of the map, click Assign PAPs.

Step 5

On the floor map, click a planned AP.

Step 6

In the Assign Planned APs slide-in pane, check the check box next to the AP that you want to assign.

Step 7

Click Assign.

Step 8

In the map toolbar, click Save.


Position an AP on a Map

After adding APs to a floor, you must position them on the map. This procedure shows you how to position APs on a map.

Procedure

Step 1

Click the menu icon () and choose Design > Network Hierarchy.

Step 2

From the left hierarchy tree, choose a floor.

Step 3

In the map toolbar, click 2D > Add/Edit > APs.

Step 4

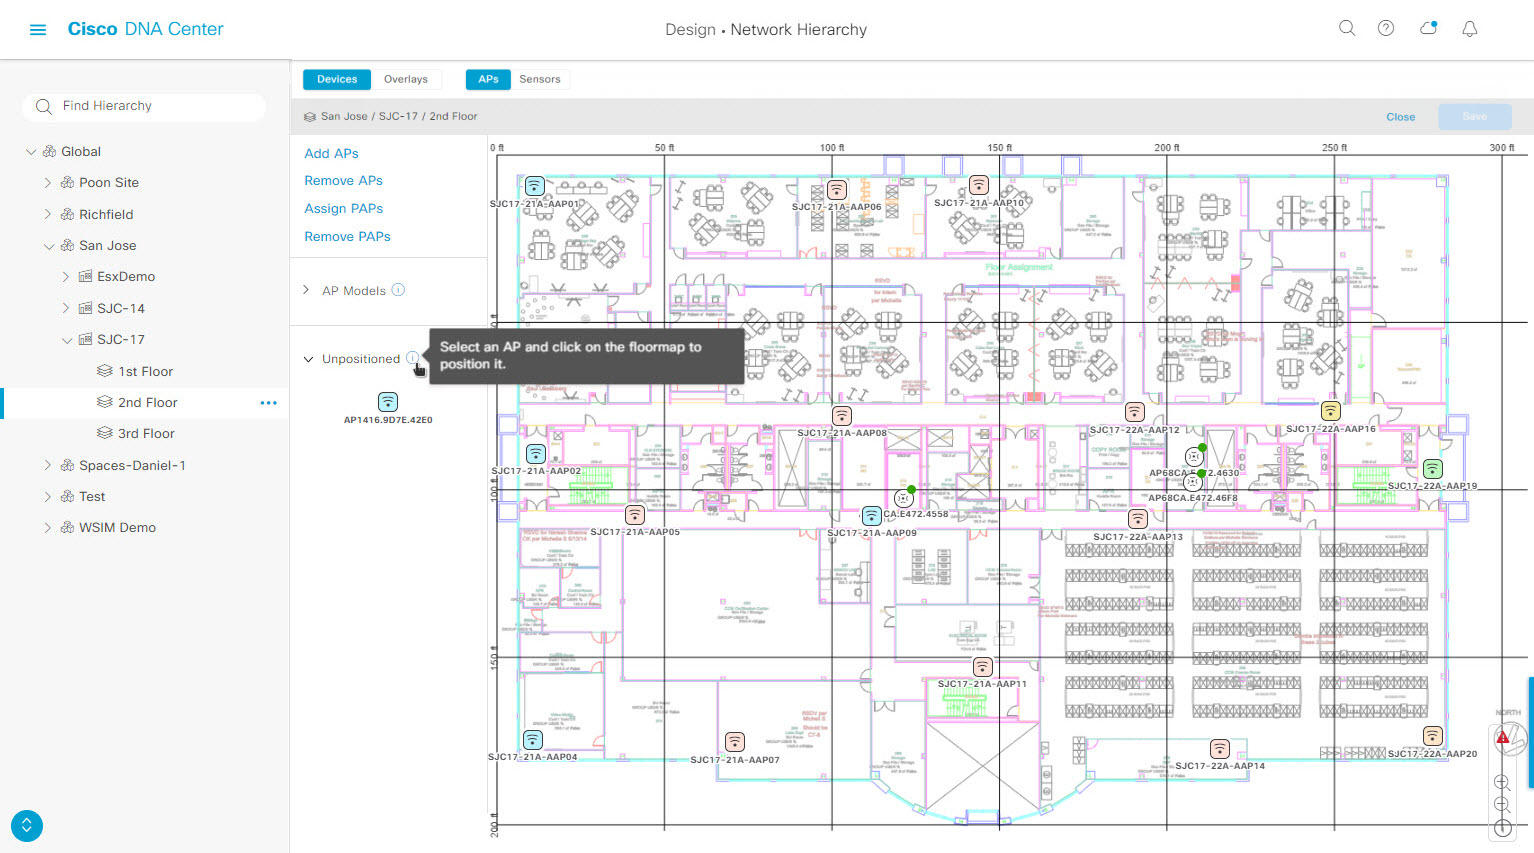
From the Unpositioned category in the left pane of the map, click an AP.

Figure 3. Unpositioned APs
Unpositioned APs on a floor map

Step 5

To position the AP, do one of the following:

  • Click the location on the floor map where you want to position the AP.
  • In the Edit AP slide-in pane, enter the x and y coordinates in the corresponding fields.
  • Draw three points on the floor map and position the AP by using the selected points. To draw three points, do the following:
    1. In the Edit AP slide-in pane, click Position by 3 points.

    2. To define the points, click anywhere on the floor map to draw the first point. Click again to finish drawing the point.

      A dialog box is displayed to set the distance to the first point.

    3. Enter the distance, in meters, and click Set Distance.

    4. Define the second and third points similarly, and click Save.

  • Define two walls on the floor map and position the APs between the defined walls. This method helps you to know the position of APs between the two walls.
    1. In the Edit AP slide-in pane, click Position by 2 walls.

    2. To define the first wall, click anywhere on the floor map to start drawing the line. Click again to finish drawing the line.

      A dialog box is displayed to set the distance to the first wall.

    3. Enter the distance in meters and click Set Distance.

    4. Define the second wall similarly and click Save.

      The AP is placed based on the defined distance between the walls.

Step 6

In the map toolbar, click Save.

Note


If a Cisco Connected Mobile Experiences (CMX) is synchronized with Cisco DNA Center, you can view the location of clients on the heatmap. See Create Cisco CMX Settings.


Reposition an AP on a Map

After you position APs on a map, you can reposition them. This procedure shows you how to reposition an AP on a map.


Note


You can perform this task in a 2D or 3D map.


Procedure

Step 1

Click the menu icon () and choose Design > Network Hierarchy.

Step 2

From the left hierarchy tree, choose a floor.

Step 3

For 2D, do the following:

  1. In the map toolbar, click 2D > Add/Edit.

  2. On the map, drag and drop the AP to the new position.

Step 4

For 3D, do the following:

  1. In the map toolbar, click 3D > Add/Edit.

  2. On the map, right click the AP and choose Move.

  3. On the map, drag and drop the AP to the new position.

Step 5

In the map toolbar, click Save.


Edit an AP

This procedure shows you how to change the configuration of a single AP. To change the configuration of multiple APs at the same time, see Edit Multiple APs.


Note


You can perform this task in a 2D or 3D map.


Procedure

Step 1

Click the menu icon () and choose Design > Network Hierarchy.

Step 2

From the left hierarchy tree, choose a floor.

Step 3

For 2D, do the following:

  1. In the map toolbar, click 2D > Add/Edit.

  2. On the map, right-click the AP and choose Edit.

Step 4

For 3D, do the following:

  1. In the map toolbar, click 3D > Add/Edit.

  2. On the map, right-click the AP and choose Details.

Step 5

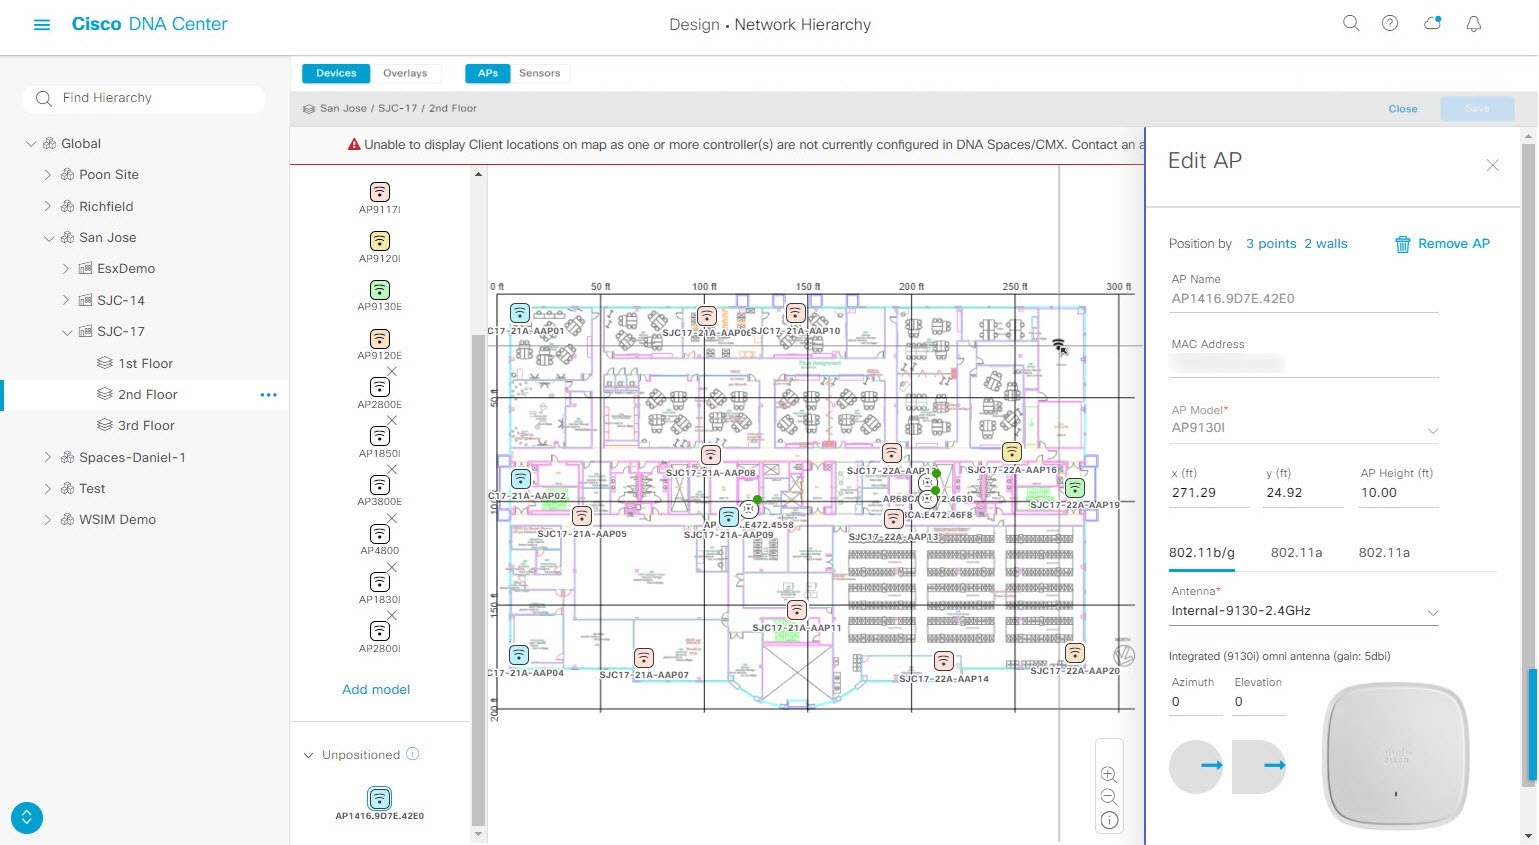
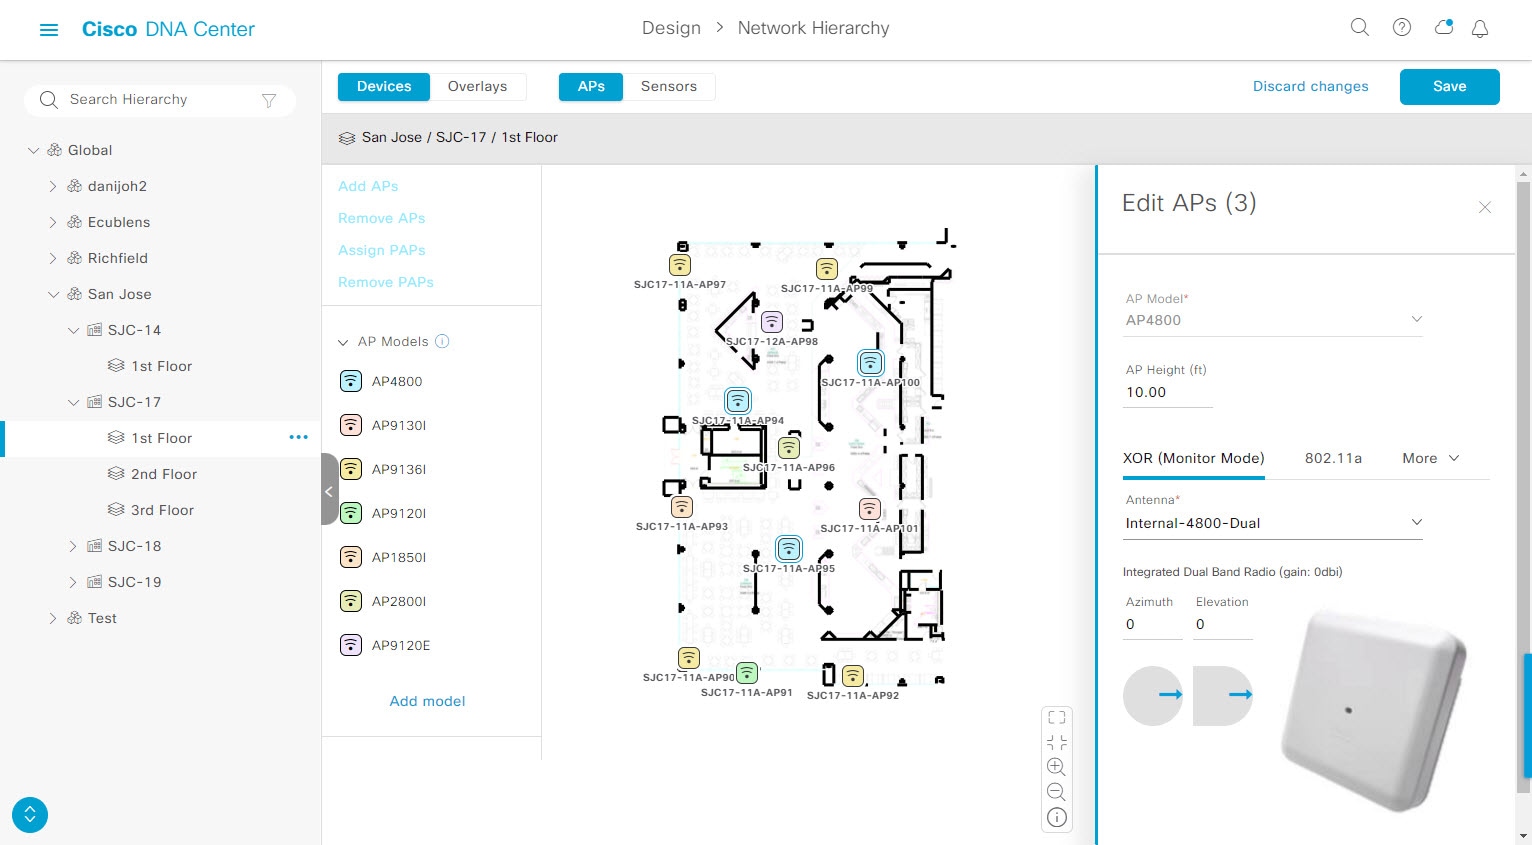
In the Edit AP slide-in pane, change any of the following AP settings, as needed:

  • AP Name or Planned AP Name: Name of the AP.

  • MAC Address: MAC address of the selected AP.

  • AP Model: Model of the selected AP.

  • x: X-axis coordinate of the AP.

  • y: Y-axis coordinate of the AP.

  • AP Height: Height of the AP.

  • Antenna: Antenna type for this AP.

    Note


    For external APs, you must select an antenna. If you don't select an antenna, the AP will not be present on the map.

  • Azimuth: Angle of the antenna, measured relative to the x axis, clockwise. The azimuth range is from 0 through 360. In Cisco DNA Center, pointing right is 0 degrees or 360 degrees; pointing down is 90 degrees.

    You can manually enter the value or use the blue arrow under the field to change the value.

    Note


    For omnidirectional antennas, the azimuth is not relevant if the elevation is 0.

  • Elevation: in degrees. You can manually enter the value or use the blue arrow under the field to change the value.

Note


For APs and antenna models that are designed to be placed on a ceiling, 0 elevation means pointing down. For APs and antenna models that are designed to be placed on a wall, 0 elevation means pointing horizontally and negative values means pointing down.

Figure 4. Edit AP Slide-In Pane
Edit AP slide-in pane

Step 6

In the map toolbar, click Save.


Edit Multiple APs

When you select only one AP, you can change all editable attributes. However, when you select multiple APs, only some attributes are editable, as follows:

  • When the selected devices have the same value for an attribute, the value is displayed. Otherwise, the value is blank. In either case, if you change the value, the new value is applied to all the selected devices.

  • When the selected APs have the same model number and radios (number of radios and operating band), the antennas are editable. Otherwise, they are not editable.

  • You can change the model numbers of planned APs, but not added APs. So, if you select an AP, the model number is not editable.

  • Because bulk changes affect more devices, they do not take effect immediately. You must click Apply to apply your changes.

This procedure shows you how to update the editable attributes for multiple APs at the same time.


Note


You can perform this task in a 2D or 3D map.


Procedure

Step 1

Click the menu icon () and choose Design > Network Hierarchy.

Step 2

From the left hierarchy tree, choose a floor.

Step 3

Do one of the following:

  • For 2D, in the map toolbar, click 2D > Add/Edit.

  • For 3D, in the map toolbar, click 3D > Add/Edit.

Step 4

Select the APs, using one of the following methods:

  • Click the first device, then press and hold the Shift key while you click the rest of the devices.

  • In the map navigation toolbar, click Select by rectangle. Then click an area of the map and drag the highlighted rectangle to select APs in a contiguous area. All the highlighted APs within the rectangle are selected.

To deselect APs, use one of the following methods:

  • To deselect a single AP, press and hold the Shift key while you click the AP.

  • To deselect all APs except one, click the AP you want to remain selected. All others are deselected.

  • To deselect all APs, press the ESC key or close the Edit pane.

Step 5

In the Edit AP slide-in pane, configure the settings, as available:

  • AP Name or Planned AP Name: Name of the AP.

  • MAC Address: MAC address of the selected AP.

  • AP Model: Model of the selected AP.

  • x: X-axis coordinate of the AP. You can manually enter the value.

  • y: Y-axis coordinate of the AP. You can manually enter the value.

  • AP Height: Height of the AP. You can manually enter the value.

  • Antenna: Antenna type for this AP.

    Note


    For external APs, you must select an antenna, or the AP will not be present in the map.

  • Azimuth: Angle of the antenna, measured relative to the x axis, clockwise. The azimuth range is from 0 through 360. In Cisco DNA Center, pointing right is 0 degrees or 360 degrees; pointing down is 90 degrees.

    You can manually enter the value or use the blue arrow under the field to change the value.

    Note


    For omnidirectional antennas, the azimuth is not relevant if the elevation is 0.

  • Elevation: in degrees. You can manually enter the value or use the blue arrow under the field to change the value.

Note


For APs and antenna models that are designed to be placed on a ceiling, 0 elevation means pointing down. For APs and antenna models that are designed to be placed on a wall, 0 elevation means pointing horizontally and negative values means pointing down.

Figure 5. Edit Multiple APs Slide-In Pane
Edit multiple APs slide-in pane

Step 6

In the map toolbar, click Save.


Remove APs from a Map

This procedure shows you how to remove APs and planned APs (PAPs) from a map.

Procedure

Step 1

Click the menu icon () and choose Design > Network Hierarchy.

Step 2

From the left hierarchy tree, choose a floor.

Step 3

In the map toolbar, click 2D > Add/Edit.

Step 4

To remove APs (including planned APs), do the following:

  1. Click the AP, or to select multiple APs, click the first AP and while pressing the Shift key, click the rest of the APs.

  2. In the Edit pane, click Remove Selected.

Step 5

In the map toolbar, click Save.


Work with Sensors on a Floor Map

The following topics show you how to add sensors to floor maps and position, reposition, and delete them, if needed.

For more information about sensors, see 2D Floor Map Devices and Overlay Objects.

Add Sensors to a Map

This procedure shows you how to add sensors to a map.

Before you begin
Make sure you have the Cisco AP 1800S sensor in your inventory. The Cisco Aironet 1800s Active Sensor must be provisioned using Plug and Play for it to show up in the Inventory. See the "Provision the Wireless Cisco Aironet 1800s Active Sensor" topic in the Cisco DNA Assurance User Guide.
Procedure

Step 1

Click the menu icon () and choose Design > Network Hierarchy.

Step 2

From the left hierarchy tree, choose a floor.

Step 3

In the map toolbar, click 2D > Add/Edit > Sensors.

Step 4

In the Add Sensors slide-in pane, check the check boxes of the sensors that you want to add. Alternatively, click Add next to the sensor row.

Note


You can search for specific sensors using the Filter field. Search using the name, MAC address, or model of a sensor. The search is not case-sensitive. The results are displayed in the table. Click Add to add one or more of these sensors to the floor area.

Newly added sensors are displayed in the Unpositioned category in the left pane of the map in edit mode.

Step 5

In the map toolbar, click Save.


Position Sensors on a Map

Newly added sensors are displayed in the Unpositioned category in the left pane of the map in edit mode. This procedure shows you how to position a sensor after initially adding it.

Before you begin

Sensors must be added to the map before they can be positioned. For information, see Add Sensors to a Map

Procedure

Step 1

Click the menu icon () and choose Design > Network Hierarchy.

Step 2

From the left hierarchy tree, choose a floor.

Step 3

In the map toolbar, click 2D > Add/Edit > Sensors.

Step 4

In the left pane of the map, click a sensor in the Unpositioned category to position the sensor.

Step 5

On the floor map, click the location where you want to position the sensor.

You can use the x, y, and sensorHeight fields in the Sensor Details slide-in pane to enter the exact x, y, and z coordinates for the sensor.

Step 6

In the map toolbar, click Save.


Reposition a Sensor on a Map

After you position sensors on a map, you can reposition them. This procedure shows you how to reposition a sensor on a map.


Note


You can perform this task in a 2D or 3D map.


Procedure

Step 1

Click the menu icon () and choose Design > Network Hierarchy.

Step 2

From the left hierarchy tree, choose a floor.

Step 3

In the map toolbar, click 2D or 3D.

Step 4

In the map toolbar, click Add/Edit.

Step 5

On the map, drag and drop the sensor to the new position.

Step 6

In the map toolbar, click Save.


Remove Sensors from a Map

This procedure shows you how to remove sensors from a floor map.

Procedure

Step 1

Click the menu icon () and choose Design > Network Hierarchy.

Step 2

From the left hierarchy tree, choose a floor.

Step 3

In the map toolbar, click 2D > Add/Edit.

Step 4

To remove sensors, do the following:

  1. Click the sensor, or to select multiple sensors, click the first sensor and while pressing the Shift key, click the rest of the sensors.

  2. In the Edit pane, click Remove.

Step 5

In the map toolbar, click Save.


Add, Edit, and Remove Coverage Areas

This procedure shows you how to mark a nonrectangular or polygon-shaped area as a coverage area on a floor map.

For more information about coverage areas, see 2D Floor Map Devices and Overlay Objects.

Procedure


Step 1

Click the menu icon () and choose Design > Network Hierarchy.

Step 2

From the left hierarchy tree, choose a floor.

Step 3

In the map toolbar, click 2D > Add/Edit > Overlays > Coverage Areas.

Step 4

To add a coverage area, do the following:

  1. In the Coverage Area dialog box, enter a name for the coverage area in the field.

  2. Click Add Coverage.

  3. Click on the map to create a point and initiate the drawing tool.

  4. Continue creating points to define the coverage area shape.

    Note


    The coverage area shape must have at least three points. Click and drag a point to redefine the coverage area shape.

  5. Double-click to exit the drawing tool and finalize the coverage area shape.

Step 5

To edit a coverage area, do the following:

  1. In the map toolbar, click Add/Edit > Coverage Areas.

  2. To redefine the shape of a coverage area, click and drag a point.

  3. To edit a coverage area name, right-click the coverage area and choose Edit.

Step 6

To delete a coverage area, do the following:

  1. In the map toolbar, click Add/Edit > Coverage Areas.

  2. Right-click the coverage area and choose Remove.

Step 7

In the map toolbar, click Save.


Add, Edit, Copy, and Remove Openings

Creating an opening is similar to creating an open space or atrium on a floor. On multifloor buildings, typically the opening extends vertically through multiple floors. This procedure shows you how to add, edit, and remove openings on a floor map. It also shows you how to copy openings to other floors.

For more information about openings, see 2D Floor Map Devices and Overlay Objects.

Procedure


Step 1

Click the menu icon () and choose Design > Network Hierarchy.

Step 2

From the left hierarchy tree, choose a floor.

Step 3

In the map toolbar, click 2D > Add/Edit > Overlays > Openings.

Step 4

To add an opening, do the following:

  1. From the left pane of the map, click Opening.

  2. Click on the map to create a point and initiate the drawing tool.

  3. Continue creating points to define the opening shape.

    Note


    The opening shape must have at least three points. Click and drag a point to redefine the opening shape.

  4. Double-click to exit the drawing tool and finalize the shape.

Step 5

To edit an opening, do the following:

  1. In the map toolbar, click Add/Edit > Openings.

  2. To redefine the shape of an opening, click and drag a point.

  3. To move an opening, click inside the shaded area. Then, drag and drop the opening where you want to place it.

Step 6

To copy an opening from one floor to another, do the following:

  1. In the map toolbar, click Add/Edit > Openings.

  2. Right-click the opening and choose Copy to other floors.

  3. In the dialog box, check the check boxes next to the relevant floors.

  4. Click Copy.

  5. Click Close.

Step 7

To remove an opening, do the following:

  1. In the map toolbar, click Add/Edit > Openings.

  2. Right-click the opening and choose Remove.

Step 8

In the map toolbar, click Save.


Add, Edit, and Remove Location Regions

Location regions are areas on the map that are either included in or excluded from the heatmap calculation. The following topics show you how to add, edit, and remove location regions.

Add, Edit, and Remove an Inclusion Region

This procedure shows you how to add, edit, and remove an inclusion region. Use the following guidelines to define an inclusion region on a floor map:

  • Inclusion regions can be any polygon-shaped area and must have at least three points.

  • You can only define one inclusion region on a floor. By default, an inclusion region is defined for each floor area when it is created. The inclusion region is indicated by a solid aqua line, and generally outlines the entire floor area.

For more information about inclusion regions, see 2D Floor Map Devices and Overlay Objects.

Procedure

Step 1

Click the menu icon () and choose Design > Network Hierarchy.

Step 2

From the left hierarchy tree, choose a floor.

Step 3

In the map toolbar, click 2D > Add/Edit > Overlays > Location Regions.

Step 4

In the left pane of the map, click the Inclusion icon.

Step 5

To create an inclusion region, use the drawing tool:

  1. Click the map to create a point where you want the inclusion region to begin.

  2. Move the cursor to the next point and click again.

  3. Continue creating points to define the inclusion region shape.

  4. To finalize the shape, double-click the map.

    Alternatively, from the left pane of the map, click the Inclusion icon.

  5. To exit the drawing tool, double-click the map again.

Step 6

To edit the location of an inclusion region, drag and drop the shape to the new location.

Step 7

To remove an inclusion region, right-click the shape and choose Remove.

Step 8

In the map toolbar, click Save.


Add, Edit, and Remove an Exclusion Region

This procedure shows you how to add, edit, and remove an exclusion region. Use the following guidelines to define exclusion regions on a floor map:

  • Exclusion regions can be any polygon-shaped area and must have at least three points.

  • Exclusion regions are defined within the borders of an inclusion region.

  • You can define multiple exclusion regions on a floor map.

For more information about exclusion regions, see 2D Floor Map Devices and Overlay Objects.

Procedure

Step 1

Click the menu icon () and choose Design > Network Hierarchy.

Step 2

From the left hierarchy tree, choose a floor.

Step 3

In the map toolbar, click 2D > Add/Edit > Overlays > Location Regions.

Step 4

From the left pane of the map, click the Exclusion icon.

Step 5

To create an exclusion region, use the drawing tool:

  1. Click the map to create a point where you want the exclusion region to begin.

  2. Move the cursor to the next point and click again.

  3. Continue creating points to define the exclusion region shape.

  4. To finalize the shape, double-click the map.

    Alternatively, from the map left pane, click the Exclusion icon.

  5. To exit the drawing tool, double-click the map again.

Step 6

To edit the location of an exclusion region, drag and drop the shape to the new location.

Step 7

To remove an exclusion region, right-click the shape and choose Remove.

Step 8

In the map toolbar, click Save.


Add, Edit, and Remove Walls

This procedure shows you how to add, edit, move, and remove walls on a floor map.

For more information about walls, see 2D Floor Map Devices and Overlay Objects.

Procedure


Step 1

Click the menu icon () and choose Design > Network Hierarchy.

Step 2

From the left hierarchy tree, choose a floor.

Step 3

In the map toolbar, click 2D > Add/Edit > Overlays > Walls.

Step 4

To add walls, do the following:

  1. In the left pane of the map, click a wall type from the Others or On this floor category.

    Note


    If a wall type isn't listed, click Add Wall Type to create a custom wall type.

  2. Click the map to create a point where you want the wall to begin.

  3. Move the cursor to the next point, where you want to end the wall or where you want to create a corner and click again.

  4. Continue creating points to define the wall shape.

  5. To end a wall, double-click the map.

    Alternatively, from the left pane, click the wall type.

  6. To exit the drawing tool, double-click the map again.

Step 5

To change a wall type, and depending on the wall type also configure its parameters, do the following:

  1. Click the wall that you want to change.

    The Wall Type dialog box opens.

  2. From the Wall Type drop-down list, choose the type of wall.

  3. Configure any other parameters that are appropriate for the new wall type.

  4. Click Update.

Step 6

To move a wall, do the following:

  1. Hover your cursor over the wall that you want to move.

    The wall turns black, which means it's selected.

  2. Click the wall and drag and drop it to the new location.

Step 7

To remove a wall, right-click the wall and choose Remove.

Step 8

In the map toolbar, click Save.


Add, Copy, Edit, and Remove Shelving Units

This procedure shows you how to add, copy, edit, and remove shelving units on a floor map.

For information about shelving units, see 2D Floor Map Devices and Overlay Objects.

Procedure


Step 1

Click the menu icon () and choose Design > Network Hierarchy.

Step 2

From the left hierarchy tree, choose a floor.

Step 3

In the map toolbar, click 2D > Add/Edit > Overlays > Shelving Units.

Step 4

To add shelving units, do the following:

  1. In the left pane of the map, click the shelving type you want to add.

  2. In the shelving dialog box, configure the name, dimensions, orientation, and whether the unit is double-sided, or leave the default values. Orientation means the angle of the shelving unit. A shelving unit with an orientation of 0 means that the shelving unit is vertical and parallel to the y-axis.

    If a shelving type is not in the list, click Add Shelving Type to create a shelving type.

  3. Click Add Shelving.

    The shelving unit is displayed on the map.

  4. Drag and drop the shelving unit to its location on the map.

Step 5

To create a copy or an array of a shelving unit, do one of the following:

  • To create a copy, right-click the shelving unit and choose Clone.

  • To create an array, right-click the shelving unit and choose Array. Then specify the number of units and the distance between them.

Step 6

To edit the name, dimensions, orientation, and whether it is two-sided, right-click the shelving unit and choose Edit.

Step 7

To remove a shelving unit, right-click the shelving unit and choose Remove.

Step 8

In the map toolbar, click Save.


Add, Edit, and Remove Markers

The following procedure shows you how to add, edit, and remove markers.

Procedure


Step 1

Click the menu icon () and choose Design > Network Hierarchy.

Step 2

From the left hierarchy tree, choose a floor.

Step 3

In the map toolbar, click 2D > Add/Edit > Overlays > Markers.

Step 4

In the left pane of the map, click the Markers icon.

Step 5

In the Place Markers dialog box, enter the name for the marker, and click Add Marker.

Step 6

To place the marker, click the map where you want to place the marker.

Step 7

To move a marker, hover your cursor over the marker until it turns blue. Then drag and drop it in the new location.

Step 8

To edit a marker, right-click the marker and choose Edit.

Step 9

To remove a marker, right-click the marker and choose Remove.

Step 10

In the map toolbar, click Save.


Add, Edit, and Remove GPS Markers

This procedure shows you how to add, edit, and remove GPS markers. For more information about GPS markers, see 2D Floor Map Devices and Overlay Objects.


Note


The GPS marker is an attribute of the building. You can apply it to all the floors of the building.


Procedure


Step 1

Click the menu icon () and choose Design > Network Hierarchy.

Step 2

From the left hierarchy tree, choose a floor.

Step 3

In the map toolbar, click 2D > Add/Edit > Overlays > GPS Markers.

Step 4

To add a GPS marker, do the following:

  1. In the left pane of the map, click the GPS Markers icon.

  2. On the map, click the location where you want to place the GPS marker.

    GPS markers must be positioned inside the outer-perimeter walls, typically at the building corners.

  3. In the Place Markers dialog box, enter the name, latitude, longitude, and the x and y coordinates in the appropriate fields.

    The latitude and longitude coordinates of the GPS marker located in the northwest corner of a floor must match the building coordinates.

  4. Click Add GPS Marker.

Step 5

To edit a GPS marker, right-click the GPS marker and choose Edit.

Step 6

To remove a GPS marker, right-click the GPS marker and choose Remove.

Step 7

In the map toolbar, click Save.


Add, Edit, and Remove Align Points

This procedure shows you how to add, edit, and remove align points. For more information about align points, see 2D Floor Map Devices and Overlay Objects.

Procedure


Step 1

Click the menu icon () and choose Design > Network Hierarchy.

Step 2

From the left hierarchy tree, choose a floor.

Step 3

In the map toolbar, click 2D > Add/Edit > Overlays > Align Points.

Step 4

To add an alignment point, do the following:

  1. In the left pane of the map, click the Align Points icon.

  2. On the map, click the location where you want to place the alignment point.

Step 5

To edit the name of an alignment point, do the following:

  1. Right-click the alignment point and choose Edit.

  2. Change the name and click Edit Marker.

Step 6

To change the location of an alignment point, do the following:

  1. Right-click the alignment point and choose Edit.

  2. Click Edit Marker.

  3. Drag and drop the alignment point to the new location.

Step 7

To remove an alignment point, right-click the alignment point and choose Remove.

Step 8

In the map toolbar, click Save.


View a 2D Wireless Floor Map

Use the 2D heatmap to view information about your wireless network.

Procedure


Step 1

Click the menu icon () and choose Design > Network Hierarchy.

Step 2

From the left hierarchy tree, choose a floor.

Step 3

In the map toolbar, click 2D.

The wireless 2D map opens.

Step 4

To display specific details about devices, do the following, based on the device type:

  • APs: The AP icon indicates the number of radios, their frequency and health, overall health score of the device, and the AP name and mode. For more information about interpreting the AP icon, see AP Icon Legend.

    To display device details, hover your cursor over an AP icon. Information, such as the AP's Rx neighbors, clients, interferers, and health score, is displayed.

    For more details about an AP, in the dialog box, click the Device 360 link.

    Note


    For Device 360, the Assurance - Base package is required.

  • Mesh APs: To display device details, hover your cursor over a mesh AP icon. Information, such as mesh, backhaul, and access data, is displayed.

  • Clients: To display client information, including a link to its associated AP, hover your cursor over or click a client. For more details about a client, in the dialog box, click the Client 360 link.

  • Sensors: To view the status and test results of a sensor, click a sensor icon.

  • Switches and Switch Stacks: To display the member switches of a switch stack, click the arrow next to the switch stack icon. To display the connections between a switch and its associated APs, hover your cursor over the switch or switch stack icon. The map displays a line showing the connections from the switch and its associated APs. You can also identify switch and AP associations by color. APs connected to one specific switch have labels that match the color code on the switch icon.

    To display device details, click a switch or switch stack icon. A slide-in pane opens and displays the device details and options for the heatmap display. Under Select Heatmap, you can click any of the following radio buttons:

    • All visible switches: Computes and displays the heatmap for all the switches in the visible map area.

    • This switch: Computes and displays the heatmap for the selected switch only.

    • Rest of visible switches: Computes and displays the heatmap for all of the visible switches, except for the selected switch.

    • None: Does not include any switch in the heatmap computation and heatmap display.

Step 5

To display information about a link, click the link. Depending on the type of link, information such as link health and other statistics are displayed.

For a mesh link, you can perform a link test between two mesh APs.

Step 6

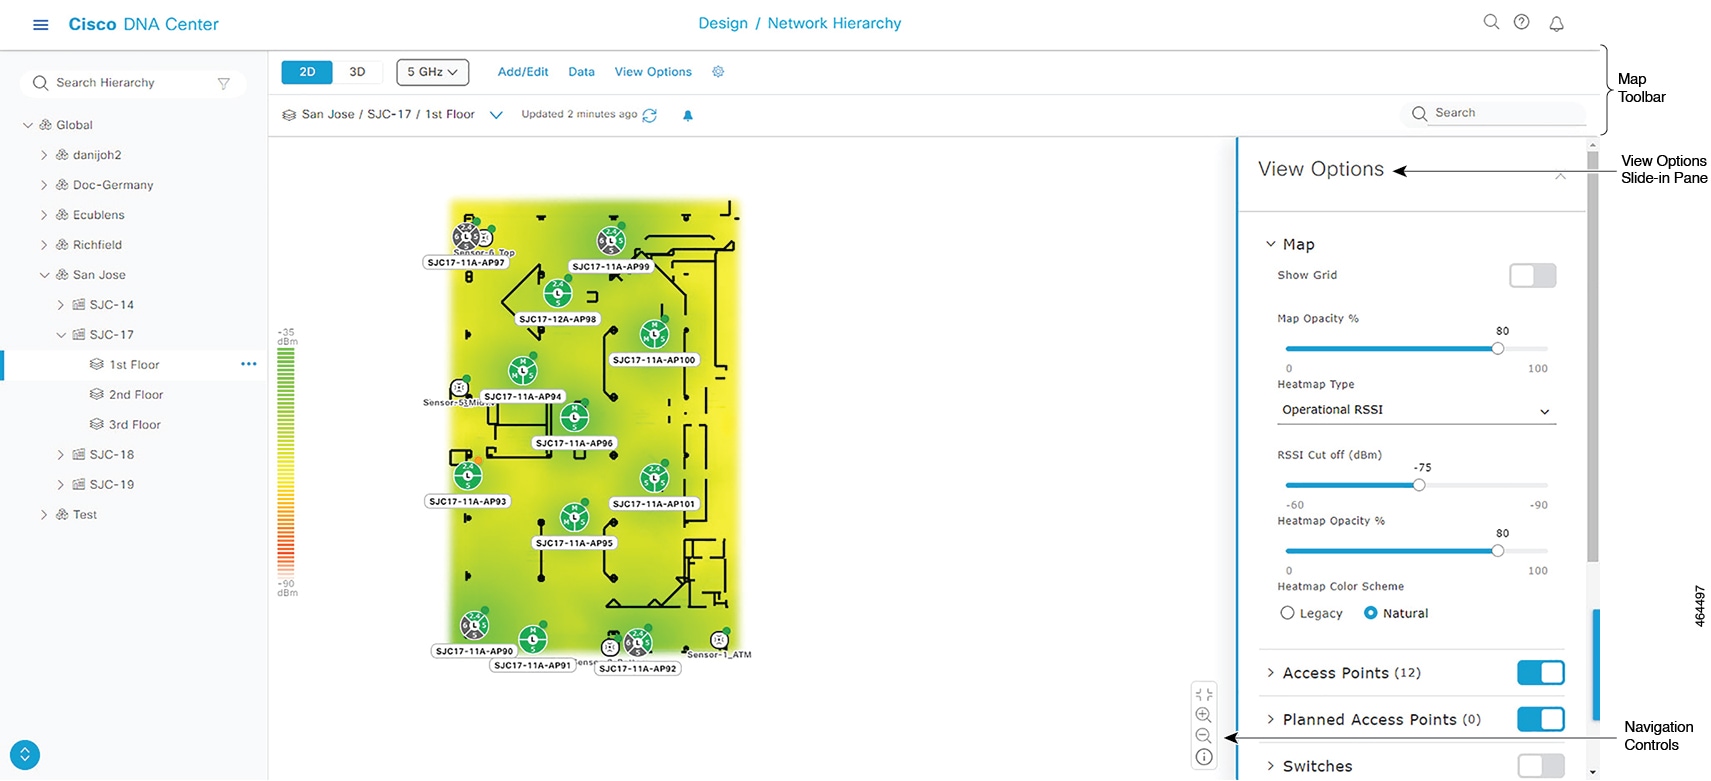
Use the tools and options shown in the following figure to gain insights about your wireless network.

Figure 6. 2D Wireless Map Showing Tools and Options
2D wireless map showing the tools and options
  • Map Toolbar: In above the map, use the toolbar options to control what's displayed on the heatmap. For details, see 2D Map Toolbar.

  • View Options Slide-in Pane: In the slide-in pane, use the view options to customize the heatmap display. For details, see 2D Map View Options.

  • Navigation Controls: From the bottom-right corner of the map, use the map navigation controls to manage the heatmap display. For details, see 2D Map Navigation Controls.


2D Map Toolbar

Item Description

Click 2D to view the wireless map in 2D or 3D to view it in 3D.

Wi-Fi Band Filter: Use this filter to view the heatmap for the 2.4 GHz and 5 GHz Wi-Fi bands.

Add/Edit

Click to enter add and edit mode which allows to do the following:

Data

Apply filters to the access point, sensor, and client data that appears in the wireless map. For details, see Filter Device Data on a Floor.

View Options

Click to open the View Options slide-in pane which contains the view options for the map, devices, and floor map elements.

Gear Icon: Hover your cursor over the icon for the following options:

  • Recompute: Recomputes the heatmap.

  • Export: Export the floor map to a PDF or CSV file format.

  • Edit Floor: Edit the floor details such as its name

  • Set Scale: Change the scale by doing the following:

    1. Click on a point and then on another point to specify a known measurement on the map.

    2. In the New line length (ft) field, enter the length of the measurement.

    3. Click OK.

      The floor map dimensions are recalculated based on the length of the measurement.

  • Measure Distance: Measure a distance on the floor map. Click on a point and then another point to specify the distance.

TBD

Full Hierarchy Path: Displays the full navigational path of the floor, including its associated building and site. Click the down arrow to navigate to a different floor.

Refresh Icon: Click to refresh the device and map data. To the left of the icon is the timestamp for the last refresh

Search: Use this search field to perform a search for specific floor map elements such as APs, sensors, clients, and so on.

2D Map View Options

To access the 2D map, click the menu icon () and choose Design > Network Hierarchy. From the left hierarchy tree, choose a floor, and in the map toolbar, click 2D > View Options.

The View Options slide-in pane opens. Expand the categories to view the settings:

  • Map: Contains various floor map and heatmap settings:

    Item Description

    Show Grid

    Click this toggle button to enable or disable a grid on the floor map. The grid provides the dimensions of the floor map.

    Map Opacity %

    Use this slider to customize the opacity or transparency of the floor map.

    Heatmap Type

    The heatmap provides a graphical representation of Radio Frequency (RF) wireless data where the values taken by a variable are represented in maps as colors. RSSI heatmaps are computed based on a floor's RSSI prediction model, antenna type, and its orientation.

    2D heatmaps use fixed transmit powers: 18 dB for 2.4-GHz; 15 dB for 5-GHz; and 5 dB for 6-GHz.

    3D heatmaps use real-time transmit power of operational APs and 11 dB for planned APs.

    Use the drop-down list to choose the heatmap type:

    • Operational RSSI: Coverage heatmap, which identifies the wireless signal strength of operational APs.

    • Planned Heatmap: Hypothetical heatmap that shows the coverage that planned access points would have on a floor.

    • Operational + Planned RSSI: (3D-only) Coverage heatmap created using both operational and planned APs. 2D maps only show operational AP coverage, so you need to switch to 3D maps to view this combined coverage heatmap.

    • Client Density: Density of associated clients.

    • IDS: Heatmap that shows the monitor mode access point coverage provided to the wireless clients on a floor map.

    RSSI Cut off (dBm)

    Use this slider to set the threshold for the RSSI value to appear on the heatmap. RSSI values that do not meet the threshold are faded.

    Heatmap Opacity %

    Use this slider to customize the opacity or transparency of the heatmap.

    Heatmap Color Scheme

    Customize the color scheme for the heatmap. Options are Legacy and Natural.

  • Access Points: Click this toggle button to enable or disable the AP icons on the floor map.

    Expand this category to configure the type of label to display with each AP. Valid label types are Name, AP MAC address, IP address, Bridge Group Names, and so on. From the Display Label drop-down list, choose a label type.

    To display other details about APs, see View a 2D Wireless Floor Map.

  • Planned Access Points: Click this toggle button to enable or disable the appearance of planned AP icons on the floor map.

    Expand this category to display labels with the planned AP name. From the Display Label drop-down list, choose a label type.

  • Switches and Switch Stacks: Click this toggle button to enable or disable the appearance of switch or switch stack icons on the floor map.

    Expand this category to display labels with the switch name, MAC address, or AP count. From the Display Label drop-down list, choose a label type.

    To display other details about switches, see View a 2D Wireless Floor Map.

  • Sensors: Click this toggle button to enable or disable the appearance of sensor icons on the floor map.

    Expand this category to display labels with the sensor name, MAC address, or AP count. From the Display Label drop-down list, choose a label type.

    To display other details about sensors, see View a 2D Wireless Floor Map.

  • Mesh: Click this toggle button to enable or disable the appearance of mesh APs on the floor map.

    Expand this category to configure options that control how the mesh AP-to-root AP link relationships are displayed:

    • Link Label: To disable link labels, click the None radio button. To display labels for link signal-to-noise ratios, click the Link SNR radio button. To display labels for packet error rates, click the Packet Error Rate radio button. The link label setting is reflected on the map immediately.

    • Link Color: To disable link color, click the None radio button. To display link signal-to-noise ratios in color, click the Link SNR radio button. To display packet error rates in color, click the Packet Error Rate radio button.

      The link color settings are reflected on the map immediately. See the following table for color definitions.

      Link Color Link Signal Noise Ratio (SNR) Packet Error Rate (PER)

      Represents an SNR above 25 dB (high value)

      Represents a PER of one percent (1%) or lower

      Represents an SNR between 20 dB and 25 dB (acceptable value)

      Represents a PER that is less than ten percent (10%) and greater than one percent (1%)

      Represents an SNR below 20 dB (low value)

      Represents a PER that is greater than ten percent (10%)

    • Mesh Parent-Child Hierarchical View: Choose which mesh APs to display. From this drop-down list, choose Select Only Root APs, Select up to 1st hops, Select up to 2nd hops, Select up to 3rd hops, or Select All.

  • Overlay Objects: Expand this category and click any of the overlay objects to enable or disable the overlay objects on the floor map.

  • Clients: Click this toggle button to enable or disable the appearance of client icons on the floor map.

    Expand this category to display labels with the client name, MAC address, or AP count. From the Display Label drop-down list, choose a label type.

    To enable or disable clients in close proximity to be grouped together, click the Show Client Clusters toggle button.

  • Interferers: Click this toggle button to enable or disable the appearance of client icons on the floor map.

    Expand this category to enable or disable the appearance of a zone of impact from interferers. Click the Show Zone of Impact toggle button.

  • Map Properties: Expand this category to specify the time interval between each auto refresh of map data. From the Auto Refresh drop-down lists, choose a time interval.

    Additional information is provided depending on the types of devices displayed on the map. For example, when mesh APs are selected to be displayed, the Map Properties category shows mesh SNR and PER color charts. You can configure the mesh SNR and PER value ranges and their corresponding colors.

  • Global Map Properties: Expand this category to change the preferred measurement system. From the Units of Measure drop-down list, choose either Feet (imperial system) or Meters (metric system).

    This setting applies to all wireless maps.

2D Map Navigation Controls

To access the 2D map, click the menu icon ( ) and choose Design > Network Hierarchy. From the left hierarchy tree, choose a floor, and in the map toolbar, click 2D.

The 2D map navigation controls are located at the bottom-right of the map. For details about the map, see View a 2D Wireless Floor Map.

Use the map navigation controls for the following functions:

Map Navigation Controls Description

Default map view

Default Map View: Click to reset the map view to the default.

zoom in and zoom out icons

Zoom In / Zoom Out: Click the zoom in and out icons to enlarge and reduce the size of the map. Alternatively, you can use your mouse wheel to zoom in and out.

Map legend icon

Map Legend: Click this icon to view the map legend which describes the map icons such as the device type, average health score, and AP status.

AP Icon Legend

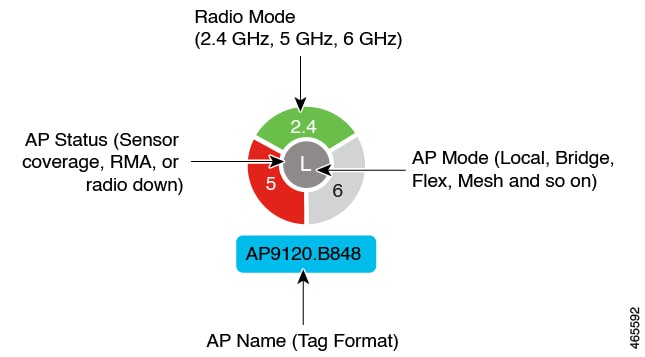
AP icons provide information about the configuration and health of the APs in your network. The circular AP icon is divided into radio bands that are color coded to show the radio status:

  • : Not Associated
  • : Unreachable
  • : Admin Disabled
  • : Down
  • : Ok
  • : Unknown

The following diagram shows all the elements of an AP icon:

Elements of AP icon in 2D wireless maps

Filter Device Data on a Floor

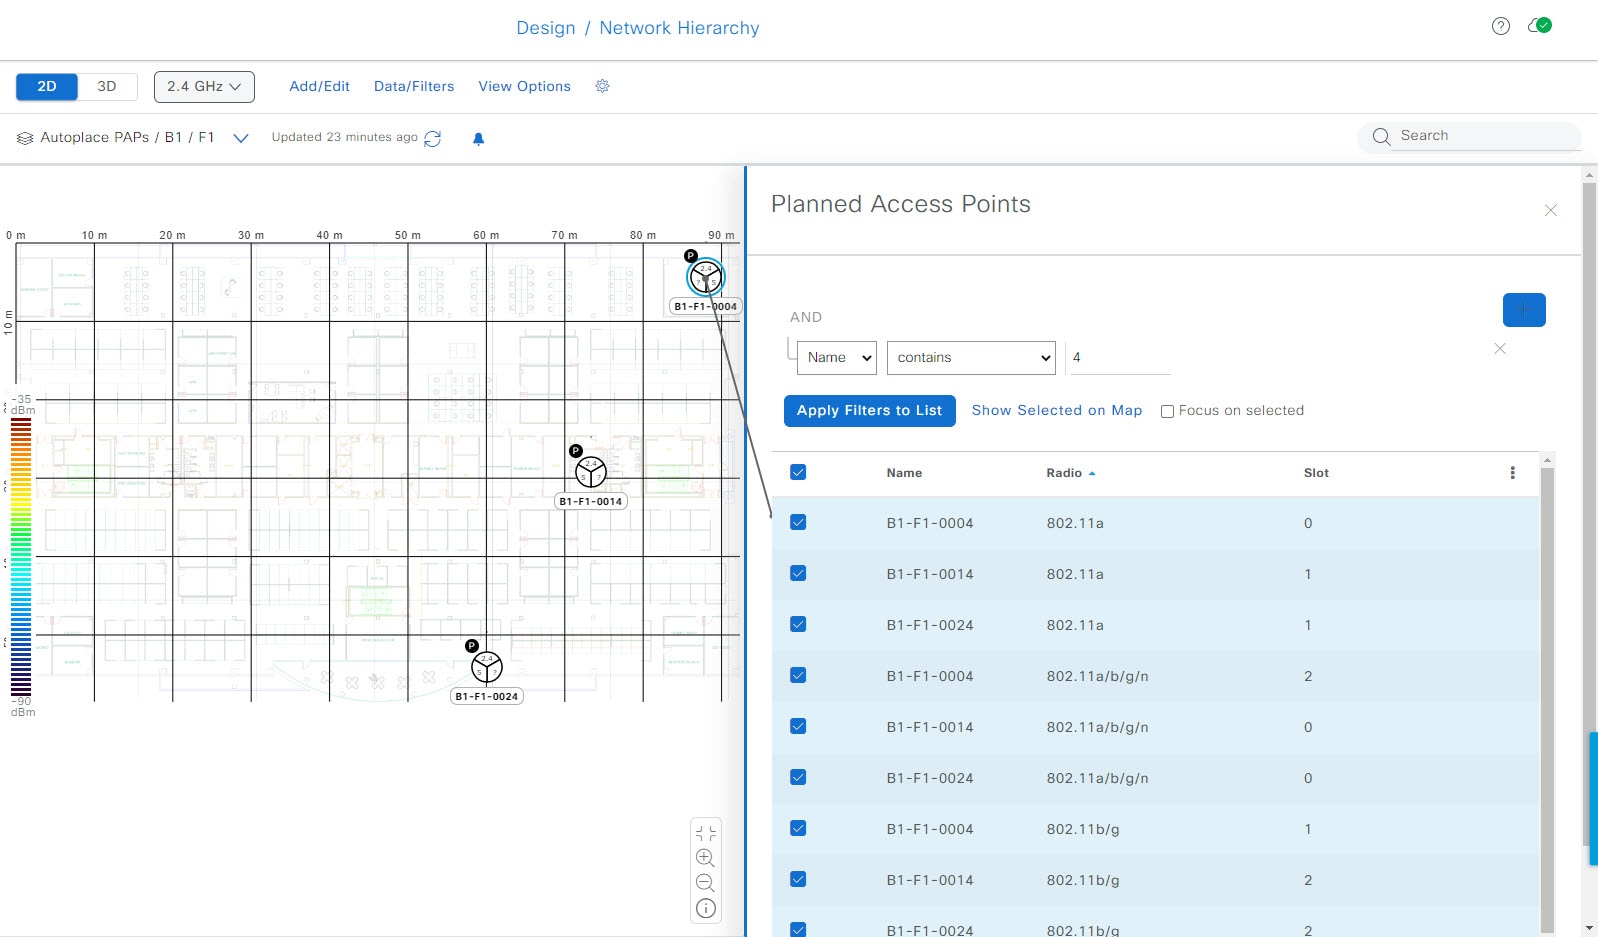
For 2D wireless maps, you can apply various filters to network devices such as access points, sensors, and so on. Based on the filter criteria, the search results appear in a table. Filtering device data is helpful in locating specific devices for floors with many devices.

Procedure


Step 1

Click the menu icon () and choose Design > Network Hierarchy.

Step 2

From the left hierarchy tree, choose a floor.

Step 3

In the map toolbar, click 2D.

Step 4

In the map toolbar, click Data/Filters.

Step 5

In the Data/Filters slide-in pane, click the device type that you want to apply a filter to.

Step 6

Define the filter rules by using the drop-down lists to choose the parameters.

Step 7

To add more filter rules, click the + icon near the top of the slide-in pane.

Step 8

When you’re done, you can do any of the following:

  • To display the results of your filter in the table in the Data/Filters slide-in pane, click Apply Filters to List.

  • To display the results of your filter in the map, click Show Selected on Map.

  • To locate the position of a device on the map, hover your cursor over the device in the table. A line is displayed from the device to its position on the map.

Figure 7. Locating a Device from the Filter Results
Locatin ga device from the filter results

Step 9

To close the slide-in pane and save the filter, click x.

Step 10

To remove applied filters, hover your cursor over the notifications icon and click Click to clear.


Identify Wireless Interferers on the Floor Map

This feature is a 2D map feature.

Cisco DNA Center can detect interference and disable the interference source for a specific band on a floor map. Any interference in the 2.4-GHz band disrupts the network traffic of the 802.11 wireless network.

Cisco DNA Center can identify the position, area of impact, and intensity of the interferer.

This procedure shows how to identify network interferers on a floor map.

Before you begin

Ensure that either Cisco Connected Mobile Experiences (CMX) or Cisco Spaces is integrated with Cisco DNA Center. For information, see About Cisco Spaces Integration.

Procedure


Step 1

Click the menu icon () and choose Design > Network Hierarchy.

Step 2

From the left hierarchy tree, choose a floor.

Step 3

In the map toolbar, click 2D.

Step 4

In the Network Hierarchy window, click View Options.

Step 5

In the View Options window, scroll down and click the Interferers toggle button to enable interferers to be displayed on the floor map.

Step 6

Expand the Interferers category and click the Show Zone of Impact toggle button to enable the zone of impact of interferers to appear on the floor map.

Note


By default, Zone of Impact is disabled.

Step 7

On the floor map, hover your cursor over the interferer icon and click the impacted channel to view the interferer device details.


Work with 3D Maps

3D maps are primarily used to plan and analyze a wireless network on a floor. As such, there are minimal configuration and edit functions that you can perform in 3D maps.

With 3D wireless maps, you can view a 3D representation of your wireless network. A near real-time predictive model dynamically updates the 3D map to show changes in RF coverage.

Prerequisite

The system you use to compute and display 3D wireless heatmaps must have a Graphical Processing Unit (GPU) installed and enabled on it. For example, if you're using a Windows virtual machine (VM), you need to make sure that it has a GPU.

3D Maps Features and Functionality

Here are some of the unique features and functionality that 3D wireless maps offers:

  • Navigate through your wireless network in a 3D environment with a first person view or third person view.

  • Gain insights into the areas in your wireless network where service-level agreements (SLAs) are not being met.

  • Run an optimizer tool to compute the best AP layout to meet your SLAs.

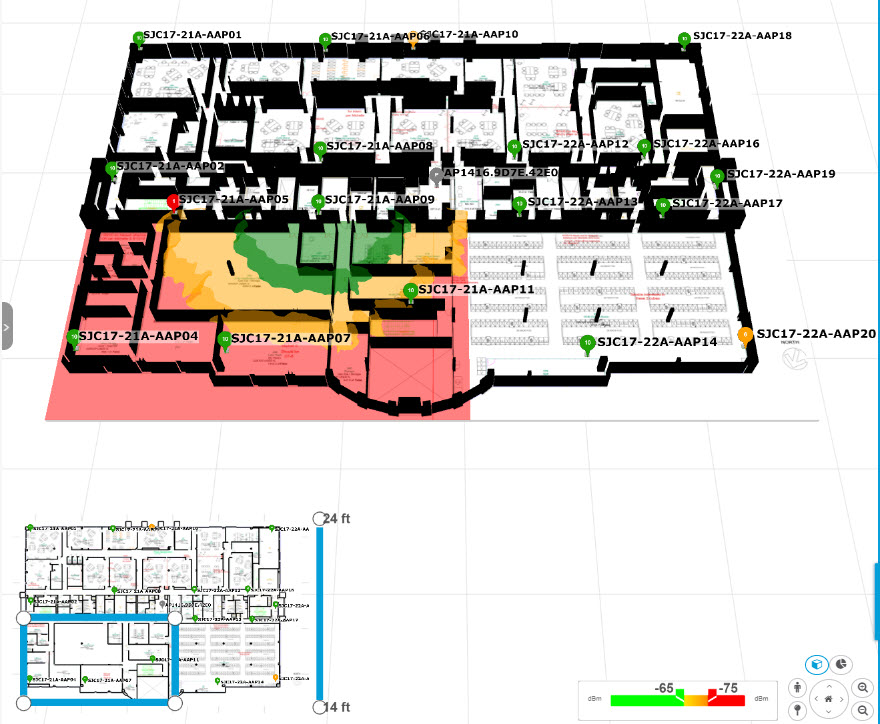
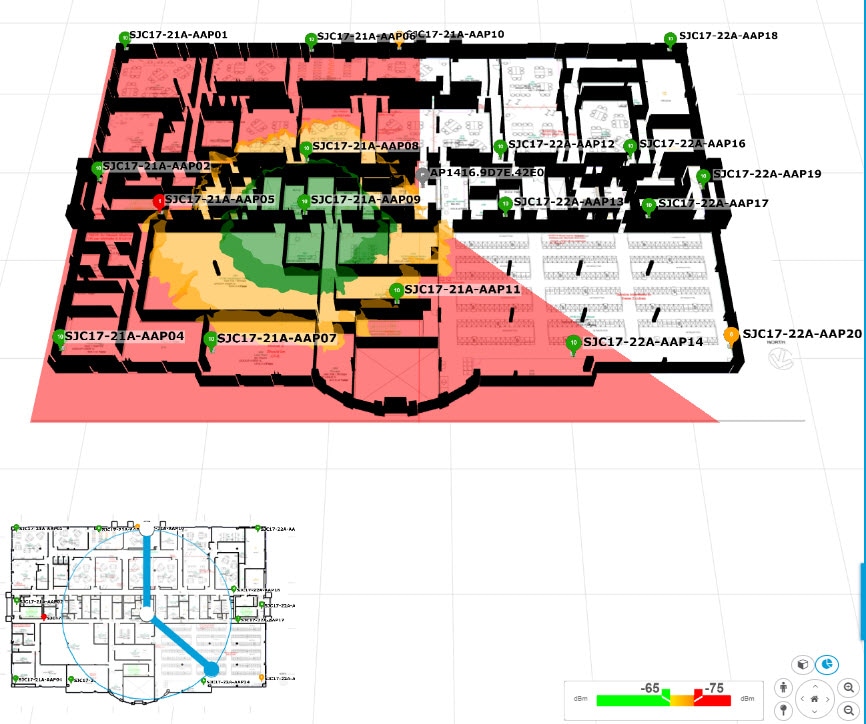
  • View the RF coverage for different elevations and use the Scanner tool to view the RF coverage for specific elevations.

  • Crop the Key Performance Indicator (KPI) heatmap with the clipping tools.

  • Predict the x, y, z coordinates of a specific point on the floor plan with the pin tool to better plan for placement of APs or sensors.

  • Visualize floor plan elements, such as walls, in 3D to see how they affect RF coverage and attenuation.

  • Simulate your wireless network in various configurations to see how the wireless coverage on a floor is affected. You can save these simulations and open them later to make more changes.

  • Modify KPIs, telemetry, and 3D map element settings to customize your map display.

Configure Floor Map Elements and Overlays in 3D Maps

In 3D maps, you are limited to the following configuration and edit functions:

To configure other floor map elements or overlays, you need to use the 2D map. For details, see 2D Floor Map Devices and Overlay Objects.

Clone an AP

You can duplicate an AP with its configuration by cloning it.

Before you begin

You must have actual APs to clone.

Procedure

Step 1

Click the menu icon () and choose Design > Network Hierarchy.

Step 2

From the left hierarchy tree, choose a floor.

Step 3

In the map toolbar, click 3D.

Step 4

In the map toolbar, click the simulation icon simulation icon.

Step 5

In the map toolbar, click Add/Edit.

Step 6

On the map, click an AP.

Step 7

In the AP Details slide-in pane, click Clone.

A duplicate AP is created and displayed below the original AP. Its name is appended with -1. If you keep cloning the same AP, the name continues to be incrementally appended. For example, the first clone for a-floor1-ap01 is named a-floor1-ap01-1, the second clone for the same AP is named a-floor1-ap01-2, and so on.

Step 8

On the map, right-click the cloned AP and choose Move.

Step 9

Drag and drop the AP to its new position.

Step 10

Click Save.


View a 3D Wireless Map

Use this procedure to view a 3D wireless map.

Procedure


Step 1

Click the menu icon () and choose Design > Network Hierarchy.

Step 2

From the left hierarchy tree, choose a floor.

Step 3

In the map toolbar, click 3D.

The 3D wireless map opens.

Note


A 3D heatmap is delimited by its coverage area, which is the full floor width and length, by default. To specify a polygon for the heatmap boundaries, edit the Coverage Area field value in the 2D map view. However, these boundaries don’t apply to the 2D map view because the full floor width and length are used for the 2D map view.

Step 4

To display specific details about devices, hover your cursor over the device icon. Information about the device is displayed in a dialog box.

Note


If the Assurance - Base package is installed, a link to the Device 360 window is also displayed in the dialog box.

Step 5

To view the heatmap for one or more APs, select and deselect the APs using one of the following methods:

  • To select a single AP, click the AP.

  • To select multiple APs, press the Shift key while clicking each AP, and then release the Shift key.

  • To deselect a single AP, click the AP.

    Note


    If no APs are selected, the heatmap includes all APs.

  • To deselect all APs, press the ESC key or double-click an area of the map that doesn't have any APs.

Step 6

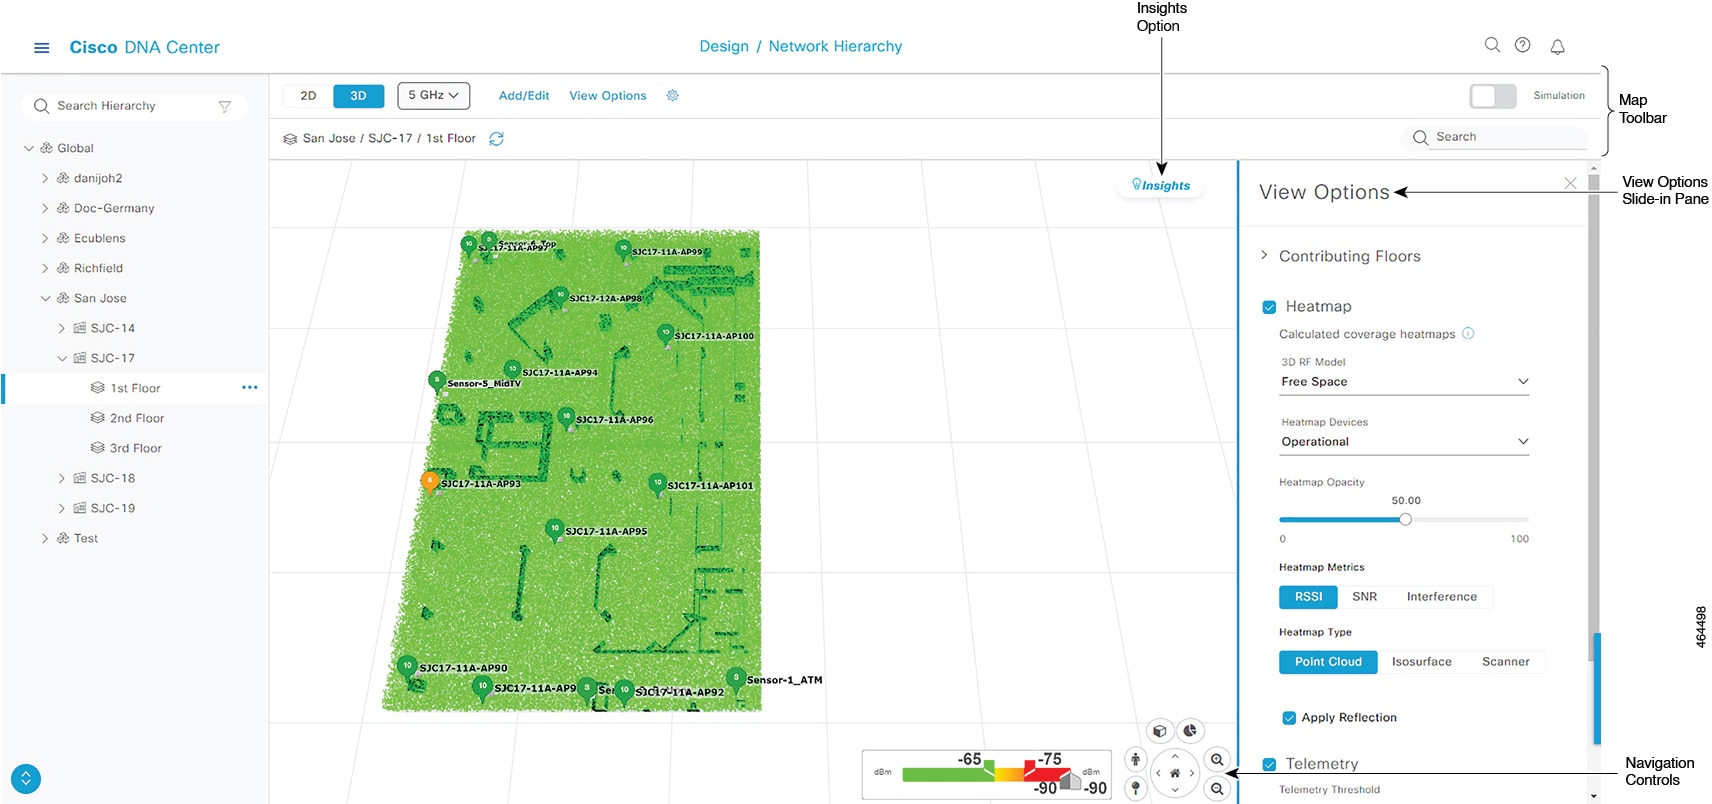
Use the tools and options shown in the following figure to gain insights about your wireless network.

Figure 8. 3D Wireless Map Showing Tools and Options
3D wireless map showing the tools and options
  • Toolbar: Above the map, use the toolbar options to control what's displayed on the heatmap. For details, see 3D Wireless Map Toolbar.

  • Insights: In the top-right corner of the map, click Insights to view and understand potential issues in your wireless network. For details, see Gain Insights from a 3D Wireless Map.

  • View Options: In the slide-in pane, use the view options to control the heatmap display. You can manipulate elements, such as which floors that are displayed, heatmap coverage and metrics, telemetry thresholds, devices and clients, overlay objects, and the depiction of a floor and sky. For details, see 3D Map View Options

  • Navigation Controls: In the bottom-right corner of the map, use the map navigation controls to view the heatmap from various perspectives. For details, see 3D Map Navigation Controls.


3D Wireless Map Toolbar

To access the 3D map, click the menu icon ( ) and choose Design > Network Hierarchy. From the left hierarchy tree, choose a floor, and in the map toolbar, click 3D.

The map toolbar consists of two bars and is located above the map. Use the map toolbar for the following actions and settings:

Item Description

Click 3D to view the wireless map in 3D or click 2D to view it in 2D.

Click the Wi-Fi band down arrow and choose a Wi-Fi band.

Add/Edit

Click Add/Edit to add planned APs by cloning the existing APs or planned APs. For details, see Clone an AP.

Note


The option to add operational APs from the inventory is not available in 3D. To add operational APs, click Add/Edit in the 2D map toolbar.

View Options

Open the 3D Floormap slide-in pane to display the contributing floors, KPIs, telemetry, device and client information, and floor element settings. For details, see 3D Map View Options.

Gear icon

Hover your cursor over the gear icon and click Insights Configuration to customize the conditions for insights. For details, see Gain Insights from a 3D Wireless Map.

Simulation

Click the Simulation toggle button to view the map in simulation mode. The default view is operation mode. For details, see Create Simulations for 3D Wireless Maps.

Note


Simulation mode is available only in 3D maps, not in 2D maps.

Full hierarchy path in map toolbar

Full Hierarchy Path: Displays the full navigational path of the floor, including its associated building and site. Click the down arrow to navigate to a different floor.

Refresh icon

Click the refresh icon to update the device and map data. To the left of the icon is the timestamp for the last refresh.

Search field

Use the Search field to find specific floor map elements such as APs, sensors, clients, and so on. The results of your search are listed below the Search field.

When you hover your cursor over an element in the list, an indicator points to the element on the map. If the element is outside the field of view, the indicator is displayed as a broken red line. Reorient the map to see the element.

3D Map View Options

To access the 3D map, click the menu icon ( ) and choose Design > Network Hierarchy. From the left hierarchy tree, choose a floor, and in the map toolbar, click 3D > View Options.

The View Options slide-in pane opens. Expand the categories to view the settings:

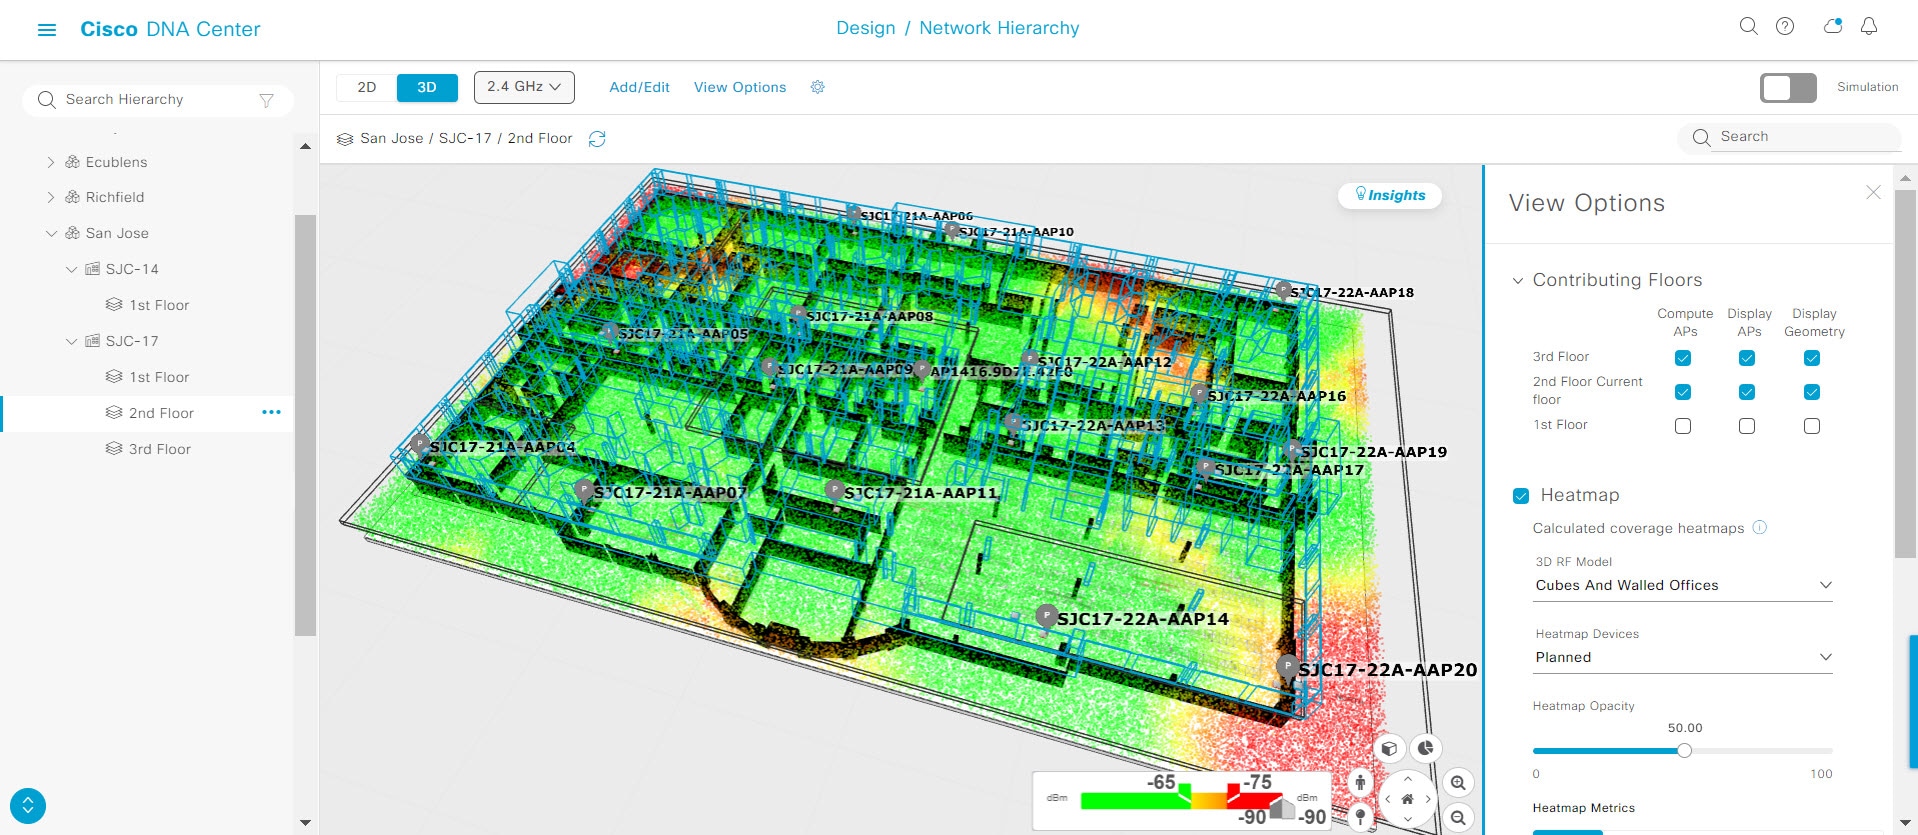
  • Contributing Floors: Expand this option to include more floors in the heatmap computation. When including a floor, you can choose to add its APs in the heatmap computation and display its APs and floor geometry. Click Apply to generate the heatmap with your settings.

    Figure 9. 3D Map of Multiple Floors
    3D map of multiple floors
    Item Description

    Compute APs

    Check this check box to include a floor's APs when computing the heatmap.

    Display APs

    Check this check box to display a floor's APs in the heatmap.

    Display Geometry

    Check this check box to display a floor's physical attributes in the heatmap.

  • Heatmap: Check this check box to display the heatmap and to configure the settings in the following table:

    Item Description

    3D RF Model

    Use this drop-down list to choose the RF model.

    The RF model determines how RF is calculated based on the floor geometry. Available models include drywall offices, cubes and walled offices, free space, outdoor open space, and indoor high ceiling.

    Note


    We recommend that you choose Free Space if you manually placed the walls or imported them from a CAD file or Ekahau project. If you didn't manually place the walls, use an RF model other than Free Space.

    Heatmap Devices

    Use this drop-down list to choose whether to display operational devices, operational and planned devices, or only planned devices on the heatmap.

    Heatmap Opacity

    Use this slider to customize the opacity or transparency of the heatmap.

    Heatmap Metrics

    Choose the type of metrics to display on the heatmap:

    • RSSI: Displays the Received Signal Strength Indicator (RSSI) values.

    • SNR: Displays the signal-to-noise ratio (SNR) values.

    • Interference: Displays the SNR that is caused by co-channel interference (CCI) or adjacent channel interference.

    • Leakage: Displays signal leakage between floors. For this option to be available, you must compute the heatmap with two or more contributing floors.

    Heatmap Type

    Choose the heatmap type:

    • Point Cloud: Provides a collection of data points in space. Each data point has x, y, and z coordinates.

    • Isosurface: Represents the RSSI with isolines or lines of a contiguous value.

    • Scanner: Displays the RSSI for a specific elevation.

    Apply Reflection

    Check this check box to show signal reflection, which can be caused when a signal bounces off materials such as glass, whiteboards, and plastic.

    Telemetry

    Use this toggle button to enable or disable telemetry.

    When telemetry is enabled, click a sensor or AP to view its telemetry:

    • The telemetry for a sensor displays the predicted and measured RSSI values between a sensor AP and other APs.

    • The telemetry for an AP displays the predicted and measured RSSI values between neighbor APs.

  • Telemetry: Check this check box and use the Telemetry Threshold slider to set the threshold for telemetry sources to be displayed on the heatmap.

    Telemetry sources with predicted values that do not meet the threshold are faded.

  • Devices and Clients: Click this option to configure the settings in the following table:

    Item Description

    APs

    Check this check box to display APs on the map.

    Planned APs

    Check this check box to display planned APs on the map.

    Sensors

    Check this check box to display sensors on the map.

    Clients

    Check this check box to display clients on the map. Additionally, you can do the following:

    • Display clients in their default blue color (None) or by their RSSI, SNR, or Health Score. For RSSI, SNR, and Health Score, clients are colored blue, yellow, or red, depending on their current condition.

    • Use the slider to change the size of the ball that represents a client on the map.

  • Overlay Objects: Click this option to configure the settings in the following table:

    Item Description

    Geometry

    Check this check box to display the floor geometry.

    Height

    Use this slider to set the height of walls on the heatmap.

  • Map: Click this option to configure the settings in the following table:

    Item Description

    Sky

    Check this check box to display the sky in the heatmap.

    Floor

    Check this check box to display the floor in the heatmap.

3D Map Navigation Controls

To access the 2D map, click the menu icon () and choose Design > Network Hierarchy. From the left hierarchy tree, choose a floor, and in the map toolbar, click 3D.

The 3D map navigation controls are located at the bottom-right corner of the map. For details about the map, see View a 3D Wireless Map.

Use the map navigation controls at the bottom-right corner of the map to control the map view.

Map Navigation Control Description

Clip box icon

Use clip box: Click this icon to crop the heatmap using a box shape. Use the clipper at the bottom-left corner of the map to specify the crop:

  • Click and drag one of the anchor points to change the size of the crop.

  • Click and drag one of the anchor points on the right vertical slider to specify the height range of the crop.

Figure 10. Clip Box
Clip box in a 3D map

Clip plane icon

Use clip planes: Click this icon to crop the heatmap using a donut shape. Use the clipper at the bottom-left corner of the map to specify the crop:

  • Click and drag the anchor point in the center of the donut to reposition the donut.

  • Click and drag the two outer anchor points to change the shape of the crop.

Figure 11. Clip Planes in Use
Clip plane in use

First person view icon

First Person View: Click this icon to switch between first-person view and third-person view.

The blue sphere indicates your position on the map. As you move throughout the map, your field of view changes. You can use the mini map at the lower-left corner to get an idea of your field of view and orientation.

Note


If you have more than one floor selected for display, the First Person View automatically positions you on the current floor.

For details, such as the controls for view, see Use First-Person and Third-Person Views for 3D Wireless Maps.

Third person view icon

Third Person View: Click this icon to switch between first person view and third person view. You can also drag and drop the icon on the map where you want to be positioned.

The blue sphere indicates your position on the map. As you move throughout the map, your field of view changes. You can use the mini map at the lower-left corner to get an idea of your field of view and orientation.

For details, such as the controls for view, see Use First-Person and Third-Person Views for 3D Wireless Maps.

Place a pin icon

Place a pin: Click this icon to view a predicted measurement (x, y, and z coordinates) of a specific point on the floor map. By placing a pin, you can view the measurements of the distance from the pin to the end of the yard stick. As you zoom in or zoom out, the position of the measurements is adjusted to stay in your view. Drag and drop the pin to change its position, as follows:

  • To move the pin horizontally: Click the horizontal arrows and drag the pin left, right, forward, or backward. The selected arrows and yard stick are highlighted while active.

  • To move the pin vertically: Click the vertical arrows and drag the pin up or down. The selected arrows and yard stick are highlighted while active.

For a video demonstration, click here.

Figure 12. Adjusting a Pin
Adjusting a pin on a 3D map

Zoom in icon

Zoom In: Click this icon to enlarge the view. Alternatively, you can use your mouse wheel to zoom in.

Zoom out icon

Zoom Out: Click this icon to reduce the size of the image and to increase your field of view. Alternatively, you can use the scroll wheel on your mouse to zoom out.

Map rotation and default map view

Map Rotation and Default Map View: Click the directional arrows to change the camera angle.

Click the Return Home icon to reset the map to the default view.

Use First-Person and Third-Person Views for 3D Wireless Maps

You can use the first-person and third-person views to gain different perspectives of your wireless network.

Procedure


Step 1

Click the menu icon () and choose Design > Network Hierarchy.

Step 2

From the left hierarchy tree, choose a floor.

Step 3

In the map toolbar, click 3D.

Step 4

To use the first-person view, click the first-person view icon in the map navigation controls. Optionally, you can drag and drop the person icon to a specific location on the map.

The map view changes to the first-person view.

Figure 13. First-Person View

First-person view of a 3D map

Step 5

You can control the first-person view by doing the following:

Action Controls

Move forward/backward and right/left.

Use the W, A, S, and D keys or arrow keys.

Change the camera angle.

Click and hold the left mouse button on the map and move the mouse wheel.

Raise the altitude of the camera angle.

Hold the Spacebar.

Lower the altitude of the camera angle.

Hold Shift + Spacebar.

Step 6

To use the third-person view, click the third-person view icon Third-person view icon from the map navigation controls.

The map view changes to the third-person view.

Figure 14. Third-Person View
Third-person view

Step 7

You can control the third-person view by doing the following:

Action Controls

Move forward/backward and right/left.

Use the W, A, S, and D keys or arrow keys.

Change the camera angle.

Click and drag on the map.

Raise the altitude of the camera angle.

Hold the Spacebar.

Lower the altitude of the camera angle.

Hold Shift + Spacebar.

Step 8

To return to the default view, click the return home icon Return home icon.


Display Details About APs and Clients

If you have a location service, such as Cisco Spaces or Cisco Connected Mobile Experiences (CMX), installed on Cisco DNA Centeryou can view the locations of clients on a floor. Clients are identified as a small blue ball ( ) on the map.

SUMMARY STEPS

  1. Click the menu icon and choose Design > Network Hierarchy.
  2. From the left hierarchy tree, choose a floor.
  3. From the map toolbar, click 3D.
  4. To display details about an AP, click it.
  5. To display information about a client, hover your cursor over the ball (client).
  6. To display the client in a color that corresponds to its RSSI, SNR, or health score, do the following:
  7. To resize the ball, use the Ball Size slider in the View Options pane. This feature helps you view clients in cases where there are many clients or only a few. For example, in cases where there are many clients, you may want to make the ball smaller, and in cases where there are only a few clients, you may want to make the ball larger.

DETAILED STEPS


Step 1

Click the menu icon and choose Design > Network Hierarchy.

Step 2

From the left hierarchy tree, choose a floor.

Step 3

From the map toolbar, click 3D.

Note


A 3D heatmap is delimited by its coverage area, which is the full floor width and length, by default. To specify a polygon for the heatmap boundaries, you need to edit the Coverage Area field value in the 2D map view. However, these boundaries do not apply to the 2D map view, as the full floor width and length is used for the 2D map view.

Step 4

To display details about an AP, click it.

Step 5

To display information about a client, hover your cursor over the ball (client).

A line is drawn between the client and its associated AP. A dialog box is displayed with information, such as the client's IPv4 address, IPv6 IP address, RSSI value, and so on. To open the Client 360 page, click the Client 360 link in the dialog box.

Step 6

To display the client in a color that corresponds to its RSSI, SNR, or health score, do the following:

  1. Click View Options > Devices and Clients.

  2. Click the Clients check box.

  3. Under the Clients check box, click None (default blue color), RSSI, SNR, or Health Score.

Step 7

To resize the ball, use the Ball Size slider in the View Options pane. This feature helps you view clients in cases where there are many clients or only a few. For example, in cases where there are many clients, you may want to make the ball smaller, and in cases where there are only a few clients, you may want to make the ball larger.


Gain Insights from a 3D Wireless Map

Cisco DNA Center actively monitors the network performance of 3D wireless maps and provides insights into areas where service-level agreements (SLA) are not being met.

Procedure


Step 1

Click the menu icon () and choose Design > Network Hierarchy.

Step 2

From the left hierarchy tree, choose a floor.

Step 3

In the map toolbar, click 3D.

Step 4

At the top-right corner of the map, click Insights.

The Insights area opens and displays information about the coverage areas that don't meet a specific KPI threshold, for example, RSSI is > -70 dBm.

Figure 15. Insights Area
Insights area on a 3D map

Step 5

In the Insights area, you can do any of the following actions:

Item Details

View coverage gaps

Click this link to display the wireless coverage area. Red areas show where the SLA is not being met. Green areas show where it’s being met.

Optimizer

Click this link to have Cisco DNA Center analyze the wireless coverage area. You can indicate the maximum number of APs that you are willing to move and add, and Cisco DNA Center computes a configuration where the wireless coverage is maximized.

For more information, see Run the Wireless Coverage Optimizer.

Mute This Insight

Click this button to exclude an insight from displaying in the Insights dialog box.

Muted insights appear at the bottom of the list in the All Insights slide-in pane.

View All Insights

Click this button to display all active and muted insights.

For each insight, you can click Mute or Unmute to exclude or include its display in the Insights dialog box.

Click Edit Configuration to customize the insight KPI settings.

Another way to customize insight KPI settings is from the map toolbar. Hover your cursor over the gear icon Gear icon in the map toolbar and choose Insights Configurations.


Run the Wireless Coverage Optimizer

For wireless areas that aren't meeting their SLA, the optimizer takes your input of the maximum number of APs that you are prepared to move and add, and computes a configuration where the wireless coverage is maximized.

This procedure shows you how to run the wireless coverage optimizer.

Procedure


Step 1

Click the menu icon () and choose Design > Network Hierarchy.

Step 2

From the left hierarchy tree, choose a floor.

Step 3

In the map toolbar, click 3D.

Step 4

At the top-right corner of the map, click Insights.

The Insights area opens and displays information about the coverage areas that don't meet a specific KPI threshold, for example, RSSI is > -70 dBm.

Step 5

(Optional) To display the wireless coverage area, click View.

Red areas show where the SLA is not being met. Green areas show where the SLA is being met.

Step 6

(Optional) If there are specific APs that you don't want the optimizer to move, you can right-click them and choose Lock to lock their position. To remove the lock, right-click the AP and choose Unlock.

Step 7

Click Optimizer.

Step 8

In the Coverage Optimizer dialog box, enter the maximum number of APs that you are prepared to move and add.

If you don't want to move or add APs, leave the corresponding field blank or enter 0.

Step 9

Click Run Optimizer.

If needed, you can manually move any of the APs to other locations.

Step 10

When the analysis is complete, click View Results.

Cisco DNA Center displays a proposed layout that increases the wireless coverage to maximize the SLA. If the optimizer recommends moving an AP, the new layout displays a blue line to the recommended new location. Any new APs that have been added to the layout are displayed as blue markers ( ).

Step 11

To save the new layout as a simulation, click Save as a plan. To exit without saving, click the x at the top-right corner of the map.

Later, if you implement the recommended changes to your physical wireless network, you can save the simulation as an operational map. For information, see Create Simulations for 3D Wireless Maps.


Create Simulations for 3D Wireless Maps

You can create simulations for 3D wireless maps.


Note


Simulation mode is available only in 3D maps, not in 2D maps.


Simulations allow you to change device configurations without actually implementing them. You can create multiple simulations and load them at any time.

Procedure


Step 1

Click the menu icon () and choose Design > Network Hierarchy.

Step 2

From the left hierarchy tree, choose a floor.

Step 3

In the map toolbar, click 3D.

Step 4

In the map toolbar, click the Simulation toggle button.

The 3D wireless map enters the simulation mode, which is indicated by the color of the lower map toolbar changing to light blue.

Step 5

In the map toolbar, click Add/Edit.

In the simulation mode, only particular attributes are editable for previewing the impact of changes on the heatmap.

Step 6

Make the changes to the devices, as needed:

  • APs: You can change the model, channel, and transmission power.

  • PAPs: You can change the channel and transmission power.

  1. Click Apply.

Step 7

In the map toolbar, hover your cursor over the vertical ellipsis and choose Save changes as.

Figure 16. Saving as a Simulation
Saving as a simulation

Note


Choosing Save changes saves your changes to the Operation mode.

Choosing Commit saves your changes to the production devices.

Step 8

In the Save Simulation dialog box, enter a name for the simulation and click Save.

Step 9

To load a simulation, click the Simulation toggle button and, from the Select Simulation drop-down list, choose a simulation. If you have no saved simulations, None available is displayed.