Work with Floor Maps
There are several reasons to add floors with floor maps. One reason is to see your wireless network the way it exists today. Another reason is to help you plan and visualize future changes.
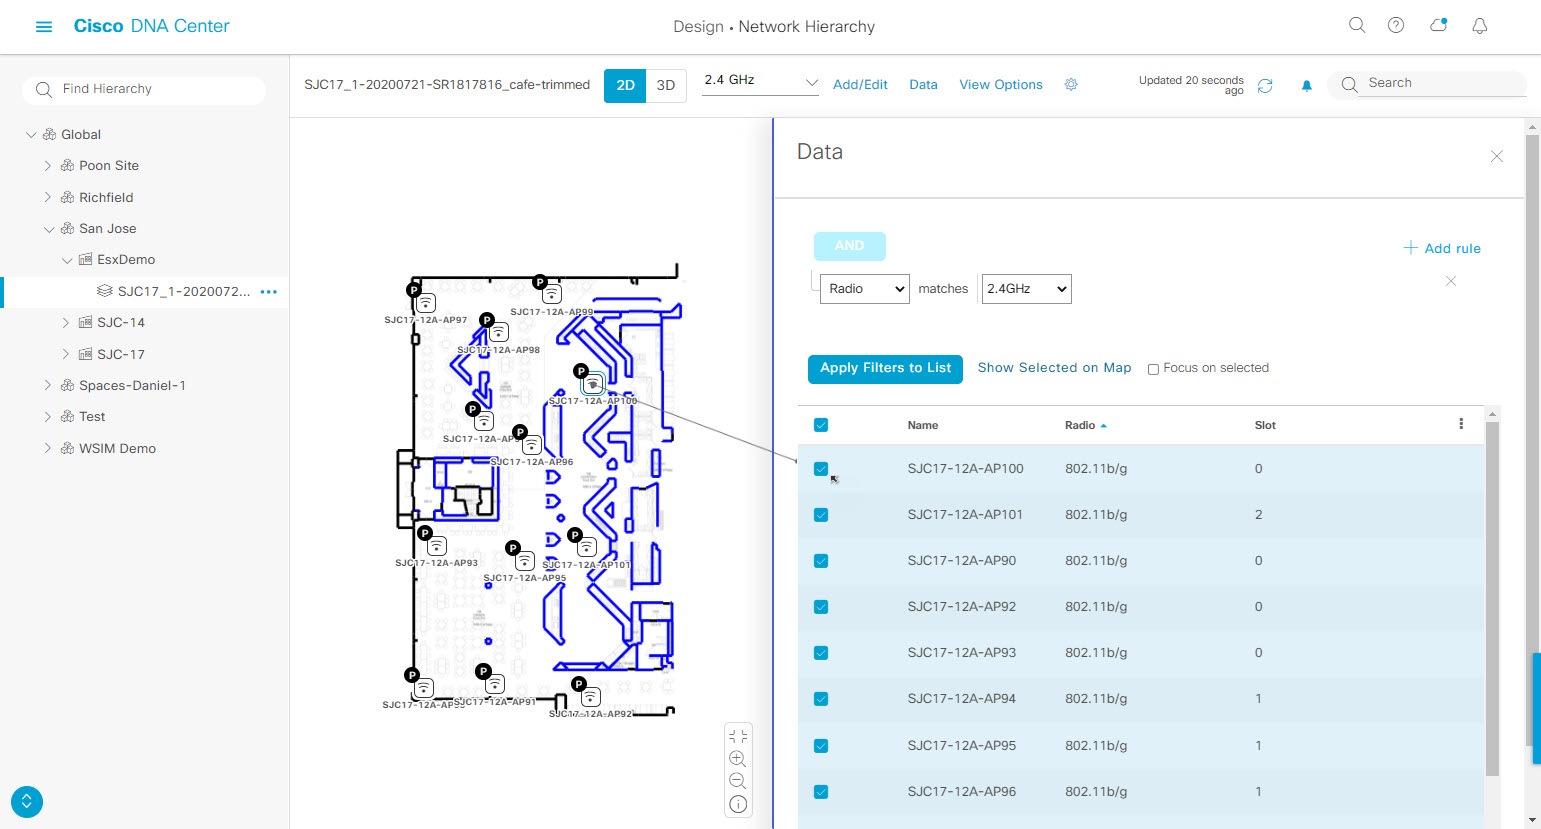
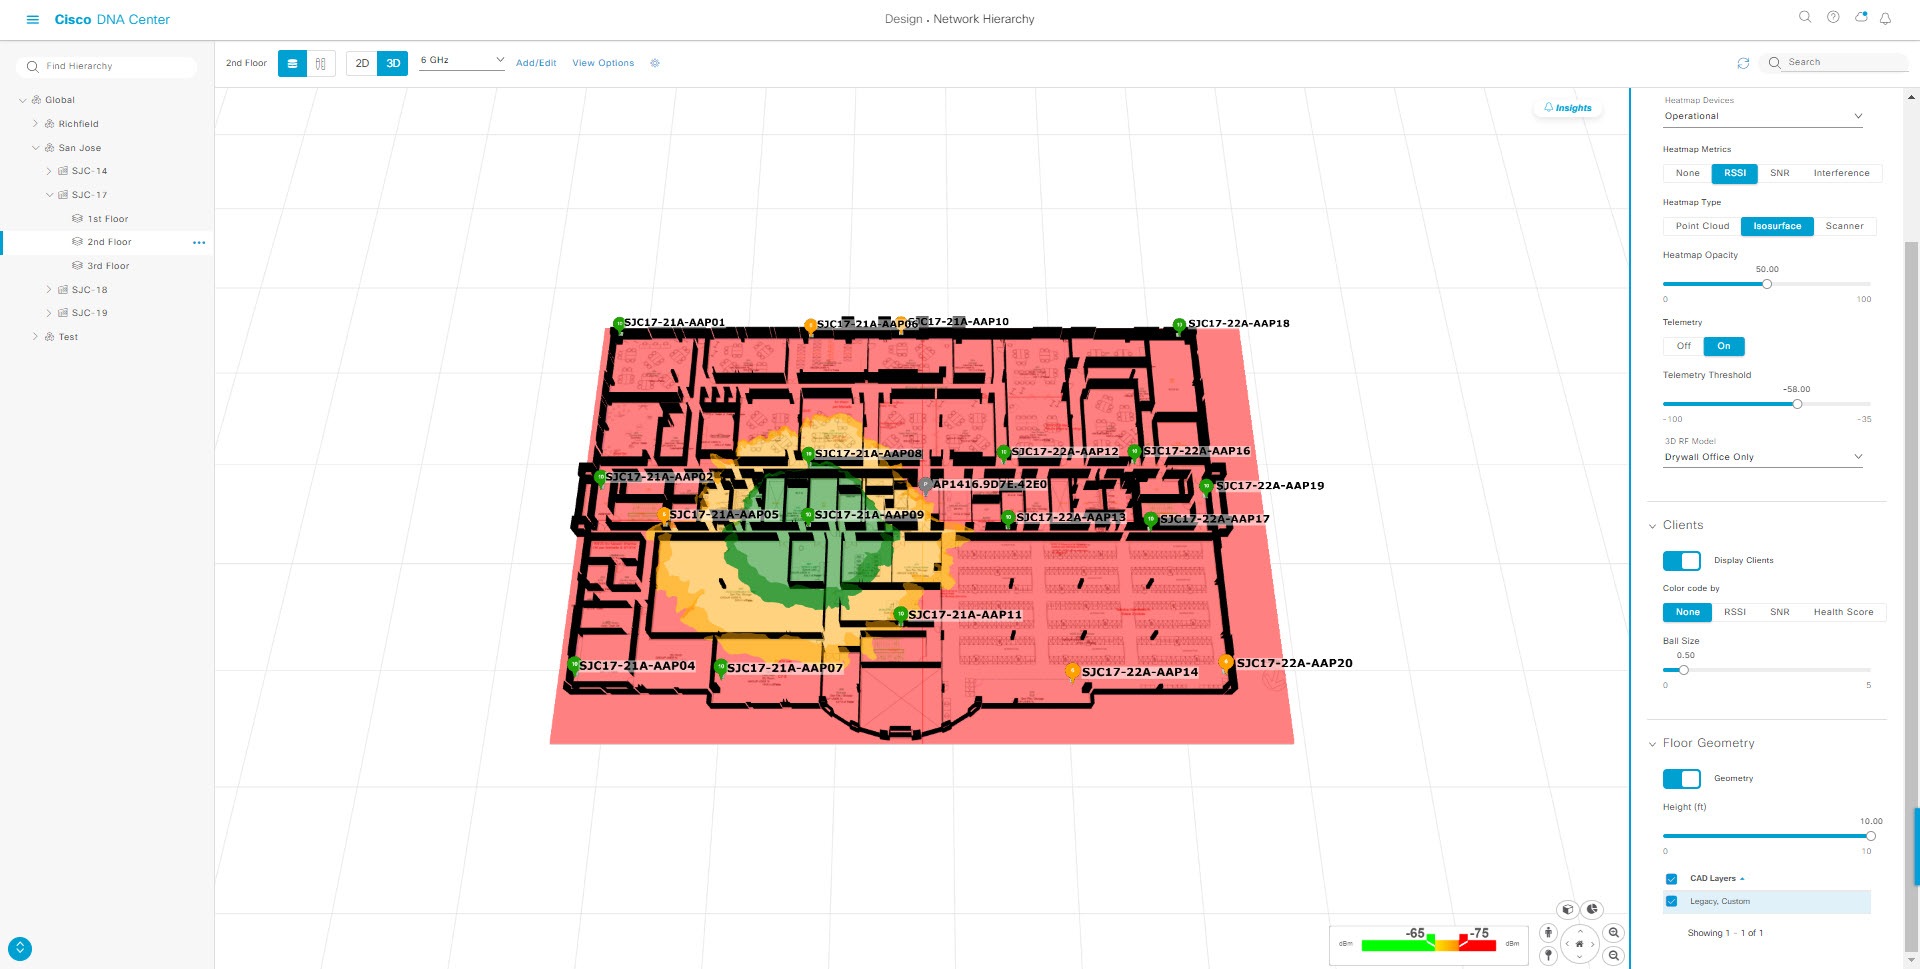
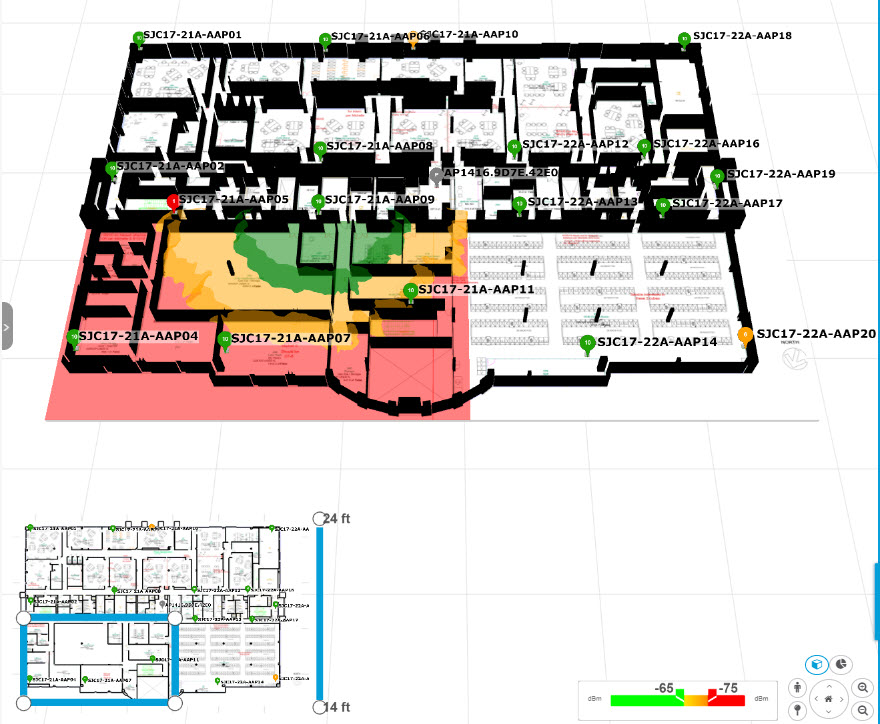
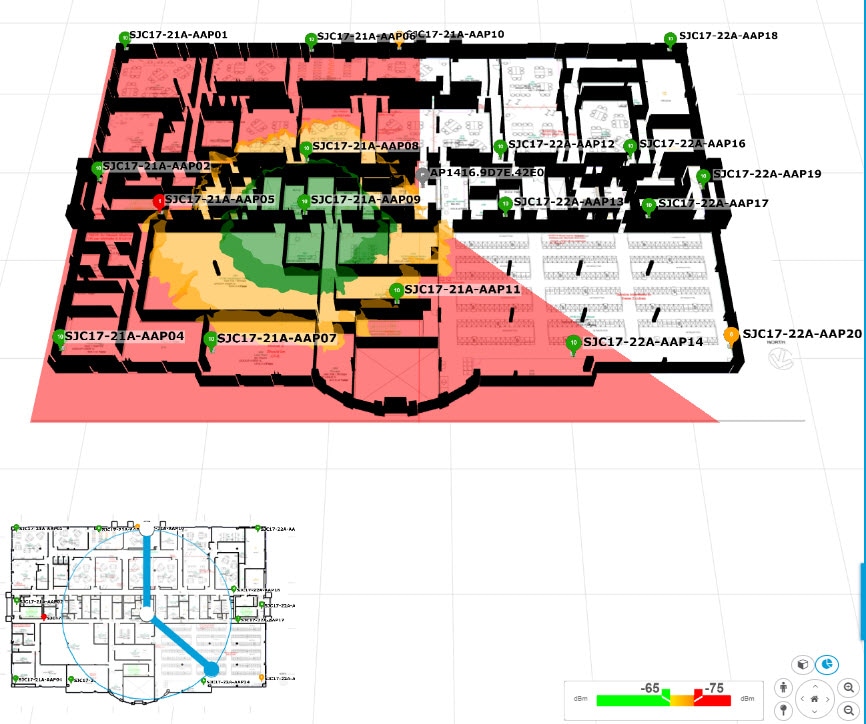
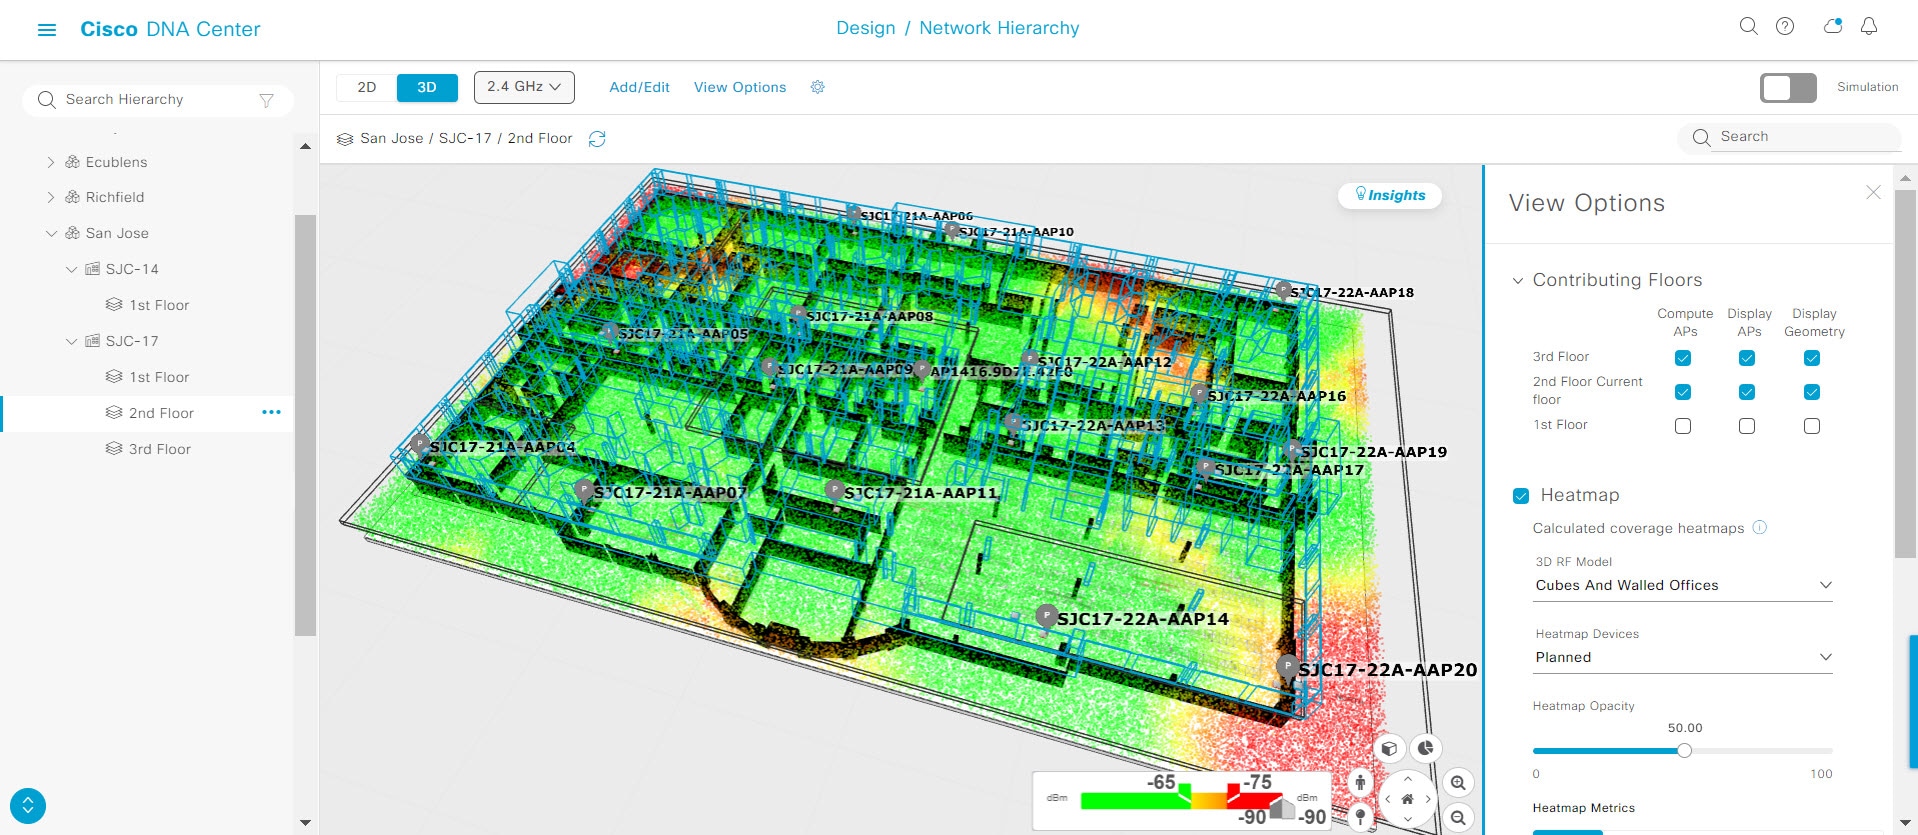
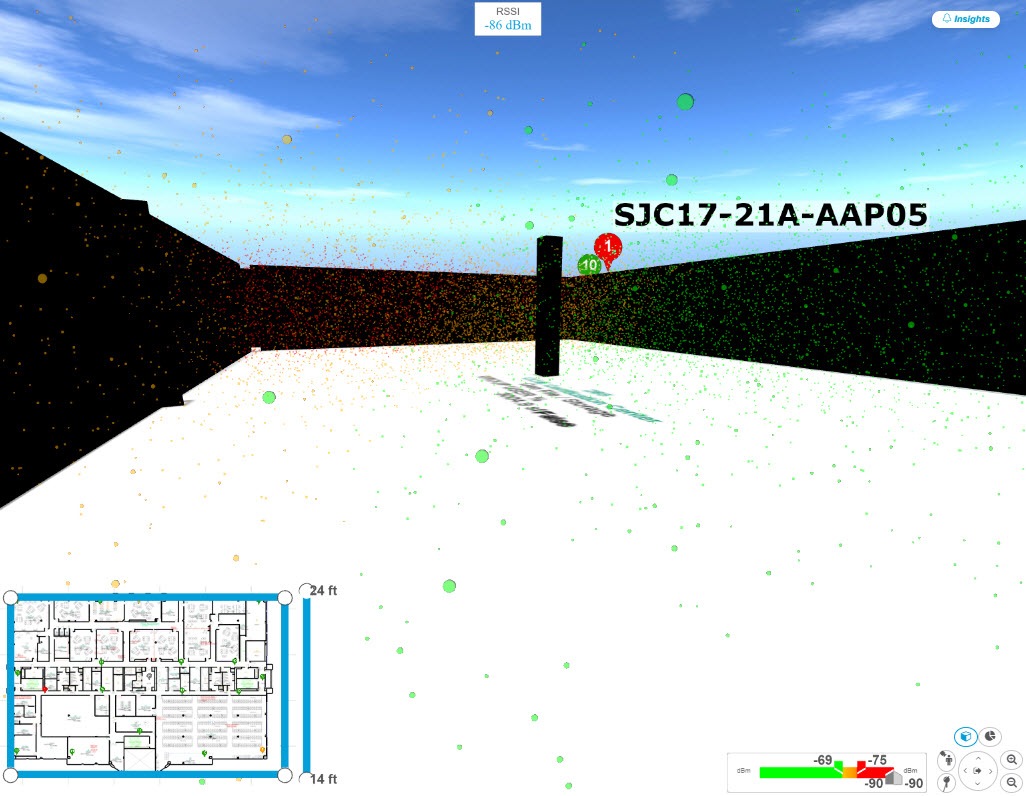
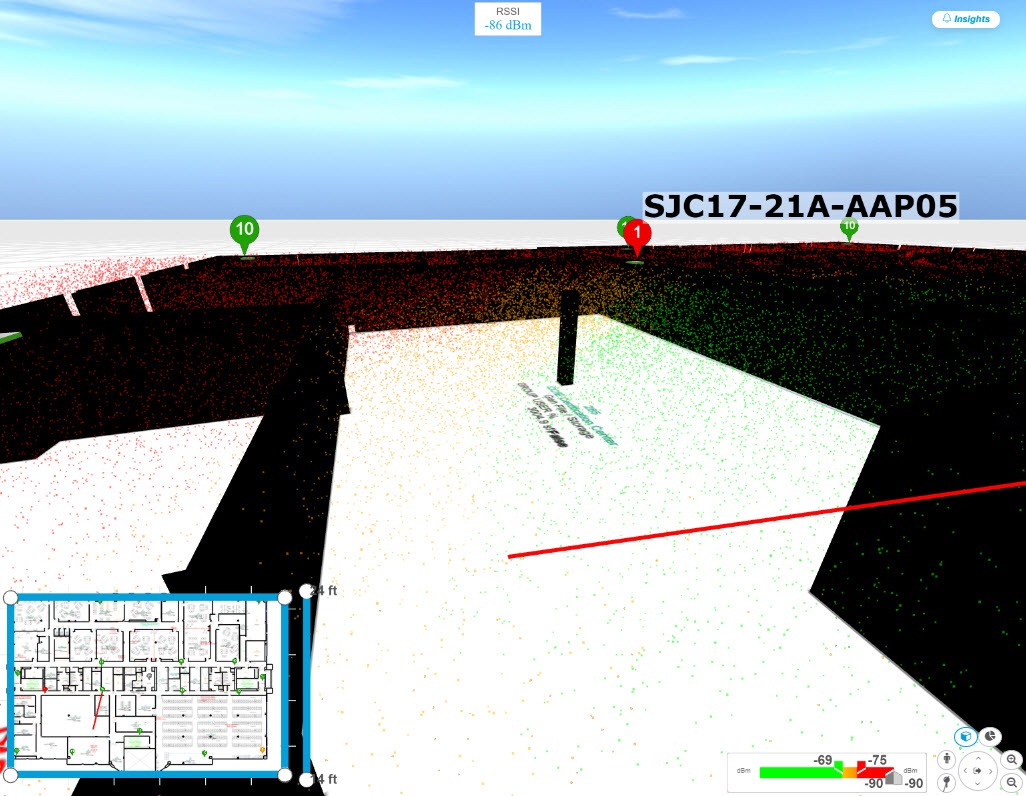
You can visualize your wireless network by creating or importing a floor map that contains various building components, like walls and windows, and then positioning your wireless devices on it. Using the floorplan, Cisco DNA Center computes 2D and 3D heatmaps that show the relative intensity of the RF signals in the coverage area. For 2D wireless maps, the heatmap is only an approximation of the actual RF signal intensity because it does not consider the attenuation of various building materials, such as drywall or metal objects, nor does it display the effects of RF signals bouncing off obstructions. In either case, we recommend that you import a file with an existing floor plan to get started.
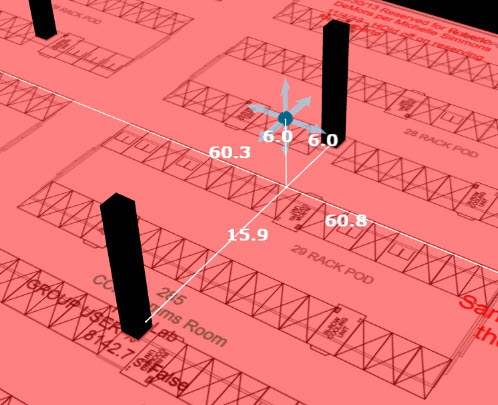
Interactive planning helps you plan a floor layout by drawing planned, or hypothetical, APs and obstacles with a raster image or a CAD floor plan as the backdrop. You can export the floor map as a PDF and share it with the technicians who are mounting the APs. The floor drawing helps the technicians to visualize the floor layout and the exact AP mount locations.
With interactive floor planning, you can:
-
Create a floor layout with a raster or CAD floor plan as the canvas.
-
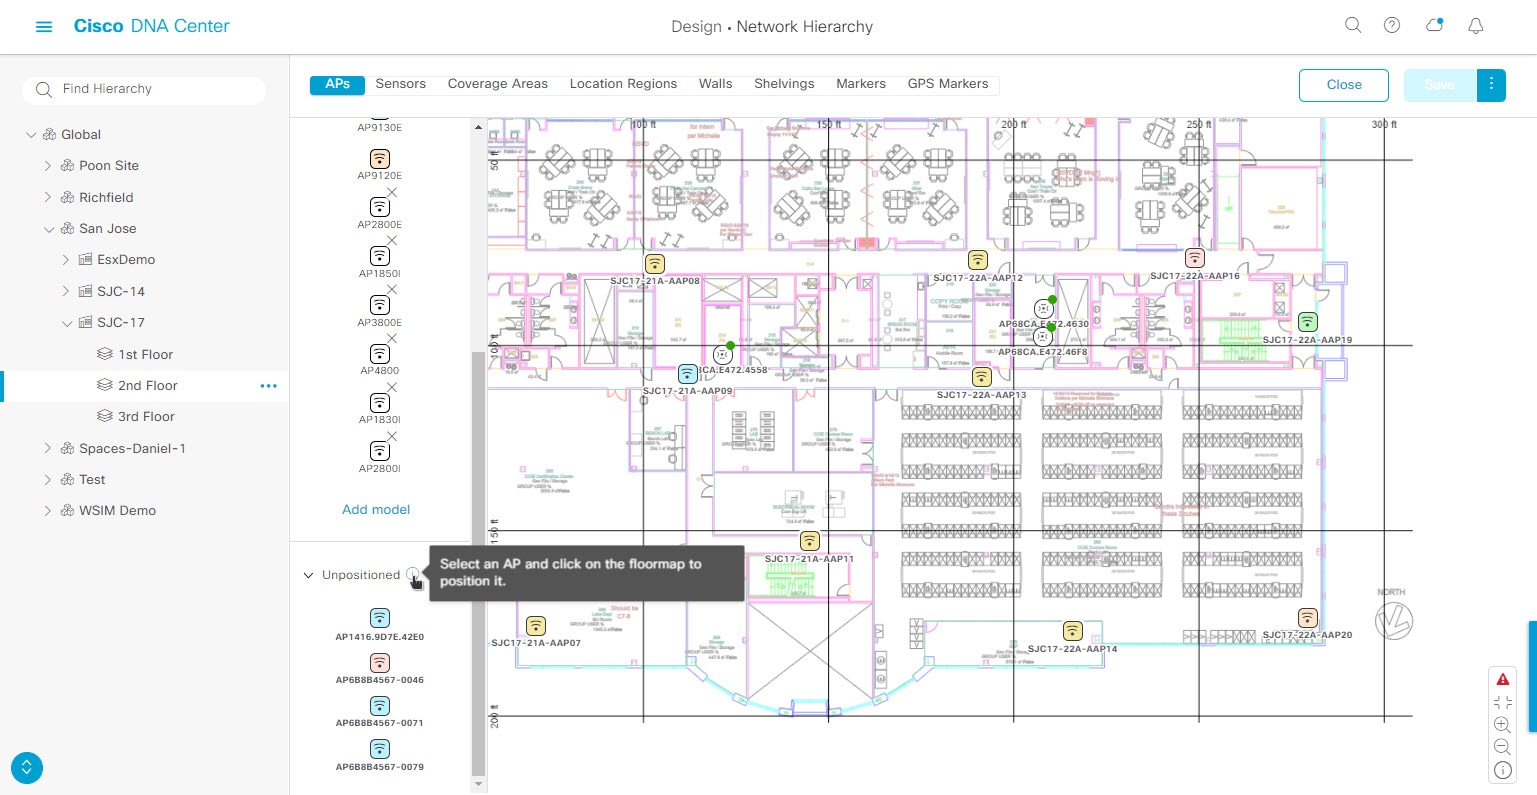
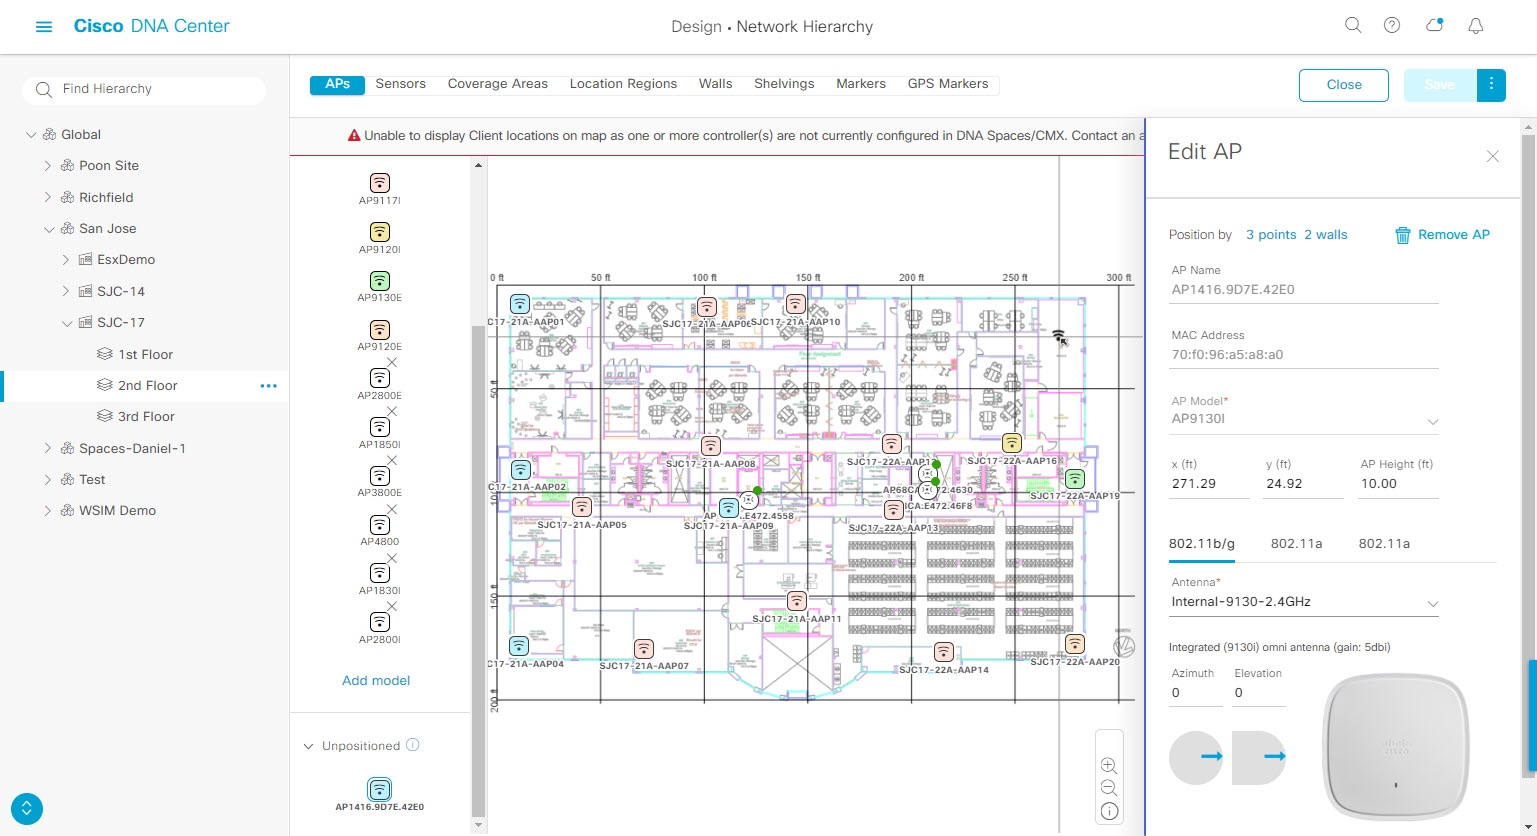
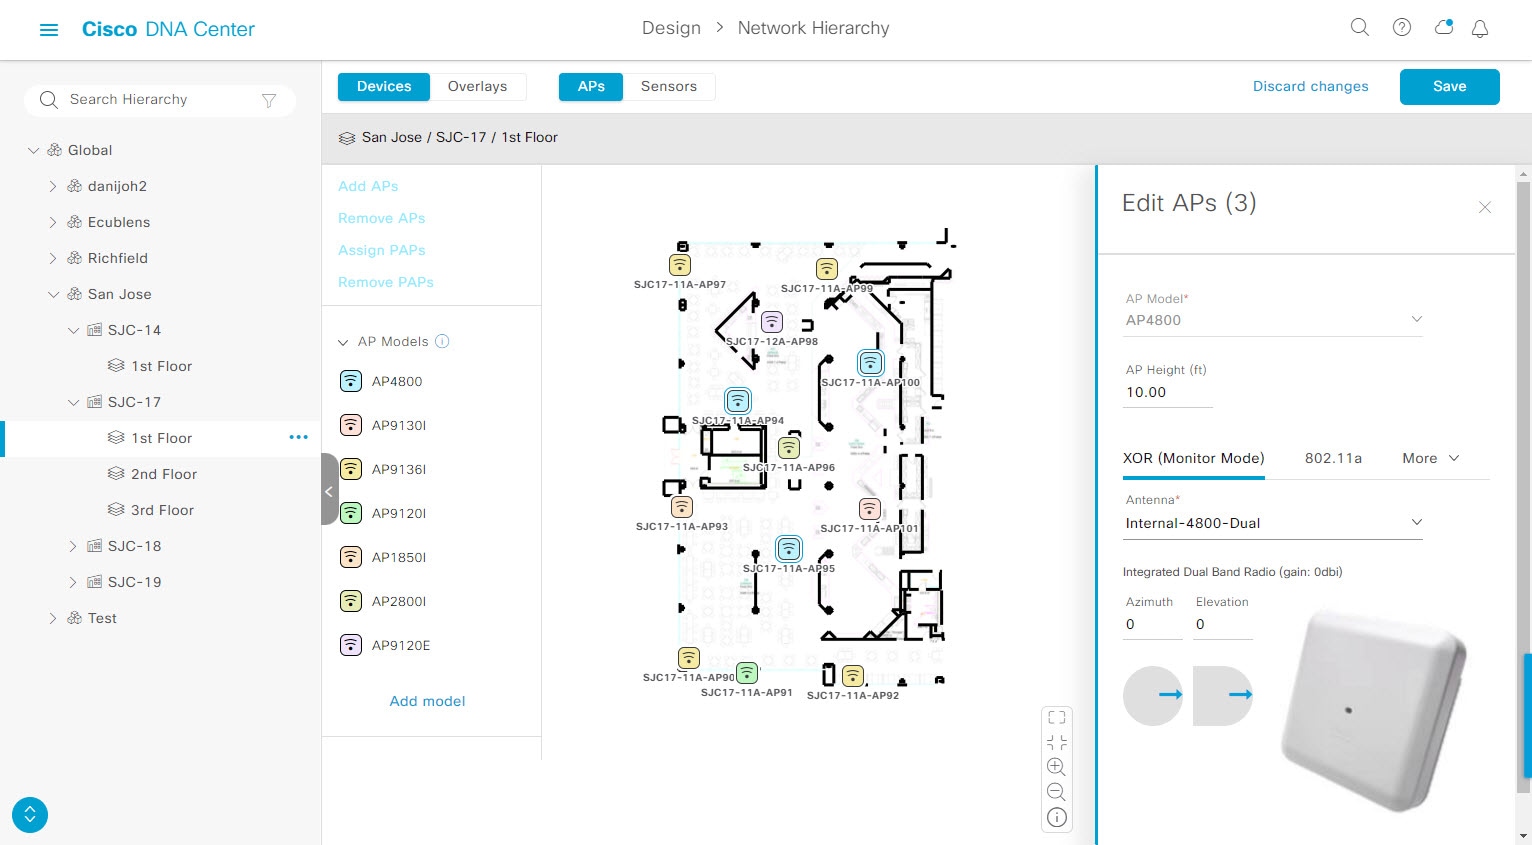
Place the planned APs or hypothetical APs on the floor map based on the signal coverage requirement. These hypothetical APs or planned APs are not yet installed or discovered by Cisco DNA Center.
-
Assign the antenna type and orientation.
-
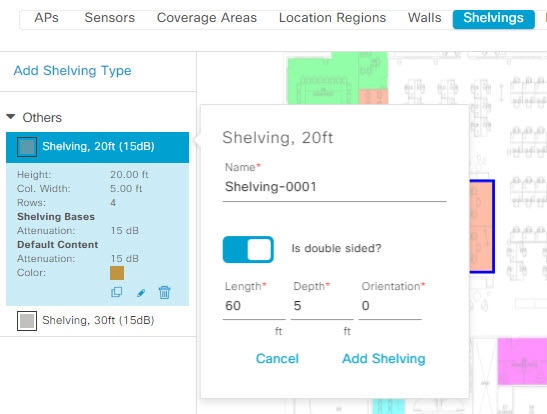
Draw obstacles, such as walls and shelving on the floor, that impact the signal attenuation.
-
Plan all APs in sequence.
-
Export the floor map as a PDF.
 next to the building and choose
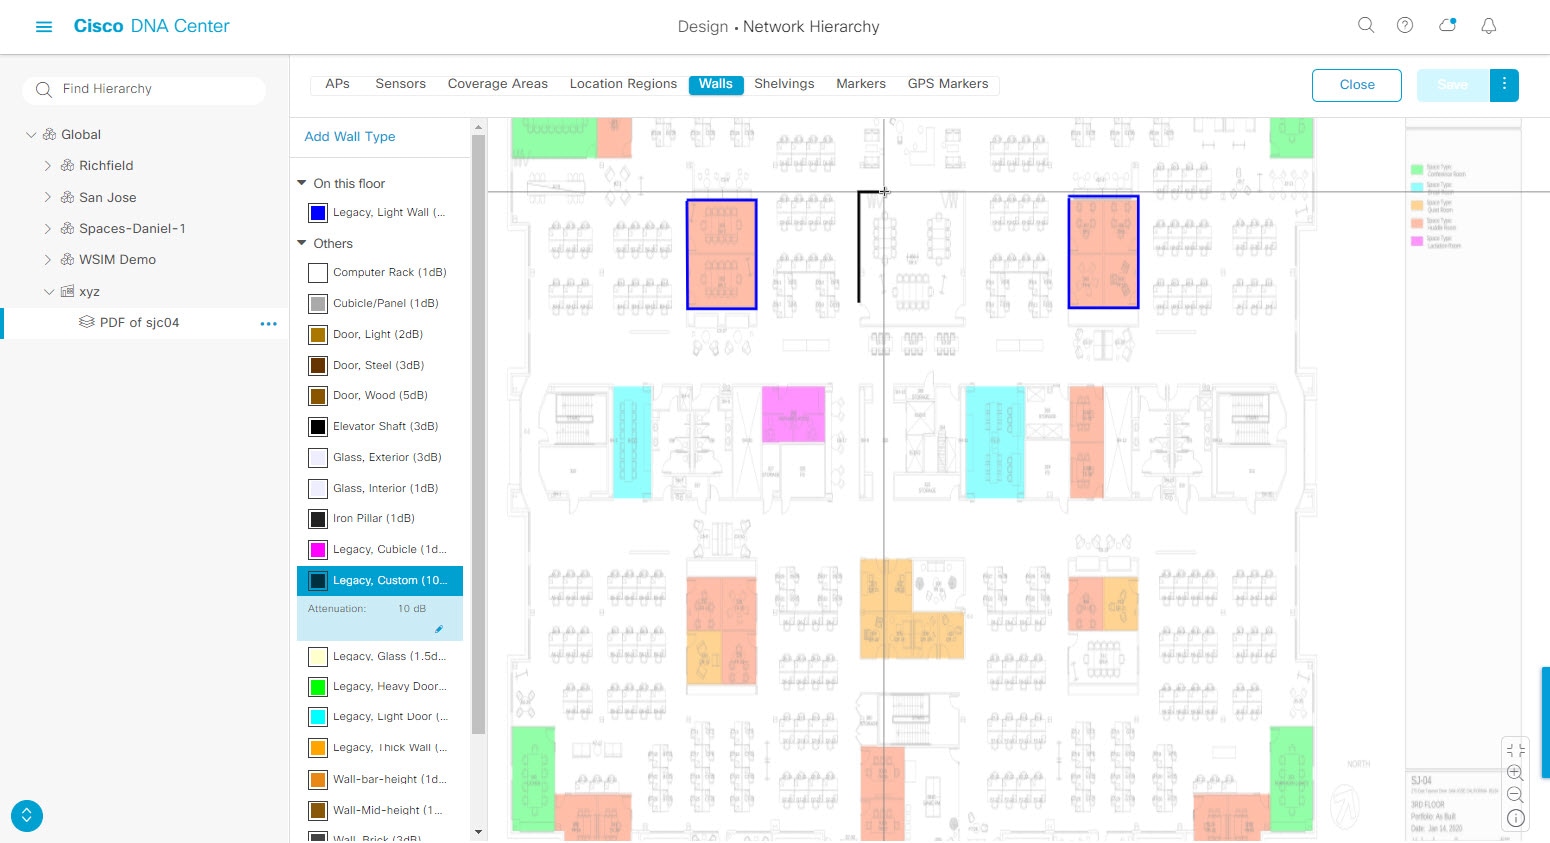


 Feedback