Manage Cisco Crosswork Network Automation
The Crosswork Manager window gives you consolidated information about the current status of each installed Cisco Crosswork Optimization Engine application and its supporting services. It also supplies tools and information that, with support and guidance from your Cisco Customer Experience account team, you can use to identify, diagnose and fix issues with Cisco Crosswork Optimization Engine.
Select to display a Crosswork Manager window, with information like the window shown in the following example.
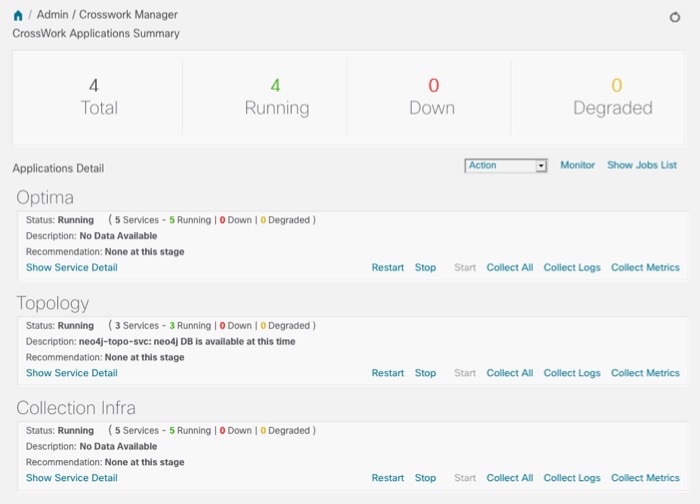
The Crosswork Manager window has two main views. The Crosswork Applications Summary view, at the top of the window, is a dashboard giving you a quick look at the overall health of the system. It displays the total number of Cisco Crosswork Optimization Engine applications currently installed in the system, and how many of that total are Running, Down, or Degraded.
The Applications Detail view, below the Crosswork Applications Summary view, allows you to:
-
View the name and current runtime status of each installed application and its supporting services.
-
Get advice about what to do when an application or one of its services has issues.
-
Collect logs and metrics on any application or service, or for the system as a whole.
-
Stop, start, or restart any application or service.
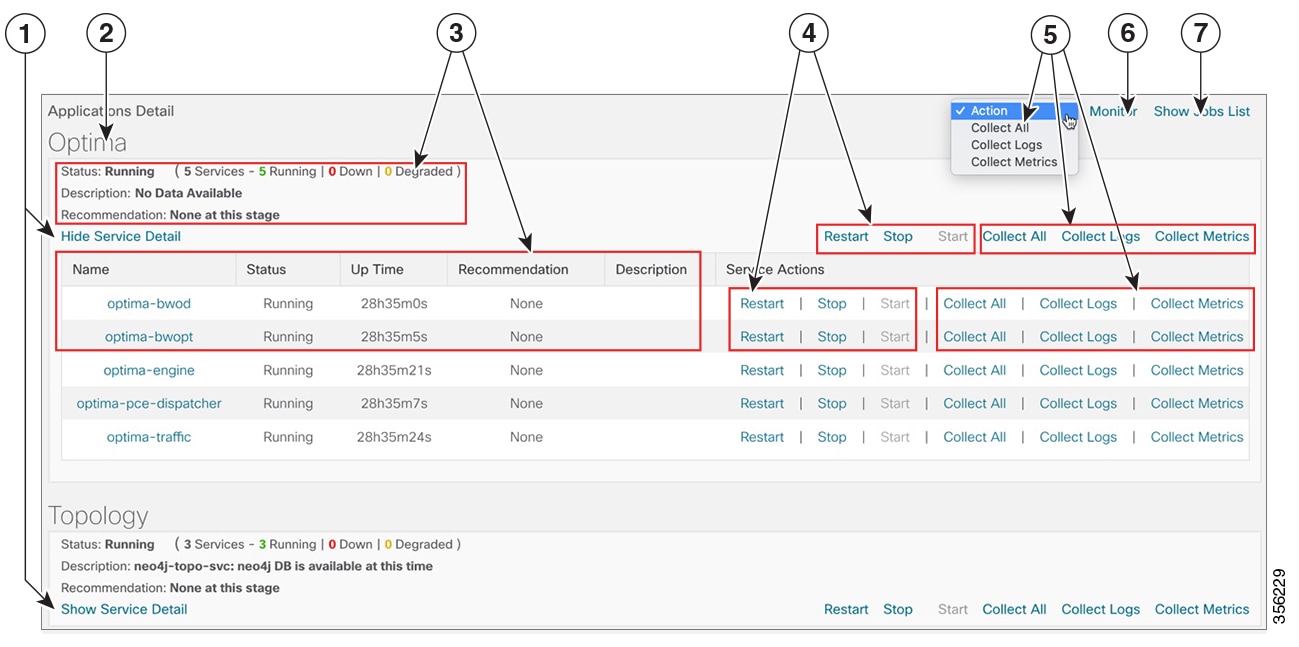
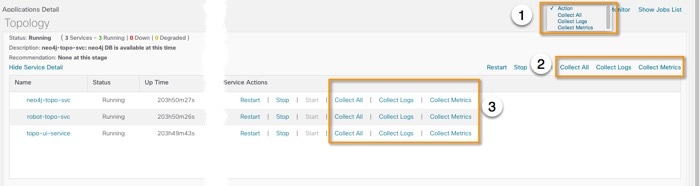
The Applications Detail view, shown in the following figure, is the best way to investigate any system health issues indicated in the Crosswork Applications Summary.
| Item | Description |
|---|---|
|
1 |
Click the Show/Hide Service Detail link in each application tile to view the detailed status of the underlying services for that application. |
|
2 |
An application tile like this shows the current status of the named application and a summary of the status of that application's services. This includes the total number of services, and how many of those services are Running, Down, or Degraded. |
|
3 |
Both the application tile and its Service Detail table provide the name, status, description and recommendation for the respective application or service. The Service Detail table also provides service uptime, and you can click on the link in the Name column to see more details about the service, such as its process ID and pod identifier. |
|
4 |
To control an application or service, click on any of the links in this section of the application tile or Service Detail table. You can click:
See Control Cisco Crosswork Network Automation Applications and Services. |
|
5 |
To gather logs and metrics for the entire system, or for any application or service, click on any of the "collect" links at the system (in the dropdown menu), application, or service level. You can choose:
See Collect and Share Cisco Crosswork Network Automation Logs and Metrics. |
|
6 |
Click the Monitor link to monitor individual Cisco Crosswork Optimization Engine functions and features, using analytical dashboards and data gathered over the last 24 hours of run time. See Monitor Cisco Crosswork Network Automation Functions in Real Time. |
|
7 |
Choosing any of the control or collect actions at the system, application or service level will initiate a job. You can view each job's progress by clicking the Show Jobs Listlink at the top right corner of the window. You can also use the Show Jobs Listto publish collected logs and metrics files, and check on the status of publish jobs you initiate. |
Monitor Cisco Crosswork Network Automation Functions in Real Time
You can monitor the health of Cisco Crosswork Optimization Engine and any of its functions in real time, using a set of monitoring dashboards you can access from the Crosswork Manager window.
Cisco Crosswork Optimization Engine uses Grafana to create these dashboards. They give you a graphical view of the product's infrastructure, using metrics collected in its database. You can use these dashboards to diagnose problems you may encounter with individual Cisco Crosswork Optimization Engine applications or their underlying services.
There are multiple monitor dashboards, categorized by the type of functionality they monitor and the metrics they provide, as shown in the following table.
|
This dashboard category... |
Monitors... |
|---|---|
|
Optima |
Cisco Crosswork Optimization Engine function pack, traffic, and SR-PCE dispatcher functions. |
| Topology | Topology service and database functions. |
|
Collection Infra |
Device-data collection functions. Metrics include telemetry collection latencies, total collection operations, memory and database activity related to telemetry, delayed collections, and so on. |
|
Core Infra |
System hardware and communications usage and performance. Metrics include disk and CPU usage, database size, network and disk operations, and client/server communications. |
To conserve disk space, Cisco Crosswork Optimization Engine maintains a maximum of 24 hours of collected metric data.
Grafana is an open-source visualization tool. The following provides general information about how to use the Cisco Crosswork Optimization Engine implementation of Grafana. For more information about Grafana itself, see https://grafana.com and http://docs.grafana.org
Procedure
| Step 1 |
From the main menu, choose . |
||||||||||||||||||
| Step 2 |
At the right, just below the Crosswork Applications Summary view, click the Monitor link, highlighted below. 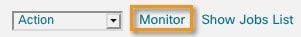 The Grafana user interface appears within the Crosswork Manager window, replacing the Applications Detail view. |
||||||||||||||||||
| Step 3 |
In the Grafana user interface, click Home. Grafana displays the list of monitoring dashboards and their categories, as shown in the following example. 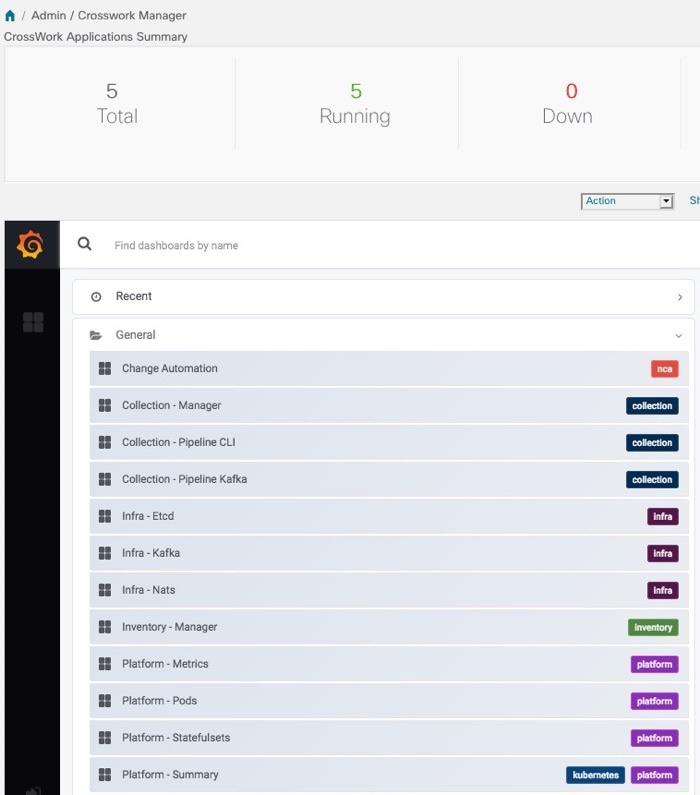 |
||||||||||||||||||
| Step 4 |
Click the 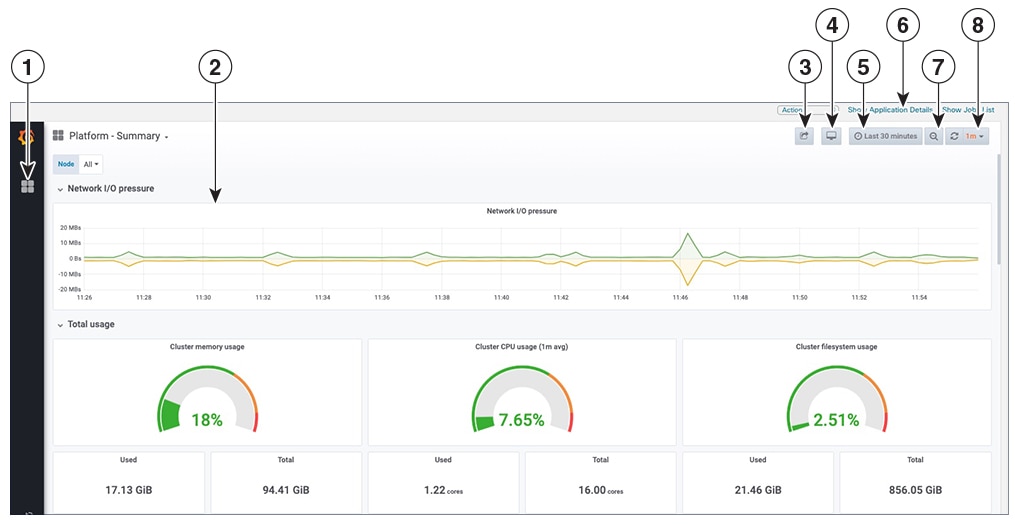 |
||||||||||||||||||
| Step 5 |
Scroll the dashboard as needed to display all of the metrics it provides, or select any of the functions described in the following table.
|
 icon next to the dashboard you want to view. For example: Clicking on the
 Collect and Share Cisco Crosswork Network Automation Logs and Metrics
You can collect logs and metrics on multiple levels of Cisco Crosswork Optimization Engine. You can collect logs and metrics for the entire system, for any of its installed application, or for any service supporting an application. You can also choose to collect only logs, only the additional metrics, or both.
Collected logs and metrics are stored in gzipped tar archive files. You can publish these archives to an HTTP or HTTPS server of your choice.
Procedure
| Step 1 |
From the main menu, choose . The Crosswork Manager window displays, with the Application Detail section listing all the applications. |
| Step 2 |
Click the option for the collection level and target information you want, as follows:
 |
| Step 3 |
When you click on the collection option you want, the Crosswork Manager window displays a popup message indicating that a job was successfully created and giving the job ID. Click on the Show Jobs List link at the right to view the job's progress in the Crosswork Managerwindow's Jobs List view, which replaces the Applications Detail view. |
| Step 4 |
Wait for the job to complete. When the Jobs List view's Status column for your job has changed to JobCompleted, the Action column for the job will show an enabled Publish link for the completed job, and the Description column will show the file name of the gzipped tar archive file containing the collected information. 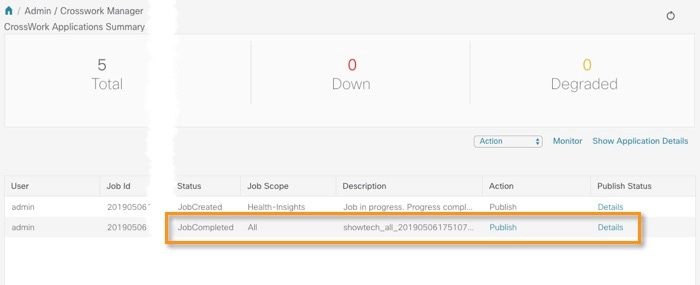 |
| Step 5 |
(Optional) Click on the Publish link to publish the collected information to an HTTP or HTTPS server, as follows:
|
| Step 6 |
When you are finished, click the Show Application Details link to re-display the Applications Detail view. |
Control Cisco Crosswork Network Automation Applications and Services
Users with administrator privileges can control the runtime status of any Cisco Crosswork Optimization Engine application or service. This can include:
-
Stopping a running application or service
-
Starting a stopped application or service
-
Restarting a running or stopped application or service
Please note that stopping, starting and restarting Cisco Crosswork Optimization Engine applications and services can result in anomalous system behavior and possible data loss. Use these functions only with the supervision of Cisco TAC staff.
Procedure
| Step 1 |
From the main menu, choose . The Crosswork Manager window displays, with the Application Detail view listing all the applications. |
| Step 2 |
Display the application or service whose runtime status you want to control:
|
| Step 3 |
Click on the Start, Stop, or Restart link shown next to the service (item 1 in the following figure) or the application whose runtime status you want to control. 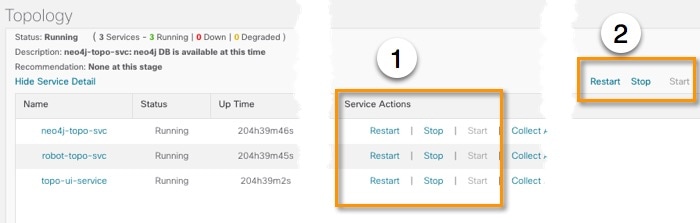 |
| Step 4 |
Click the Show Jobs List link at upper right to view the runtime control job's progress in the Crosswork Managerwindow's Jobs List view. |
| Step 5 |
When you are finished, click the Show Application Details link to re-display the Applications Detail view. |

 Feedback