Network Topology Map
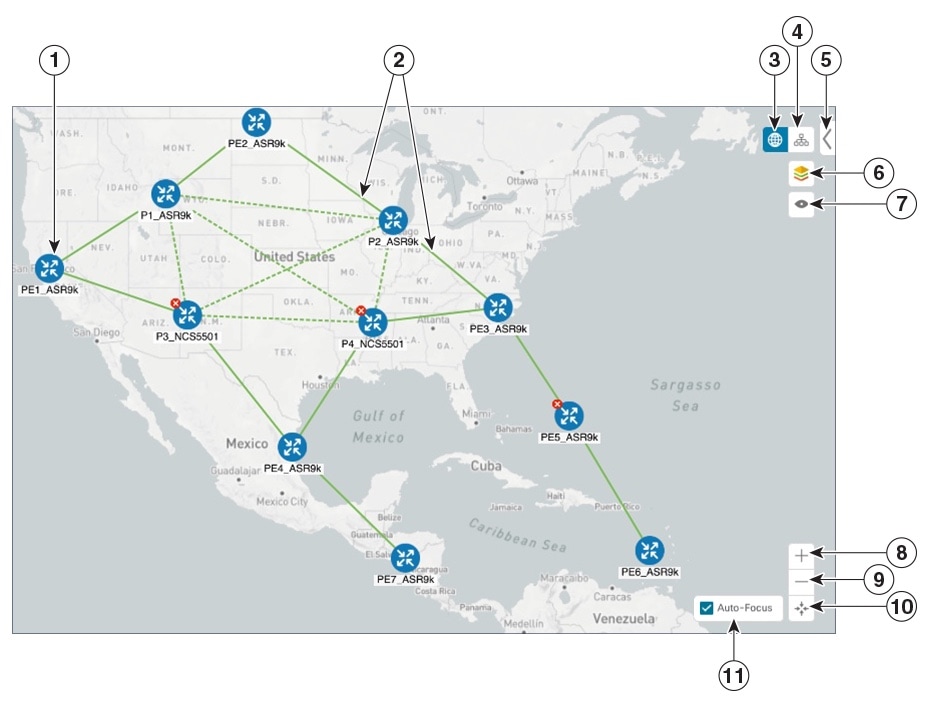
The network topology can be displayed on a logical map or a geographical map, where the devices and links are shown in their geographic context. From the map, you can drill down to get detailed information about devices and links.
To get to the topology map, choose Optimization Engine from the left navigation bar, and click Traffic Engineering.
| Callout No. | Description | |||
|---|---|---|---|---|
|
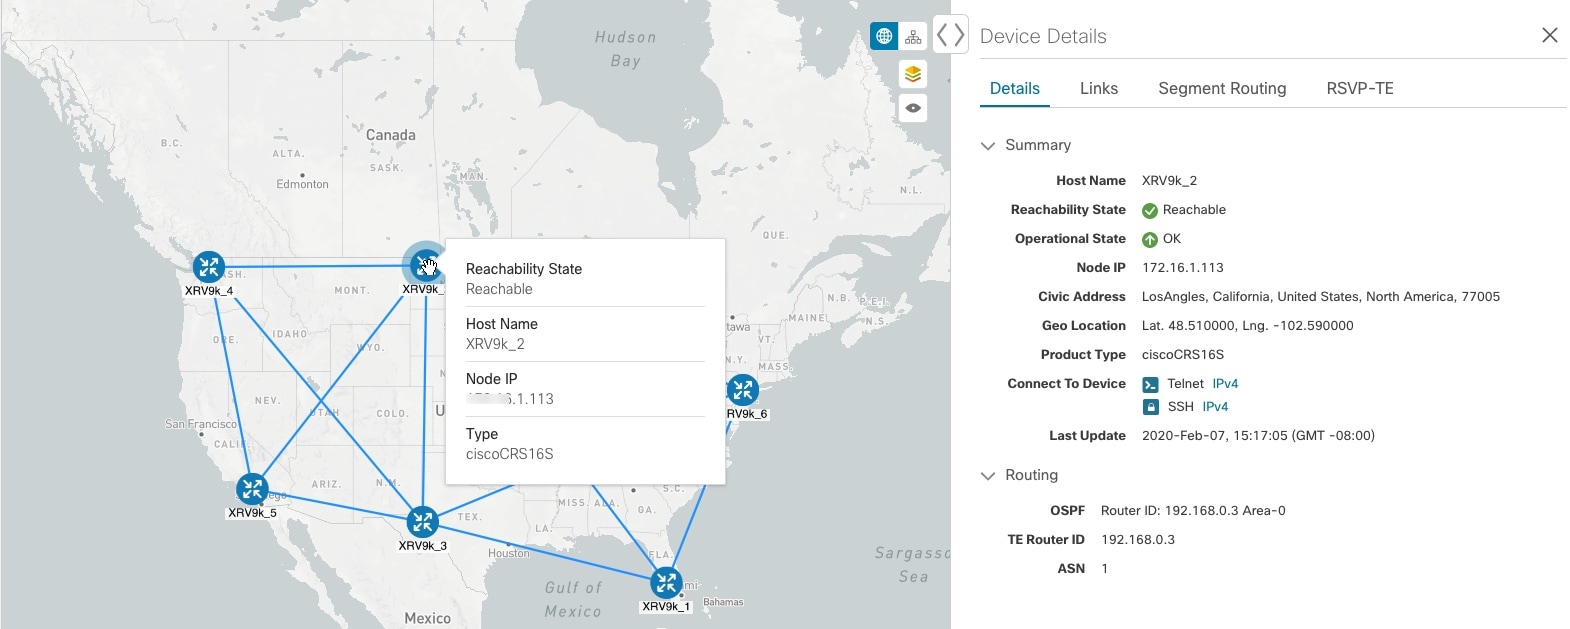
1 |
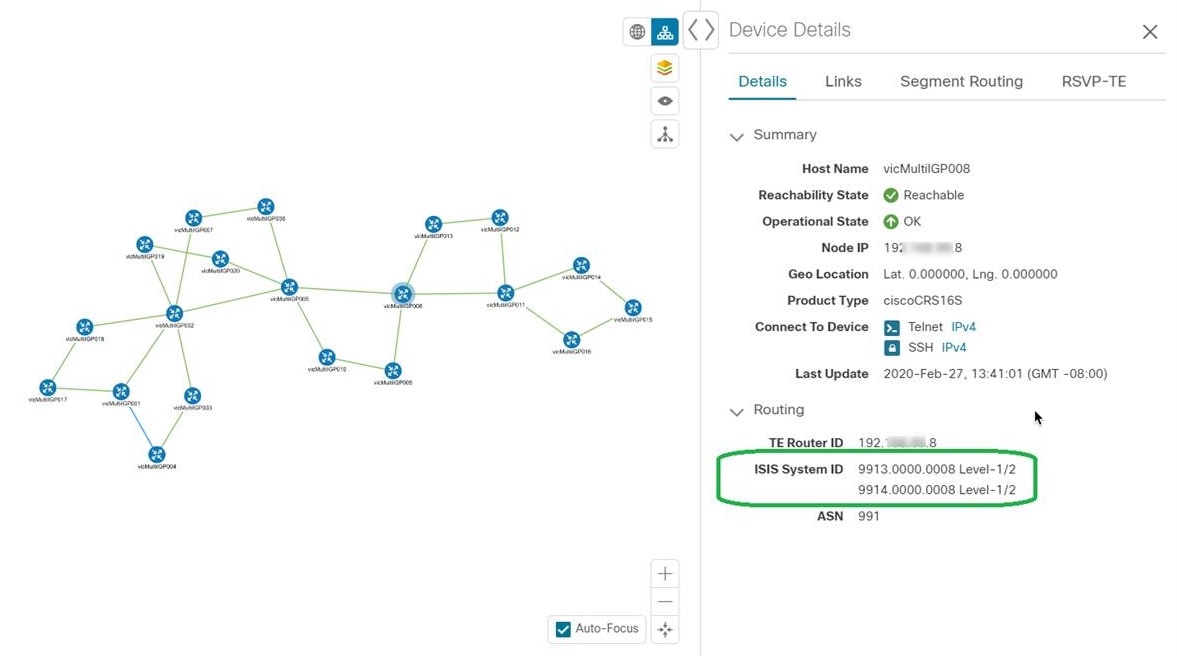
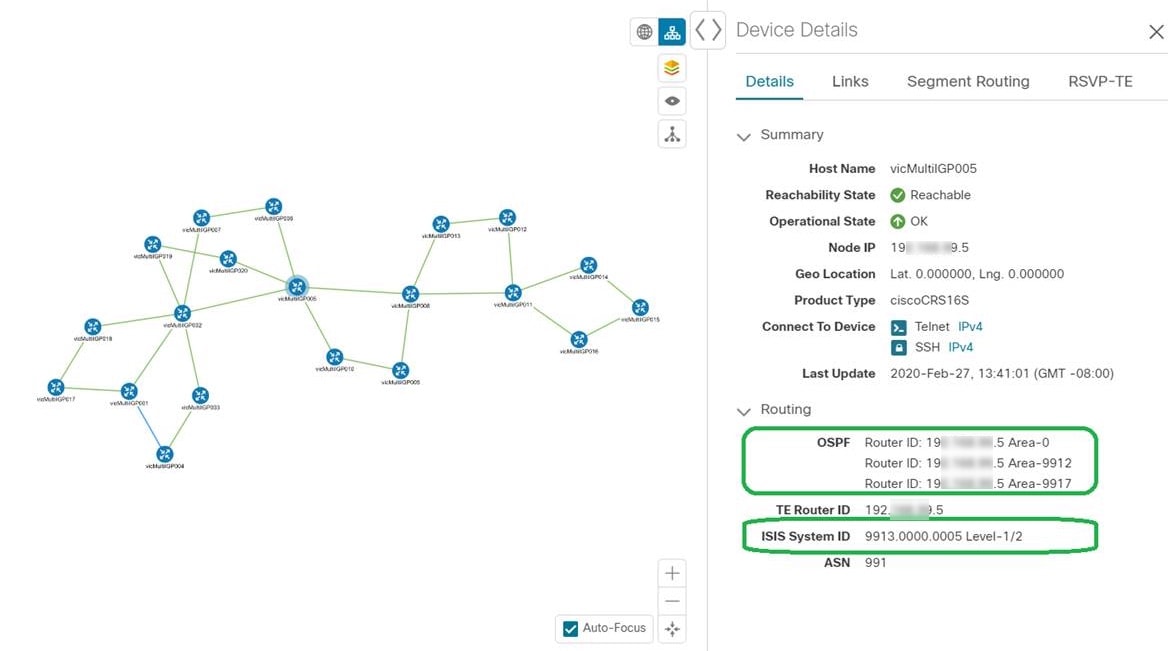
Single Device: A blue device icon means the device is reachable; a gray icon means the device is not reachable. To view a device configuration summary, hover the mouse cursor over the device icon. A pop up window displaying the host name, state, node ID, and device type appears. To view device details, click on the device icon. The Device Details window appears to the right. See Get More Information About Devices on the Map. Device Cluster: If devices are in close physical proximity, the geographical map shows them as a cluster. The number in a blue circle ( |
|||
|
2 |
Links: A solid line indicates a single link between two devices. If there is more than one link between two devices, or between a device and a cluster of devices, the line is shown dashed instead. A dashed line indicates an aggregated link that represents more than one link. |
|||
|
3 |
Geographical Map: Click this icon to view the geographical map. The geographical map shows single devices, device clusters, links, and tunnels, superimposed on a map of the world. Each device location on the map reflects the device's GPS coordinates (longitude and latitude) as defined in the device inventory. |
|||
|
4 |
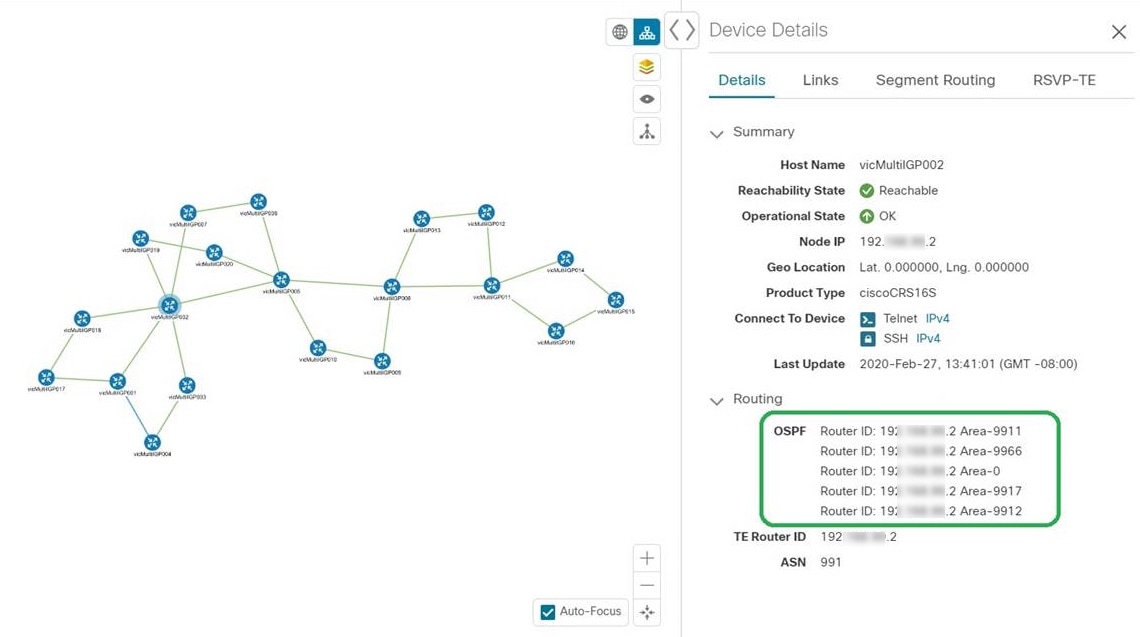
Logical Map: Click this icon to toggle from the geographical map to the logical map. The logical map shows devices and their links, positioned according to an automatic layout algorithm, ignoring their geographical location. You can change the layout algorithm; see Change the Layout of a Logical Map. The logical map displays up to 5000 devices and never displays devices in clusters. If you drill down to the logical map from a geographical cluster at the maximum zoom level, the logical map shows devices that are located in the same location. See Identify the Members of a Cluster. |
|||
|
5 |
Expand/Collapse/Hide Side Panel: Expand or collapse the contents of the side panel. Close the side panel to get a larger view of the topology map. |
|||
|
6 |
Display Preferences: Lets you edit display settings for devices, links, and tunnel metrics. See Change Display Settings for Links, Devices, and TE Tunnel Metrics. |
|||
|
7 |
Custom Map View: Lets you create a named custom view using the settings and layout for your current map, or display a custom view you have created previously. See Create Custom Map Views.
|
|||
|
8 |
Zoom In: Click this icon to zoom in on the selected area; for example, to view clustered devices on the geographical map. |
|||
|
9 |
Zoom Out: Click this icon to zoom out from a selection area. |
|||
|
10 |
Zoom Fit: Lets you automatically scale the map to fit your zoom area. |
|||
|
11 |
Auto-Focus: When checked, automatically zooms in on selected tunnels. This option is selected by default. If you uncheck this option or navigate away from the map; it will revert to the default display. |
|||
Troubleshoot Network Topology Map
If you encounter topology issues, such as topology components not rendering as expected or component data not displaying on the map, Cisco recommends the following:
-
If you cannot see geographical map tiles: Make sure your browser has Internet connectivity to your selected geographical map services vendor. The map services vendor and the verndor's URL are set by the system administrator, as explained in Configure Geographical Map Settings.
-
If your devices are missing from the geographical map: Ensure that latitude and longitude data was included when onboarding your devices, or entered later. Cisco Crosswork Optimization Engine cannot position devices properly on the geographical map without location information.
-
Devices that do not have geographical coordinates default to 0° latitude and 0° longitude.
-
If your devices are appearing in the wrong location on the geographical map, confirm that you have entered the latitude and longitude values in the correct order via the UI or in the CSV file you uploaded.
-
If you are having intermittent problems displaying the map or your devices: Clear your browser cache and try again.
Device and Link Icons
The following tables describe the icons used to represent device states, link states, and device types in the Cisco Crosswork Optimization Engine user interface.
| Icon | Description |
|---|---|
|
|
The device is reachable. |
|
|
The device is unreachable. |
|
|
The device has an unknown reachability state (its reachability cannot be determined). |
|
|
The device is operational. |
|
|
The device is not operational. It is either not up, or unreachable, or both. A number in a circle is shown next to this icon. The number indicates the number of recent errors and can be clicked on to display error details. |
|
Some connections to the device are down. |
| Icon | Description |
|---|---|
|
Link is down. |
|
|
Link is up and traffic is passing through it. |
|
|
Link is degraded. If some (but not all links) in an aggregated link are down, the aggregated link shows a degraded icon. The link will also show as degraded if only one direction of an L2 or L3 link was discovered instead of both directions. Click the degraded icon to see exactly which link or interface is down. If all links in an aggregated link are down, the connectivity link shows a link down icon. |
| Icon | Description | ||
|---|---|---|---|
|
|||
 |
Router |
||
 |
Device is reachable, but is undefined or of an unknown type |
||
Configure Geographical Map Settings
The geographical map lets you position your network devices on a world map and monitor them within their geographical context. The displayed world map is imported by accessing the map vendor's site over the Internet (online mode). The look of the map will vary depending on the map vendor you choose.
By default, the client machine from where you access Optimization Engine UI is setup to get map tiles from a specific Mapbox URL over internet connection. If required, you can use a different map vendor (such as Google Maps or OpenStreetMap) by providing the appropriate URL. Both of these options require an Internet connection from your client machine.
Cisco Crosswork Optimization Engine administrator privileges are required to change these settings.
Procedure
| Step 1 |
From the main menu, choose . |
| Step 2 |
Click the Map tab. |
| Step 3 |
From the Map Provider drop-down list, choose one of the following:
|
| Step 4 |
If you are using a custom map provider, in the Map Source URL field, enter the URL for map access. |
| Step 5 |
Click Save. |
| Step 6 |
Navigate to and confirm that the map is displayed correctly. |
Change the Layout of a Logical Map
When you open the logical map, it is displayed according to the default standard layout. You can change the layout, but any changes you make will not persist if you close the map. To save your layout changes, create a custom view (see Create Custom Map Views).
Procedure
| Step 1 |
From the main menu, choose . |
| Step 2 |
In the top-right corner of the map, toggle from the geographical map view to the logical map view. |
| Step 3 |
In the logical map, click the System Layouts icon in the toolbar to access the layout options. 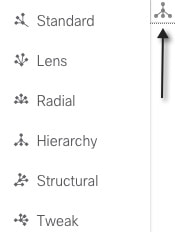 |
| Step 4 |
Choose one of the predefined options to rearrange the devices and links in the map according to your preference:
|
Change Display Settings for Links, Devices, and TE Tunnel Metrics
You can change the appearance of links and devices that are displayed on the topology map. You can also choose to show metrics
on the topology map for selected TE tunnels. To do this click ![]() on the topology map.
on the topology map.
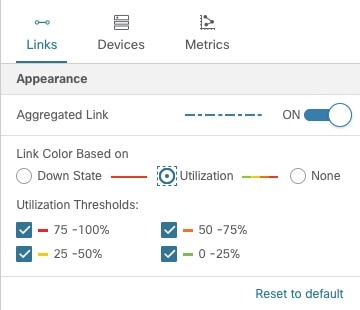
Links
By default, colored link utilization thresholds and aggregated links are displayed. To change this select the Links tab and make the appropriate changes.
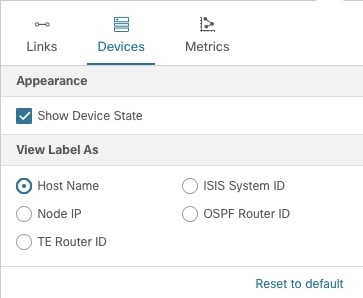
Devices
By default, the device host name and the state of the device is shown. To hide device states or display devices with a different label (Node IP, ISIS System ID, OSPF Router ID, or TE Router ID), select the Devices tab.
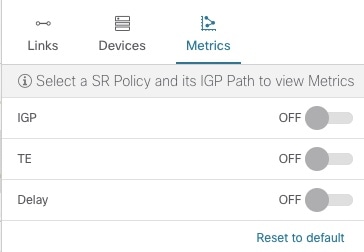
TE Tunnel Metrics
By default, TE tunnel metrics are not displayed. To display tunnel metrics, do the following:
-
Select tunnels from the SR Policies or RSVP-TE Tunnels table.
-
Click the Show IGP Path checkbox on the topology map.
-
Click
 and click the Metrics tab.
-
Check the metrics you want to see displayed.
Create Custom Map Views
When you rearrange the devices and links on a map, your changes are not normally saved. When you open the map later, your map settings are lost.
To easily recreate a useful map layout, you can save it as a named custom view and quickly retrieve it, without having to rearrange the map each time. This is especially useful when managing large networks with many devices.
When you save a custom view, the following settings will be saved:
-
Whether it is a geographical or logical map.
-
Device positions in the logical map layout.
-
Whether bandwidth utilization visualization is enabled or disabled.
 Note |
|
To create custom views:
Procedure
| Step 1 |
Choose from the left navigation bar. |
| Step 2 |
Customize the current map view until it contains only the information you want and until the layout meets your needs. |
| Step 3 |
When you have the view the way you want it, click |
| Step 4 |
Click Save View and the Save View popup displays a new, blank input field under the Name field. |
| Step 5 |
Enter a unique name for the new custom view and click Save. |
What to do next
Manage Custom Map Views
You can display, update or delete any of the custom views created using the instructions in Create Custom Map Views. This includes custom views created by other users.
To manage custom views:
Procedure
| Step 1 |
Open the topology map by choosing from the left navigation bar. |
| Step 2 |
Click
|
| Step 3 |
To delete a custom view:
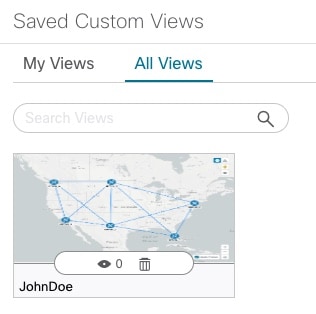
|
 Feedback