Automate Network Changes

This section contains the following topics:

Change Automation Overview

The Change Automation application automates the process of deploying changes to the network. You can define automation tasks to achieve the intended network states in Change Automation using Playbooks that consists of plays written using YAML. You can then push configuration changes to Cisco Network Service Orchestrator (NSO), which deploys these changes to the network devices.

The difference between Change Automation and other existing scripted automation frameworks is that Change Automation is a closed-loop framework. Changes are deployed to the router or other device using programmable APIs, and the intent of the change is verified using telemetry that comes back from the router. Change Automation relies on telemetry to verify the intent of the change, avoiding the need to frequently poll the device for updates.

Traditional open source-based implementations use CLI towards network devices without a configuration store, which leads to out-of-sync states. Driving network configuration change with a store provides transactional rollback and locking abilities and enables a single source of truth for device configuration.

The following is a high-level Change Automation workflow:

  1. Define your desired network changes in a Change Automation Playbook.

  2. Push configuration changes to the network device indirectly, using Cisco Network Services Orchestrator, a configuration services provider.

  3. Receive real-time feedback via telemetry from the devices, telling you that the network changes were made and the impact of the changes. You can also use post-change KPIs to determine if a particular change should be undone and the devices returned to their previous configuration.

Change Automation comes with a robust library of Playbooks, each with its own collection of atomic configuration and check plays. (A Playbook consists of multiple plays.)

You can configure what each Playbook does by specifying the values of runtime parameters to create a Playbook Job. With the correct programming skills, you can download, modify and then upload and run your own versions of the Cisco-supplied Playbooks, or create your own custom Playbooks. For more information, see About Customizing Playbooks

Use the Change Automation Dashboard

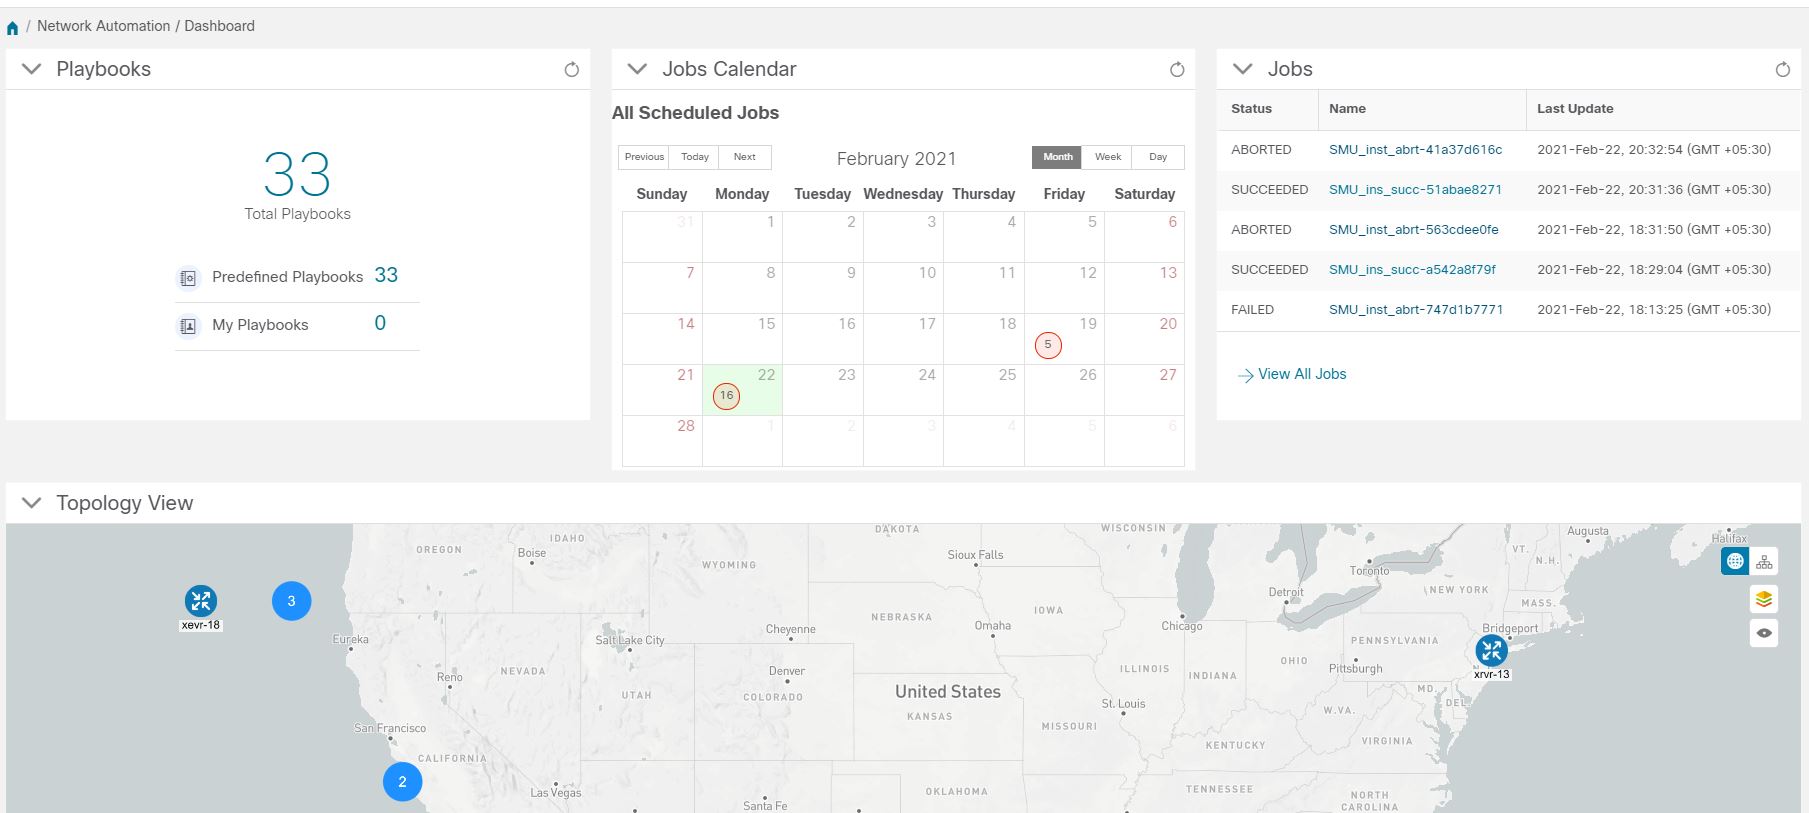
The Change Automation application's Dashboard window (shown in the following figure) lets you view all Playbook-related activity and initiate Playbook runs. It displays an alphabetical list of Playbooks, the most recently run Playbook jobs, and the same network topology map you see when you select Network Visualization > View Topology. For help using the topology map, see Network Visualization Overview.

To view the Change Automation Dashboard window, select Change Automation > Dashboard.

The View All Playbooks and View All Jobs links on the Dashboard window give you direct access to the Change Automation Run Playbook and Job History windows, respectively. For help using these two windows, see the topics in the section About Running Playbooks.

Figure 1. Change Automation Dashboard Window

View the Playbook List

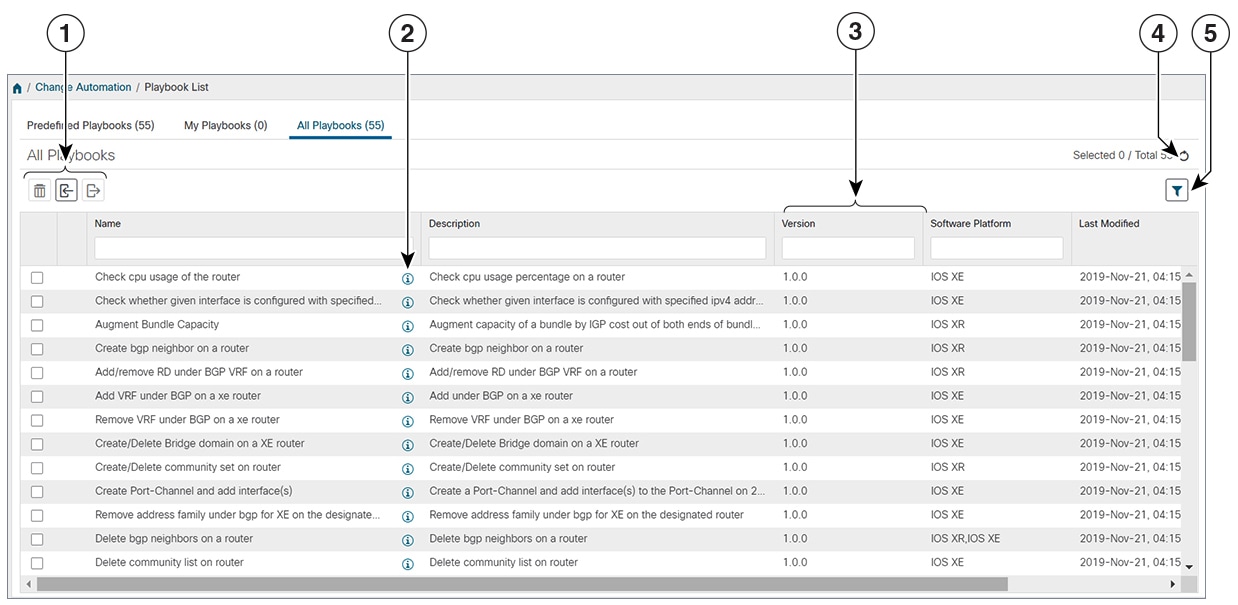
The Change Automation application's Playbook List window (in the following figure) gives you a consolidated list of all the Playbooks in the system. To view the Playbook List window, select Change Automation > Playbook List.

Playbooks List window
Item Description

1

Click Delete icon to delete the currently selected custom Playbook. See Delete Custom Playbooks.

Click Import icon to import Playbooks from a gzipped TAR archive file. See Import Playbooks.

Click Export icon to export the currently selected Playbook(s) as a gzipped TAR archive file. See Export Playbooks.

2

Click Details iconto see a popup Playbook Details window showing the Playbook's description, hardware and software compatibility, version number, and its plays. When you are finished viewing these details, click Close icon to close the popup window.

3

Click on the Name, Description, Version, Software Platform, and Last Modified column headings in the table to sort the table by that column's data. You can also choose which columns are shown, and set quick or advanced filters on any column. See Set, Sort and Filter Table Data.

4

Click Refresh icon to refresh the Playbooks list.

5

Click Set Filter icon to set filter criteria on one or more columns in the table.

Click the Clear Filter link to clear any filter criteria you may have set.

About Running Playbooks

Running any Playbook consists of five steps:

  1. Select the Playbook you want to run (see View the Playbook List).

  2. Select the device or devices you want to run it on.

  3. Enter the appropriate runtime parameters you want the Playbook to apply.

  4. Select the execution mode you want to use:

    1. Perform a Dry Run of a Playbook, where you can see what the Playbook will do before you commit to making changes to the network.

    2. Run Playbooks In Single Stepping Mode, so you have a chance to pause after each Playbook check or action, and roll back changes you did not intend.

    3. Run Playbooks In Continuous Mode and apply the changes immediately.

    While selecting the execution mode, you can also choose to:

    • Schedule Playbook Runs for another calendar date or time.

    • Collect syslogs during and after the run. Syslog collection is available only when running the Playbook in single-stepping or continuous execution mode, and only if you have already configured a syslog storage provider (see Add Syslog Storage Providers).

    • Specify a Failure Policy, where you decide what the system should do in case a failure occurs at any time during the Playbook run.

  5. Confirm your settings and run the Playbook in the execution mode you selected.

Depending on their complexity and on network factors, some Playbooks may take a lot of time to run. At any time during and after completion of a run, you can view the run details and status. If the Playbook is still running, you can also choose to abort it. For details, see View or Abort Playbook Jobs.

Playbook Execution Order

When it is running, every Playbook conducts checks and configuration changes in four phases, which correspond to sections of the Playbook code (identified using the tags discussed in Playbook Components and Files):

  1. Pre-Maintenance—This phase of the Playbook includes non-disruptive checks and any other operations on the device that prepare it for potentially traffic-impacting changes. For example:

    • Take snapshots of various routing protocol states.

    • Take snapshots of memory, CPU, and system health parameters.

    • Validate the capacity (storage, memory) on active and standby routers for the new software patch upgrade.

  2. Maintenance—This phase of the Playbook includes any task that may disrupt traffic flowing through the router or impact neighboring routers. For example:

    • Cost out the router and wait until traffic drains out completely.

    • Verify that the redundant router is healthy and carrying traffic.

    • Perform the upgrade procedure on the device.

    • Reconfigure the device(s) to support a new configuration or feature.

  3. Post-Maintenance—This phase of the Playbook includes verification tasks to perform on the router after any disruptive operation. For example:

    • Verify that the current state matches the desired state.

    • Cost in the router and wait for traffic to return to normal levels.

  4. Continuous—In addition to the three serial phases already described, Change Automation also runs check tasks that span the entire duration of Playbook execution. These tasks check the state of the router while the Playbook is being deployed, and cancel the Playbook execution if any catastrophic or undesirable state change occurs. The checks in the Playbook may also monitor a neighboring router to guarantee that there are no second-order failures in the network while the changes are being deployed.

Perform a Dry Run of a Playbook

A dry run lets you view configuration changes that the Playbook will send to the device, without performing the actual commit of the changes, as you would with a run in the single-stepping or continuous execution modes.

It is a best practice to perform a dry run and verify the configuration changes before you deploy those changes to the router. If the dry run fails, you may want to debug its parameter values using another dry run. You can also debug by performing a single-stepping run, which will allow you to abort and rollback changes after one or more of the plays, instead of only at the end, as part of a continuous run's Failure Policy.

Note that dry run mode is intended for use only with Playbooks that perform actual device configuration changes via Cisco NSO. See the "Playbooks" and "Verbs" references in the Change Automation Developer Guide on Cisco Devnet for details on Playbooks that do not support dry run mode. These will include, for example, Node state snapshot, Install optional package or SMU, and Uninstall optional package or SMU.

Procedure


Step 1

From the main menu, choose Change Automation > Run Playbook.

Step 2

In the Select Playbook list on the left, click on the Playbook you want to dry run. On the right, the window displays the Playbook name, hardware and software compatibility information, and descriptions for all the plays in the selected Playbook.

Step 3

Click Next. The Select Devices window appears. Using this window:

  • You can toggle between the table view and topology map view by clicking and selecting the relevant option on the drop-down button on the upper left corner of the window. Choose Select Devices From List or Select Devices From Map to select the table view or topology map view respectively. By default, the table view is displayed.

  • With the topology map view displayed, you can toggle between the map's geographical and logical views by clicking on the Geographical View icon or the Logical View icon. You can also zoom, display bandwidth utilization, and change logical view layouts as you do with the topology map you see when you select Network Visualization > View Topology (see Network Visualization Overview).

  • You can select the devices using Static or Dynamic using Tags device selection options. Static selection allows you to select devices from the list using quick and advanced filters and filter by tags on the left. Dynamic using Tags selection targets you to select the relevant tag intead of devices from the table on the left side, and all devices associated with the relevant tag are selected. Hover the mouse pointer over the Info icon icon next to the options for more information. You can also view the selection criteria such as number of devices required for the selected playbook.

  • In Static selection mode, you can check the Allow Bulk Jobs check box to select multple devices and run the selected playbook on them at the simultaneously. Based on your selection, the system creates a static group of multiple jobs. Hover the mouse pointer over the Info icon icon next to the check box for more information. There is no limitation on the number of devices you can select for a bulk job.

    Note 

    Allow Bulk Jobs option is enabled for playbooks that can be executed on a single device.

Step 4

The Select Devices window will prompt you to select one or more of the devices shown (depending on the Playbook). Click on the devices you want to select, then click Next. The Parameters window appears.

Step 5

In the fields provided in the Parameters window, enter the Playbook parameter values to use for this dry run.

With the Parameters window displayed, you can also:

  • Click JSON to enter the parameter values in JSON format. A popup text window displays the full list of JSON parameters, with empty values in quotes. Edit the values and, when you are finished, click Save.

  • Click Playbook Import JSON icon to upload a JSON file with the parameter values you want. You will be prompted to navigate to the JSON parameters file you have previously prepared (or downloaded from a previous Playbook run) and then upload it as appropriate for your browser and operating system.

  • Click + Add to add additional instances of a particular parameter, if required for the Playbook you are running. Click X Remove to delete instances added in this way.

  • Click Playbook Clear icon to clear all the parameter values entered so far.

Step 6

With the parameter values set, click Next. The Execution Policy window appears.

Step 7

Choose Dry Run and click Next. The Review your Job window appears, displaying a summary of all of your choices: playbook, devices, parameters, and execution policy. In this window:

  • You must provide a relevant Name for the job.

  • You can assign tags to your job. Click New Job Tag, provide a name and color and save your settings to create your own tag. You can also select from the list of existing job tags by clicking the corresponding checkboxes. Click Manage Job Tags to create, edit or delete job tags.

  • You can click on any of the Change links in the Review your Job window summary to modify your choices.

Step 8

When you are ready to continue, click Run Playbook.

Step 9

At the confirmation prompt, click Confirm. The Execution Mode window is displayed.

Step 10

After the dry run is complete:

  • Click the Dry Run tab and verify the configuration changes that would be pushed to the device had this not been a dry run. This tab will display a no config change message if no changes would have been made. Please note that this tab shows only cumulative configuration changes, not each individual change made. For example, if a Playbook configures set-overload-bit in one step and then unconfigures it using no set-overload-bit in a later step, the tab will show no config change.

  • Click the Events tab to see success and failure messages for each step of the Playbook. This can help you diagnose and correct problems with individual plays and the run as a whole.

  • Click the Console tab to see messages that are generated during the run.

As syslog collection is disabled for drying runs, the Syslog tab will contain only a message stating that.

Step 11

(Optional) If you want to perform a single-step debugging run, or are ready to commit the changes to the device, click Execute Now. The Execution Policy window will display, with all of your parameter values from the dry run pre-filled.


Run Playbooks In Single Stepping Mode

Single-stepping execution mode is a handy way to test a custom or modified Playbook, or diagnose problems with a pre-packaged Playbook that is not giving you the results you want. Unlike a dry run, a single-stepping execution commits configuration changes to the device as the Playbook runs. However, you can set breakpoints on or pauses after any Maintenance or Post-Maintenance action in the Playbook. Please note that, while you can set breakpoints on Pre-Maintenance actions, doing so will have no effect, and these actions will not pause.

Whenever the Playbook hits a breakpoint, it will stop, and will not continue until you issue the command to proceed. At each pause, you can also choose to abort the entire run and roll back all changes made, or rollback to any previous play.

Procedure


Step 1

From the main menu, choose Change Automation > Run Playbook.

Step 2

In the Select Playbook list on the left, click on the Playbook you want to run. On the right, the window displays the Playbook name, hardware and software compatibility information, and descriptions for all the plays in the selected Playbook.

Step 3

Click Next. The Select Devices window appears. Using this window:

  • You can toggle between the table view and topology map view by clicking and selecting the relevant option on the drop-down button on the upper left corner of the window. Choose Select Devices From List or Select Devices From Map to select the table view or topology map view respectively. By default, the table view is displayed.

  • With the topology map view displayed, you can toggle between the map's geographical and logical views by clicking on the Geographical View icon or the Logical View icon. You can also zoom, display bandwidth utilization, and change logical view layouts as you do with the topology map you see when you select Network Visualization > View Topology (see Network Visualization Overview).

  • You can select the devices using Static or Dynamic using Tags device selection options. Static selection allows you to select devices from the list using quick and advanced filters and filter by tags on the left. Dynamic using Tags selection allows you to select the relevant tag from the table on the left side, and all devices associated with the relevant tag are selected. Hover the mouse pointer over the Info icon icon next to the options for more information. You can also view the selection criteria such as number of devices required for the selected playbook.

  • In Static selection mode, you can check the Allow Bulk Jobs check box to select multple devices and run the selected playbook on them at the simultaneously. Based on your selection, the system creates a static group of multiple jobs. Hover the mouse pointer over the Info icon icon next to the check box for more information. There is no limitation on the number of devices you can select for a bulk job.

    Note 

    Allow Bulk Jobs option is enabled for playbooks that can be executed on a single device.

Step 4

The Select Devices window will prompt you to select one or more of the devices shown (depending on the Playbook). Click on the devices you want. Click Next.

Step 5

Click Next. The Parameters window appears.

Step 6

In the fields provided in the Parameters window, enter the Playbook parameter values to use for this run.

With the Parameters window displayed, you can also:

  • Click JSON to enter the parameter values in JSON format. A popup text window displays the full list of JSON parameters, with empty values in quotes. Edit the values and, when you are finished, click Save.

  • Click Playbook Import JSON icon to upload a JSON file with the parameter values you want. You will be prompted to navigate to the JSON parameters file you have previously prepared (or downloaded from a previous Playbook run) and then upload it as appropriate for your browser and operating system.

  • Click + Add to add additional instances of a particular parameter, if required for the Playbook you are running. Click X Remove to delete instances added in this way.

  • Click Playbook Clear icon to clear all the parameter values entered so far.

Step 7

With the parameter values set, click Next. The Execution Policy window appears.

Step 8

Choose Single Stepping. The Execution Policy window displays additional features to customize the job:

  • Under Collect Syslogs, click Yes if you want syslogs to be collected during and immediately after the run, No if you do not. Yes is the default selection only if you have a syslog provider configured (see Add Syslog Storage Providers).
  • From the Failure Policy dropdown, select:
    • Abort to abort the entire run, without rolling back any changes, if a failure occurs at any point. This is the default. Any configuration changes made up to the point of failure will not be rolled back.

    • Pause to pause the run and allow you to decide how to handle the failure. This pause will be in addition to any breakpoints you set using the Single stepping breakpoints dropdown.

    • Complete Roll Back to abort the entire run and roll back all configuration changes made.

  • In the Schedule area, uncheck the default Run Now selection to schedule the job for a later time. See Schedule Playbook Runs for help on using the Schedule area features
Step 9

From the Single stepping breakpoints dropdown, select either

  • Every step to pause automatically after every step in the Playbook.
  • Customize to select the steps where you want the Playbook to pause.

If you select Customize, the Customize Breakpoints popup displays a list of all the plays in the Playbook, with a Playbook Pause iconat the step between each play. Click the Playbook Pause icon at each step where you want to set a breakpoint. When you are finished, click Done.

Step 10

Click Next. The Review your Job window appears, displaying a summary of all of your choices: playbook, devices, parameters, and execution policy. In this window:

  • You must provide a relevant Name for the job.

  • You can assign tags to your job. Click New Job Tag, provide a name and color and save your settings to create your own tag. You can also select from the list of existing job tags by clicking the corresponding checkboxes. Click Manage Job Tags to create, edit or delete job tags.

  • You can click on any of the Change links in the Review your Job window summary to modify your choices.

Step 11

When you are ready to continue, click Run Playbook.

Step 12

At the confirmation prompt, click Confirm. The Job History window is displayed, with the details of the current job displayed on the right side. The job details include information such as job status, job set tags, title of selected playbook, execution parameters and policy, last updated date and update comments (if any). Click the Details icon icon next to the detail to view more information.

Step 13

While the run is executing, the blue Running tile at the top of the window will change to Paused for each step at which you have set a breakpoint. Your choices at each pause will be displayed as buttons below the blue tiles:

  • Click Resume to resume running from this point, with no changes. The Resume request includes the runtime parameters from the previous step; you can edit these, as needed, later.
  • Click Roll Back to roll back any changes made so far. You can choose how far to rollback:
    • Click Complete Roll Back to roll back all changes to the start of the Playbook run. Once you have rolled back to the start, you can choose to Resume from that point, Abort the run entirely, or Edit runtime parameters of the run.

    • Click Select Roll Back Point to roll back changes to the step you select. All the previous steps will then have a roll back point icon displayed next to them: Playbook Roll Back Point icon. Click the Playbook Roll Back Point icon for the step to which you want to roll back. Once you have selected the step, you can choose to Resume from that step, Roll Back further, Abort the run entirely, or Edit runtime parameters.

  • Click Abort to abort the run entirely. No changes made will be rolled back.
  • Click Edit runtime parameters to edit the parameters the run is using. You edit using a popup version of the Parameters window, just as you did in step 6. The parameters exposed for editing when resuming are specific to the task being resumed, which means that they are not the same global parameters you defined in step 6. Most of the time, they are a subset of the global parameters. When you are finished, click Apply. You can then choose to Resume execution with the changed parameters.
Step 14

While the run is executing, you can also use the following features of the progress window:

  • View the execution status of each play in the Playbook in the Maintenance play list at the left side of the window. Plays that fail are indicated with a red icon; plays that succeed are indicated with a green icon.

  • See reminders of your choices in the blue Playbook and Devices tiles at the top of the window.

  • See the current status of the run in the blue Running tile at the top of the window.

  • Click View in the Parameters tile to view the run's parameters. While viewing the parameters, you can click Download Parameters to save them in a JSON file. You will be prompted to name and save the file as appropriate for your browser and operating system.

  • Use the network topology in the map at the right side of the window to view the device and its connections to the rest of your network.

Step 15

After the run is complete:

  • Click the Events tab to see success and failure messages for each step of the Playbook. This can help you diagnose and correct problems with individual plays and the run as a whole.

  • Click the Syslogs tab to access syslog messages collected during and immediately after the run. If syslog collection is enabled, the tab will provide a pointer to the path on the syslog storage provider where collected syslogs are stored. If you chose not to collect syslogs, or no syslog storage provider has been configured, this tab will display a message indicating that syslog collection is disabled.

  • Click the Console tab to see relevant commands and responses from the device consoles that took place during the run. These messages can also help with diagnostics.


Run Playbooks In Continuous Mode

Continuous execution mode is the standard way to run Playbooks. Configuration changes are committed to the device during the run, with no checks or delays except those programmed into it for system resets or other purposes. The run continues until it succeeds or fails. If it fails, you can use the run's Failure Policy to abort, rollback all changes made to the device, or pause execution at the failure point.

It is always good practice to perform a dry run and verify the configuration changes before committing to a continuous run (see Perform a Dry Run of a Playbook). You can also run the Playbook in single-stepping mode, which will allow you to pause execution after any play you select, abort and rollback changes as needed, and even change runtime parameters in the middle of the run (see Run Playbooks In Single Stepping Mode).

Procedure


Step 1

From the main menu, choose Change Automation > Run Playbook.

Step 2

In the Select Playbook list on the left, click on the Playbook you want to run. On the right, the window displays the Playbook name, hardware and software compatibility information, and descriptions for all the plays in the selected Playbook.

Step 3

Click Next. The Select Devices window appears. Using this window:

  • You can toggle between the table view and topology map view by clicking and selecting the relevant option on the drop-down button on the upper left corner of the window. Choose Select Devices From List or Select Devices From Map to select the table view or topology map view respectively. By default, the table view is displayed.

  • With the topology map view displayed, you can toggle between the map's geographical and logical views by clicking on the Geographical View icon or the Logical View icon. You can also zoom, display bandwidth utilization, and change logical view layouts as you do with the topology map you see when you select Network Visualization > View Topology (see Network Visualization Overview).

  • You can select the devices using Static or Dynamic using Tags device selection options. Static selection allows you to select devices from the list using quick and advanced filters and filter by tags on the left. Dynamic using Tags selection allows you to select the relevant tag from the table on the left side, and all devices associated with the relevant tag are selected. Hover the mouse pointer over the Info icon icon next to the options for more information. You can also view the selection criteria such as number of devices required for the selected playbook.

  • In Static selection mode, you can check the Allow Bulk Jobs check box to select multple devices and run the selected playbook on them at the simultaneously. Based on your selection, the system creates a static group of multiple jobs. Hover the mouse pointer over the Info icon icon next to the check box for more information. There is no limitation on the number of devices you can select for a bulk job.

    Note 

    Allow Bulk Jobs option is enabled for playbooks that can be executed on a single device.

Step 4

The Select Devices window will prompt you to select one or more of the devices shown (depending on the Playbook). Click on the devices you want to select them, then click Next. The Parameters window appears.

Step 5

In the fields provided in the Parameters window, enter the Playbook parameter values to use for this dry run.

With the Parameters window displayed, you can also:

  • Click JSON to enter the parameter values in JSON format. A popup text window displays the full list of JSON parameters, with empty values in quotes. Edit the values and, when you are finished, click Save.

  • Click Playbook Import JSON icon to upload a JSON file with the parameter values you want. You will be prompted to navigate to the JSON parameters file you have previously prepared (or downloaded from a previous Playbook run) and then upload it as appropriate for your browser and operating system.

  • Click + Add to add additional instances of a particular parameter, if required for the Playbook you are running. Click X Remove to delete instances added in this way.

  • Click Playbook Clear icon to clear all the parameter values entered so far.

Step 6

With the parameter values set, click Next. The Execution Policy window appears.

Step 7

Choose Continuous. The Execution Policy window displays additional features to customize the job:

  • Under Collect Syslogs, click Yes if you want syslogs to be collected during and immediately after the run, No if you do not. Yes is the default selection only if you have a syslog provider configured (see Add Syslog Storage Providers).
  • From the Failure Policy dropdown, select:
    • Abort to abort the entire run, without rolling back any changes, if a failure occurs at any point. This is the default. Any configuration changes made up to the point of failure will not be rolled back.

    • Pause to pause the run and allow you to decide how to handle the failure.

    • Complete Roll Back to abort the entire run and roll back all configuration changes made.

  • In the Schedule area, uncheck the default Run Now selection to schedule the job for a later time. See Schedule Playbook Runs for help on using the Schedule features.
Step 8

Click Next. The Review your Job window appears, displaying a summary of all of your choices: playbook, devices, parameters, and execution policy. In this window:

  • You must provide a relevant Name for the job.

  • You can assign tags to your job. Click New Job Tag, provide a name and color and save your settings to create your own tag. You can also select from the list of existing job tags by clicking the corresponding checkboxes. Click Manage Job Tags to create, edit or delete job tags.

  • You can click on any of the Change links in the Review your Job window summary to modify your choices.

Step 9

When you are ready to continue, click Run Playbook.

Step 10

At the confirmation prompt, click Confirm. The Job History window is displayed, with the details of the current job displayed on the right side. The job details include information such as job status, job set tags, title of selected playbook, execution parameters and policy, last updated date and update comments (if any). Click the Details icon icon next to the detail to view more information.

Step 11

While the run is executing, the blue Running tile at the top of the window will change to Paused if you chose a Failure Policy of Pause. Your choices will be displayed as buttons below the blue tiles:

  • Click Resume to resume running from this point, with no changes.
  • Click Roll Back to roll back any changes made so far.
  • Click Abort to abort the run entirely. No changes made will be rolled back.
Step 12

While the run is executing, you can also use the following features of the progress window:

  • View the execution status of each play in the Playbook in the Maintenance play list at the left side of the window. Plays that fail are indicated with a red icon; plays that succeed are indicated with a green icon.

  • See reminders of your choices in the blue Playbook and Devices tiles at the top of the window.

  • See the current status of the run in the blue Running tile at the top of the window.

  • Click View in the Parameters tile to view the run's parameters. While viewing the parameters, you can click Download Parameters to save them in a JSON file. You will be prompted to name and save the file as appropriate for your browser and operating system.

  • Use the network topology in the map at the right side of the window to view the device and its connections to the rest of your network.

Step 13

After the run is complete:

  • Click the Events tab to see success and failure messages for each step of the Playbook. This can help you diagnose and correct problems with individual plays and the run as a whole.

  • Click the Syslogs tab to access syslog messages collected during and immediately after the run. If syslog collection is enabled, the tab will provide a pointer to the path on the syslog storage provider where collected syslogs are stored. If you chose not to collect syslogs, or no syslog storage provider has been configured, this tab will display a message indicating that syslog collection is disabled.

  • Click the Console tab to see relevant commands and responses from the device consoles that took place during the run. These messages can also help with diagnostics.


Schedule Playbook Runs

The Change Automation application's Execution Mode window allows you to schedule future Playbook runs as jobs, and view all the jobs that have been scheduled. Use the Schedule area on the left to schedule a job. Use the All Scheduled Jobs area on the right to view scheduled jobs on the calendar.

The Execution Mode window's scheduling features are only displayed when you have chosen to run a Playbook in continuous or single-stepping mode. You cannot schedule a dry run of a Playbook.

Figure 2. Execution Mode Scheduling Features
Item Description

1

Run Now: Running Playbooks immediately is the default for continuous and single-stepping execution modes. To schedule a run for a future time and date, you must uncheck this box.

2

Schedule Selectors: Use these fields to select the future time and date when the Playbook runs. Although it is the default for the Pre-Maintenance and Maintenance phases of a scheduled Playbook to start at the same time, you can use the upper Schedule Pre-check and lower Schedule Perform fields to schedule the start of Pre-Maintenance and the start of Maintenance independently. Note that the Schedule Perform time must always be greater than or equal to the Schedule Pre-check time.

3

Previous/Today/Next Selectors: Use these three selectors with the Month/Week/Day selectors to focus the calendar's display of scheduled jobs on the time range in which you are interested. For example: To show only those jobs scheduled for next week, click Next and Week.

4

Job Icons: Red, numbered icons in the squares representing each calendar date show how many jobs are scheduled for that date. Yellow circle icons represent each scheduled job.

5

Job Details Popup: Hover your mouse cursor over a yellow circle icon to see the details for the scheduled job represented by that icon. The popup shows the execution ID of the job and the name of the Playbook to be run.

6

Show jobs for selected devices only: Check this box to restrict the calendar display to only those jobs scheduled to run on the devices you have already selected. This is a handy way to see if the schedule you plan for your Playbook run will conflict with other scheduled jobs on the same devices.

7

Month/Week/Day Selectors: Use these three selectors with the Previous/Today/Nextselectors to focus the calendar's display of scheduled jobs on the time range in which you are interested. For example: To show only those jobs scheduled for last month, click Last and Month.


Note

Change Automation Playbooks have a mop_timeout parameter, which is a user specified input needed to schedule any Playbook. If your are scheduling a Playbook with Failure Policy set to Complete Roll Back, you must double the value of the mop_timeout parameter as it can possibly take as much time to roll back the Playbook as it takes to run it until the last step. For example, if Playbook timeout is typically set to 1 hour, set it to 2 hours instead when enabling complete rollback on failure policy. Without sufficient mop_timeout, the Playbook can end up in a bad state if the timeout gets triggered while roll back is in progress.


View or Abort Playbook Jobs

There are two ways to view Playbook jobs:

  1. The Change Automation Dashboard window's Jobs panel, which shows general information about the Playbook jobs that have been run most recently, including whether these jobs succeeded or failed.

  2. The Change Automation Job History window lists all Playbookjobs, with much more detail.

Both methods let you click on any individual job in the list to see that job's detailed execution progress panel, which displays the name of the Playbook, its plays, the devices it ran on, the parameters used, and all event, syslog, console and other messages. These details are useful when diagnosing failures.

The Job History window also allows you to abort running jobs.

Procedure


Step 1

From the main menu, select Change Automation > Dashboard. The Jobs panel at the upper right displays summary information for jobs that are running or have been recently run.

Jobs Panel
Step 2

To view information about a specific Playbook job in the Jobs panel, click the blue job title link in the Job column. The job's execution progress panel displays.

Step 3

To view information about all jobs:

  • Click the View All Jobs link at the bottom of the Jobs panel.
  • From the main menu, choose Change Automation > Job History

The Job History window opens with a table of detailed job information. The table data is sorted by the Last Update Time, with running or most recently executed jobs at the top. You can apply quick or advanced filters to the Playbook Title and Devices columns as you would with columns in other table windows (see Set, Sort and Filter Table Data).

Job History window
Step 4

To view information about a specific Playbook job in the Job History window, click the relevant job ID checkbox on the left. in the Execution ID column. The job's status and execution details are displayed on the right side.

Step 5

With the Job History window displayed, you can abort running, paused or scheduled jobs, as follows:

  • To abort a specific job, click the check box next to it and then click Abort Selected.
  • To abort all jobs immediately, click Abort All.
When prompted, click Confirm. Jobs that are currently paused or scheduled will abort once the current task has run to completion.

About Customizing Playbooks

Users can download and customize Cisco-supplied Playbooks, or create their own based on Cisco models or from scratch.

Creating and modifying Playbooks are engineering tasks that take place outside of the user interface for Cisco Crosswork Change Automation and Health Insights. As such, they are outside the scope of this User Guide.

Cisco supplies developer-level documentation for Cisco-supplied Playbooks, Cisco verbs used in these Playbooks, and tutorials on how to create custom plays and Playbooks. For help, see the:

Playbook Components and Files

Change Automation Playbooks contain a variety of components, referred to using specialized names. The components are implemented in the Playbook as files. Some of these components' names are borrowed from the Ansible specification, but all have their own definitions, and not all of the corresponding files can be customized by users. Some components are Cisco-proprietary intellectual property; while you can use them in custom Plays and Playbooks, you cannot customize them directly. The following table explains the function of each of these components, explains how they are implemented, and shows which of them you can customize.

Table 1. Playbook Components and Files

Component

Description

File/Format

Customizable?

Play

A play is a single task to be executed. A task is a list of actions to be performed in service of that play. A play is typically a script that uses one or more verbs.

YAML/YML in the Playbook file

Yes

Playbook

A Playbook is an aggregation of one or more plays, and is structured by the plays it contains. There can be many plays inside a Playbook. The function of a Playbook is to map a set of actions onto the features of a particular host. For example: A query and configuration change script with abstract variables that can be mapped to a particular instance of a device. For more details, see the "Playbooks" and "Verbs" references in the Change Automation Developer Guide on Cisco Devnet.

YAML/YML file

Yes

Verb

A verb is a Cisco-supplied module, and functions as a granular unit of activity. These are Cisco intellectual property, supplied as object code, used under license and not modifiable by users. For more on Cisco verbs and how to use them, see the "Custom Playbooks" tutorial in the Change Automation Developer Guide on Cisco DevNet.

Binary executable file

No

Params

Params are simply variables, used in Playbooks just as variables are used in any programming language. A Params file in a Playbook is an optional file that collects all the user-defined input variables in one place. It is optional because all these variables are also in the plays.

JSON file

Yes

Specs

Short for "specifications", specs are Cisco verb-specific object files, written in JSON schema format. They define all the Playbook input parameters and their constraints.

JSON Schema file

Yes

Tags

Tags are predefined phases of execution for plays within a Playbook, and define the order of execution of all plays:

  • Continuous

  • Pre-Maintenance

  • Maintenance

  • Post-Maintenance

Any play tagged as Continuous or Pre-Maintenance runs in parallel with other plays with the same tags. All plays tagged as Maintenance or Post-Maintenance run serially. These tags are Cisco intellectual property, used under license and not modifiable by users.

Binary Executable files

No, but you select from the predefined tag set.

Role

A role is a built-in wrapper for Cisco’s verbs. These files are Cisco intellectual property, used under license and not modifiable by users.

YAML/YML file

No

Export Playbooks

You can export any Playbook as a gzipped tar archive. This includes any Cisco-supplied Playbook, as well as custom Playbooks that you or another party have authored and have imported into Cisco Crosswork Change Automation and Health Insights.

The exported archive will contain only the user-customizable files listed in Playbook Components and Files. Once you extract them from the archive, you can identify the Playbook components by their file names and filename extensions. The filename will include the Playbook's unique ID (for example: router_config_bgp_rd.yaml for the Playbook YAML code). If files share the same filename extension, the filename will also include an indicator of the type of Playbook component it is (for example: router_config_bgp_rd_specs.json and router_config_bgp_rd_params.json for the Specs and Params files, respectively). For details on each Cisco-supplied Playbook and its components, see the "Playbooks" and "Verbs" references in the Change Automation Developer Guide on Cisco Devnet.

You can edit the exported files as needed, following the guidelines in the "Custom Playbooks" tutorial in the Change Automation Developer Guide on Cisco DevNet. You can then import them as explained in Import Playbooks.

You cannot re-import an exported Cisco-supplied Playbook with the same name as the original.

Your user ID must have Change Automation read permission to export Playbooks.

Procedure


Step 1

From the main menu, choose Change Automation > Playbook List.

Step 2

(Optional) In the Playbook List window, filter the table as needed (see ).

Step 3

Check the check boxes for the Playbooks you want to export. Check the check box at the top of the column to select all of the Playbooks for export.

Step 4

Click Export icon. Your browser will prompt you to select a path and the file name to use when saving the gzipped tar archive. Follow the prompts to save the file.


Import Playbooks

You can import any custom Playbook, provided it meets the following requirements:

  • The Playbook files must be packaged as a gzipped tar archive.

  • The archive must contain a Playbook YAML file and a Specs JSON file, at minimum.

  • The archive file must have a unique name.

Cisco recommends that your imported archive also contain:

  • An ASCII TXT file documenting the Playbook, its plays, and their input parameters.

  • A Params JSON file.

The individual files included in the archive must meet the additional validation requirements described in the "Custom Playbooks" tutorial in the Change Automation Developer Guide on Cisco DevNet.

Note that you cannot overwrite a Cisco-provided Playbook. You can overwrite a custom Playbook. The system will warn you when you are about to overwrite a custom Playbook, but will not prevent you from doing so. Take precautions to ensure that you do not overwrite your custom Playbooks accidentally.

Your user ID must have Change Automation write permissions to import Playbooks.

Procedure


Step 1

From the main menu, choose Change Automation > Playbook List.

Step 2

Click Import icon. Your browser will prompt you to browse to and select the gzipped archive file containing the Playbooks you want to import.

Make sure there is no existing Playbook with the same name as the Playbook you intent to import, unless it is your intent to overwrite the existing Playbook.

Step 3

Follow the prompts to import the archive file.


Delete Custom Playbooks

You can delete user-defined Playbooks only. You cannot delete a Cisco-supplied Playbook.

Your user ID must have Change Automation delete permission to delete Playbooks.

Procedure


Step 1

From the main menu, choose Change Automation > Playbooks List.

Step 2

In the Playbooks List window, select the custom Playbook that you want to delete

Step 3

Click Delete.

Step 4

Click Delete again to confirm.


Troubleshoot Change Automation

The following table describes issues you may encounter when using the Change Automation application, and their solutions or workarounds.

Table 2. Change Automation Troubleshooting

Issue

Solution

Playbook run fails with messages indicating that Cisco Network Services Orchestrator (Cisco NSO) and the target device are out of sync or otherwise out of communication. Message text will vary, but may include "device out of sync", "NC client timeout", and other text indicating that there are connectivity or sync issues between Cisco NSO and the device.

Run the Playbook again. Under normal circumstances, doing so will initiate a sync operation between the device and NSO. Alternatively, you can also perform a sync-from or sync-to operation in NSO.

"Failed to end NSO transaction, 500:fatal:YClientError: Failed to send RPC:" error is displayed while running the playbook.

Include the below settings in the Cisco NSO configuration file (ncs.conf):

<ssh>
<client-alive-interval>infinity</client-alive-interval> 
<client-alive-count-max>5</client-alive-count-max>
</ssh>

Playbook aborted due to failure in locking the device nodes.

In the Devices window, select the relevant devices and clear the lock by moving the device to DOWN and then UP. Go to Admin > Crosswork Manager, and restart the robot-nca process. Once the protocols are reachable, you can schedule to run a new playbook.