Cisco Nexus Dashboard Data Sheet
Available Languages
Bias-Free Language
The documentation set for this product strives to use bias-free language. For the purposes of this documentation set, bias-free is defined as language that does not imply discrimination based on age, disability, gender, racial identity, ethnic identity, sexual orientation, socioeconomic status, and intersectionality. Exceptions may be present in the documentation due to language that is hardcoded in the user interfaces of the product software, language used based on RFP documentation, or language that is used by a referenced third-party product. Learn more about how Cisco is using Inclusive Language.
Cisco Nexus® Dashboard transforms data-center network operations with simplicity, automation, and analytics.
In this era of digital transformation and business resiliency, continuous innovation is critical for organizations to succeed, and experiencing downtime along the way is not an option. Users increasingly demand more features, better usability, reliability, and environmental sustainability from the applications they use.
The network plays a huge role in meeting such demands and provisioning reliable data-center networking services as fast as possible, when and where organizations need it, is a must. However, network infrastructure management is becoming more complex, diverse, and distributed, with multiple configuration points, monitoring tools, and vast amounts of data generated every second (Figure 1).
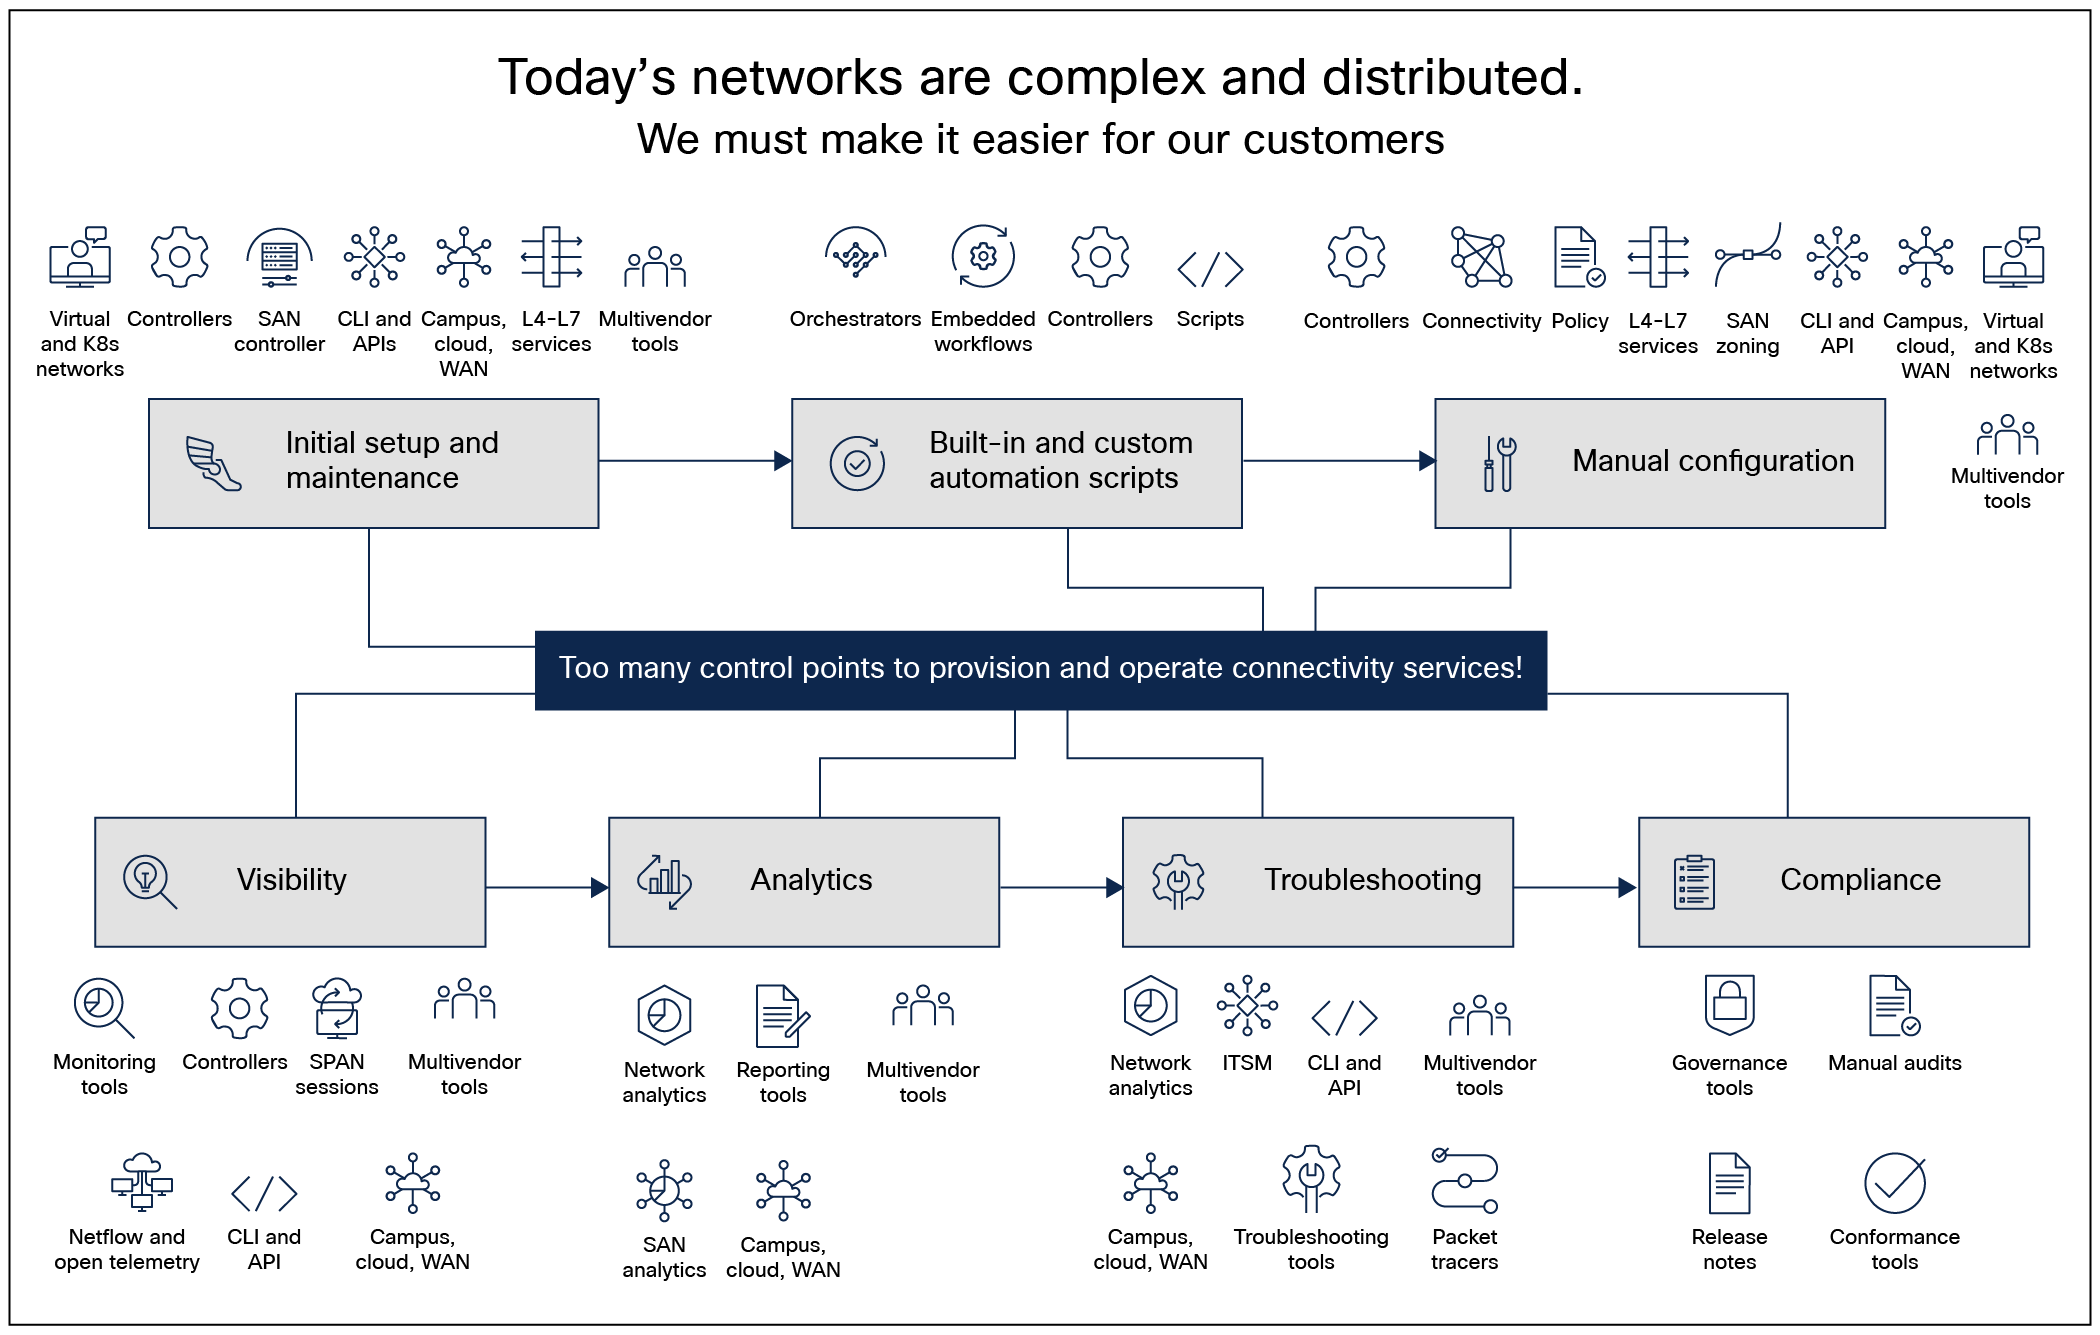
Network complexity in a hyper-diverse and hyper-distributed world
Having an inconsistent way of configuring, provisioning, and operating the network often leads to human errors, potential security holes, and a reactive break-then-fix model that commonly increases downtime due to manual correlation, and endless finger-pointing between teams.
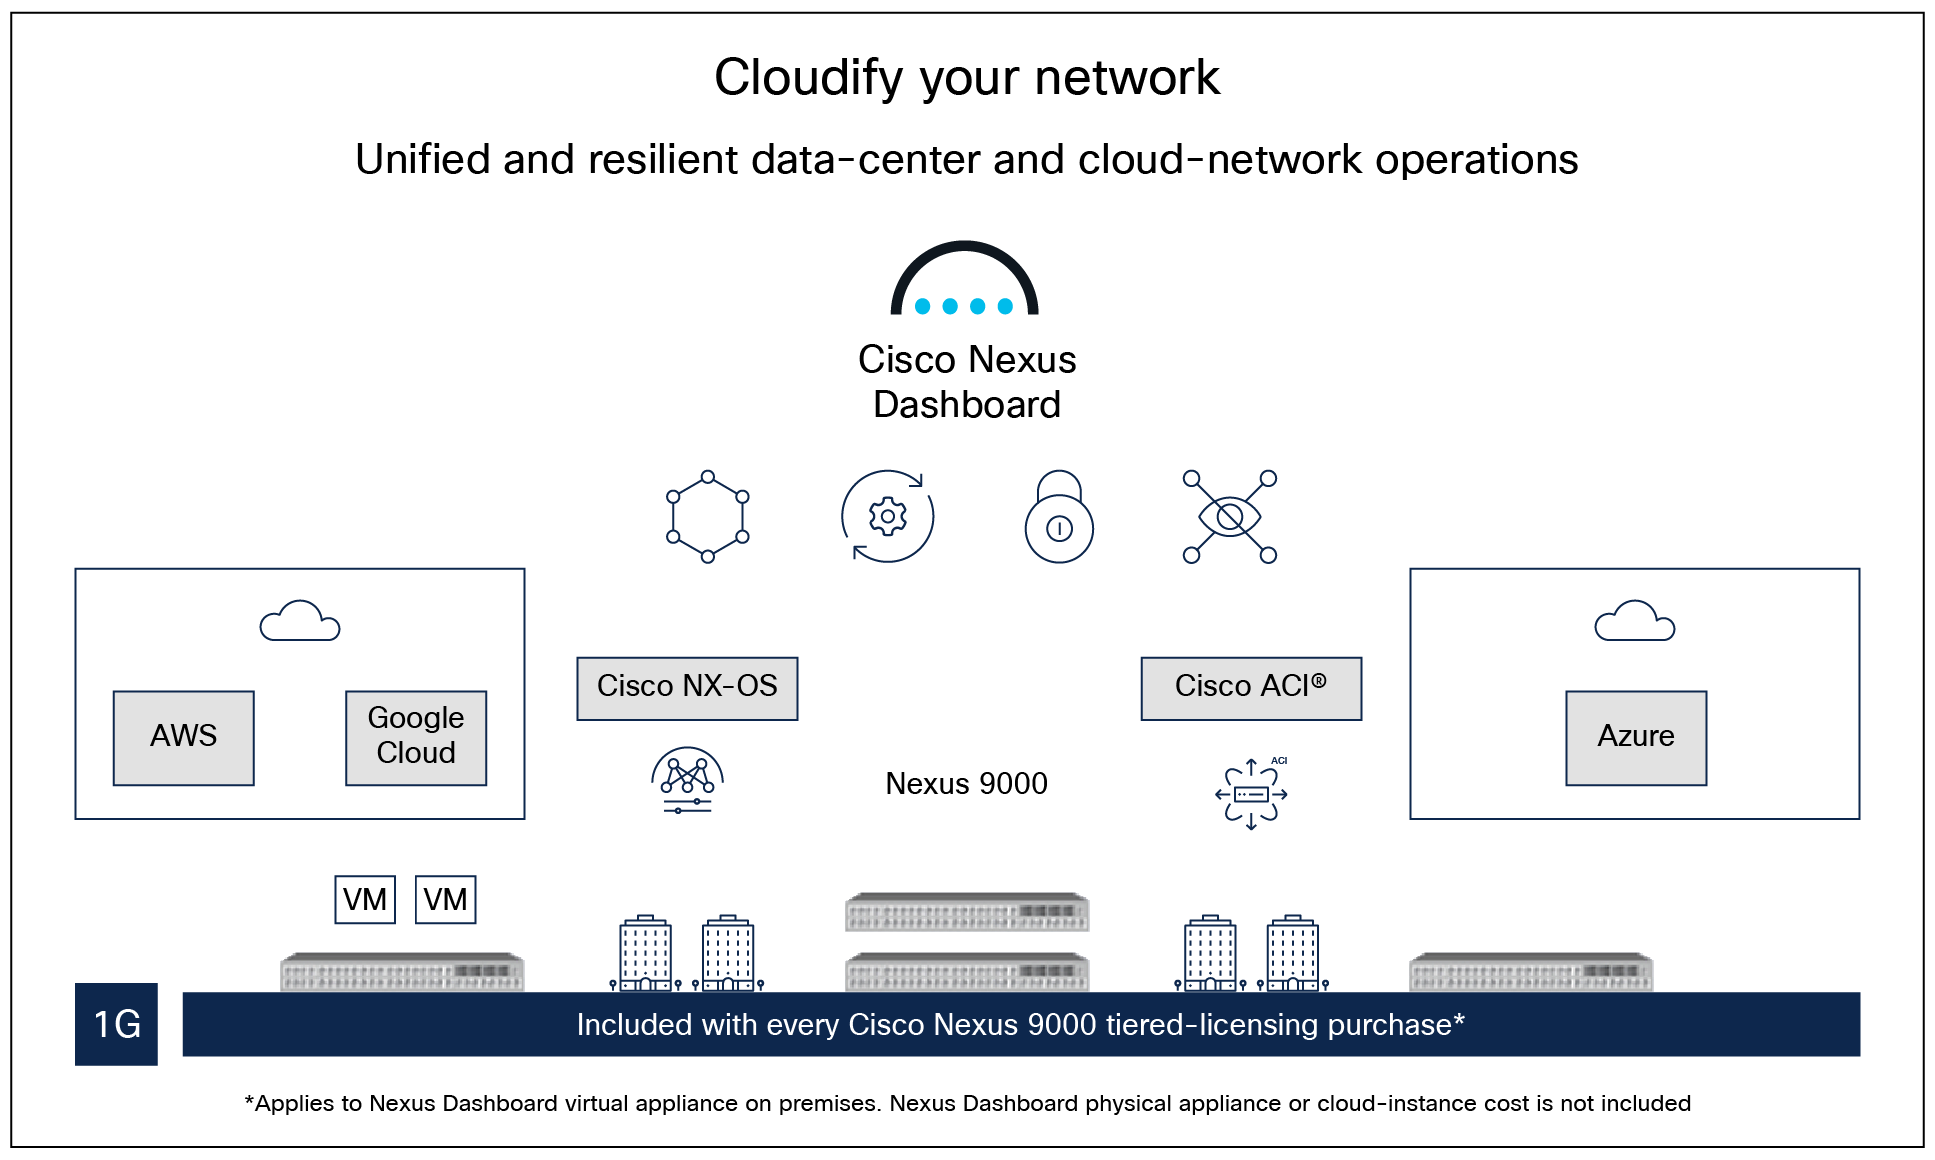
Included with every Cisco Nexus 9000 Series switch–tiered licensing purchase, Cisco Nexus Dashboard provides a single focal point to unite the disparate network configurations and views of multiple switches and data centers (Figure 2).
Cisco Nexus Dashboard helps to do the following:
● Configure: Leverage a centralized interface to define and manage network policies across ACI and NX-OS fabrics. Minimize errors and simply processes by using consistent, template-driven deployments and automate multi-site configurations.
● Manage: See a unified view of ACI and NX-OS environments, enabling centralized monitoring, troubleshooting, and policy control. Streamline operations across multiple sites with tools for network health management, event correlation, and proactive insights to ensure network reliability and performance.
● Analyze: minimize downtime by turning hardware and software telemetry into insights (including anomalies and advisories) to identify potential issues and recommendations to fix them. Cisco Nexus Dashboard gathers years of experience under a single network-operations platform to take advantage of its analytics to learn more about sustainability, compliance, changes, and traffic behavior (including flow records, drops, congestion, latency, AI/ML RoCEv2, and more) and, from a network perspective, pinpoint exactly where and when an application issue originated.
Cisco Nexus Dashboard: powering automation and analytics with a unified, agile, and sustainable networking platform
Operational infrastructure standardization and toolchain unification directly lead to operational excellence and savings and free resources for business innovation. By providing a single point of management that empowers users to provision and operate their networks across different switches, fabrics, and locations, Cisco Nexus Dashboard is evolving to become one of the simplest ways to provision, monitor, and manage data-center networks.
Table 1. Cisco Nexus Dashboard platform features and benefits
| Feature |
Benefit |
| Unified services |
Telemetry and analytics enable proactive monitoring and AI-driven anomaly detection, helping teams identify and resolve issues before they affect performance. Orchestration simplifies the deployment and management of Multi-Site and multidomain policies, ensuring consistent configurations across complex environments. Automation centralizes provisioning and lifecycle management for data-center fabrics. Together, these integrated services help IT teams accelerate operations, reduce downtime, and maintain compliance—delivering greater agility and reliability for modern data centers. |
| Cisco Nexus Dashboard offers flexible deployment options for diverse data-center needs. Physical appliance clusters can incorporate the second generation L4 appliances (UCS M6–based) or the latest third generation G5S and G5L appliances (UCS M8–based), both delivering the performance and scalability required for large, high-throughput environments. For virtualized environments, Nexus Dashboard is available as a virtual appliance (vND), deployable on VMware ESX, RedHat KVM and Nutanix virtualization infrastructure without dedicated hardware. A cloud-hosted option is also available, providing a customer-owned, cloud-managed deployment that removes infrastructure overhead while delivering the same capabilities across LAN, SAN, and IPFM environments. |
|
| Multi-cluster support |
Operators can connect multiple Cisco Nexus Dashboard clusters together to bring all services and environments into a single pane of glass experience. |
| Remote authentication |
Centralize user access to Cisco Nexus Dashboard and its managed resources using remote authentication providers including RADIUS, TACACS, LDAP or Microsoft Entra ID MFA to support seamless single sign on (SSO) across any multi-cluster connected clusters. |
| Role-Based Access Control with Multi-tenancy |
Role-Based Access Control (RBAC) in Cisco Nexus Dashboard ensures secure, segmented, and efficient management of network operations by allowing administrators to assign permissions based on user roles and responsibilities. Multi-tenancy allows multiple independent organizations or teams to securely share a single Nexus Dashboard deployment by allowing the separation of resources, permissions, and operational domains so each tenant has isolated access to its own sites, policies, users, and resources. This enables service providers and large enterprises to support multiple business units or customers on one platform while maintaining strict security boundaries, centralized management, and consistent operational workflows. |
| Air-gap support |
Cisco Nexus Dashboard air-gap support enables secure operation of the platform in fully isolated environments with no external network connectivity. It allows all required software updates, service packages, and operational data to be imported manually through controlled, offline workflows. This ensures organizations with strict security or compliance requirements—such as government, defense, or highly regulated industries—can use Nexus Dashboard while maintaining complete environmental isolation and protection from external threats. |
Automation and management features
Table 2. Cisco Nexus Dashboard automation and management features
| Feature |
Benefit |
Supported Fabric Types |
| Fabric creation and switch discovery |
Cisco Nexus Dashboard provides a variety of fabric types, including VXLAN EVPN, classic LAN, AI, External, Routed and IP for Media fabrics. Users are guided through a simple workflow to create greenfield fabrics or import existing brownfield fabric configurations, apply best-practice recommendations, and policy deployment. Switches are seamlessly onboarded to fabrics through an automated discovery process or through explicit definition. |
VXLAN, Classic LAN, AI, External, Routed, IPFM |
| Switch roles |
Cisco Nexus Dashboard supports various switch roles, such as spine, leaf, border and more which automatically apply Cisco best-practice standards to device configurations. Cisco Nexus Dashboard ensures that the proper configuration and policy application is applied based on the switch’s position and responsibilities in the network topology. |
VXLAN, Classic LAN, AI, External, Routed, IPFM |
| Inventory |
Cisco Nexus Dashboard's inventory view provides a centralized, real-time display of all discovered network devices, detailing their sync status, roles, and health for streamlined management and monitoring. |
VXLAN, Classic LAN, AI, External, Routed, IPFM, ACI |
| Power On Auto Provisioning (POAP) |
POAP automates the process of onboarding new switches into the fabric. When a switch is powered on and connected to the network, Cisco Nexus Dashboard detects it, pushes a predefined configuration, and integrates it into the fabric without manual intervention. This significantly reduces provisioning time and minimizes human error during deployment. |
VXLAN, Classic LAN, AI, External, Routed, IPFM |
| Configuration drift visibility |
Automatically detects changes across device settings, policies, and fabric elements. This feature provides visibility into unintended or unauthorized modifications that could impact performance, security, or compliance. Cisco Nexus Dashboard not only highlights the differences through a side-by-side comparison but also pinpoints the exact lines and values that have changed, enabling rapid troubleshooting and remediation. |
VXLAN, Classic LAN, AI, External, Routed, IPFM |
| Unified topology views and control |
Unified topology view provides the following capabilities:
● Show physical and overlay networks together for quick visibility into VXLAN overlays and Layer-2 connectivity.
● Display per-switch VXLAN/VTEP/VNI status plus link and overlay health to aid troubleshooting.
● Offer smart views for vPCs and virtual device contexts in Cisco Nexus fabrics, with VXLAN-aware search.
● Support zoom and search across switches, endpoints, and other site elements.
● Correlate virtual infrastructure (VMs, port groups, DVS/vSwitches, vNICs, VMNICs) with the physical network topology.
|
VXLAN, Classic LAN, AI, External, Routed, IPFM, ACI |
| Fabric control and overlay visibility and management |
Fabric control provides the following capabilities:
● Manages multiple LAN fabric types, including VXLAN-EVPN, AI/ML networks, and traditional three-tier LAN, with workflows for services like vPCs.
● Provides intuitive overlay management with built-in best practices and clear Cisco NX-OS configuration profiles.
● Delivers compliance management to keep the network aligned with intended design and flag deviations for correction.
● Simplifies provisioning via interface groups, so attached overlay networks are applied once and inherited by new interfaces.
● Supports overlay network and VRF provisioning.
|
VXLAN, Classic LAN, AI, External, Routed, IPFM |
| Nexus One (Open Networking) |
Next-generation SDN solution that unifies Cisco NX-OS VXLAN EVPN and Cisco ACI fabrics using open standards and a common Nexus Dashboard experience. Cisco Nexus One provides a single data, control, policy, and management plane, enabling:
● Consistent microsegmentation and L4–L7 service insertion across single or multi-site deployments.
● Seamless interoperability with existing VXLAN EVPN and ACI fabrics, campus networks, and public clouds.
This unified, open architecture helps customers innovate faster, reduce time to value, and lower total cost of ownership. |
VXLAN, ACI |
| DevOps and Automation |
Cisco Nexus Dashboard integrates with Ansible and Terraform to automate network operations and reduce manual errors. Official Ansible modules and Terraform providers support full lifecycle management and declarative provisioning, enabling seamless CI/CD integration. This accelerates large-scale provisioning while improving consistency, scalability, and reliability. |
VXLAN, Classic LAN, AI, External, Routed, IPFM, ACI |
| Nexus Dashboard One Manage |
One Manage provides centralized management and monitoring for multi-cluster network fabrics. It enables operators to view, create, and manage fabric groupings that span across multiple Nexus Dashboard clusters from a single pane of glass. Additional capabilities include:
● Unified Monitoring: Offering an aggregated topology and dashboard view of all fabrics and clusters in a multi-cluster environment, showing health, status, and inventory across all managed clusters.
● Topology Insights: The aggregated topology view displays inter-fabric connections and lets you drill down into individual fabrics while maintaining overall situational awareness.
● Fabric Configuration Support: One Manage supports creation and configuration of VXLAN EVPN multi-site domains that include fabrics from different clusters, with automated underlay/overlay connectivity.
|
VXLAN, Classic LAN, AI, External, Routed, IPFM, ACI |
| Microsegmentation using VXLAN Group Policy objects |
Microsegmentation with the VXLAN Group Policy Option (GPO) in Cisco Nexus Dashboard simplifies traffic control by using security group policies based on IP, VLAN, and VM attributes. Key features include:
● Dynamic endpoint classification into security groups
● Centralized policy management via the "Segmentation and. Security" tab in Nexus Dashboard
● Policy enforcement across multiple sites in VXLAN fabrics
● East-west traffic segmentation, reduced attack surface, and improved security isolation
This approach offers flexible, scalable segmentation aligned with your network architecture |
VXLAN |
| L4-L7 service insertion, service chaining, and load balancing |
The L4-L7 service insertion, chaining, and load balancing feature in Cisco Nexus Dashboard enables seamless traffic redirection to service devices within a VXLAN EVPN fabric—no external fabric required. Key capabilities include:
● Service clusters and chaining for redirecting traffic through L4-L7 devices
● Simplified management of switches and interfaces through Nexus Dashboard
● Easy enablement through fabric settings
● Enhanced Policy-Based Redirect (ePBR) for load balancing and application-aware traffic steering
● Automated onboarding of service nodes with built-in security and compliance
This feature streamlines service integration and improves traffic control and security across the data-center fabric. |
VXLAN |
| Change control |
Cisco Nexus Dashboard safely manages configuration changes across network fabrics. It groups intended network updates into a controlled, staged process that includes validation, impact analysis, approval, execution, and post-change verification. Change Control ensures updates are applied consistently, reduces risk through automated checks, and provides full auditing and rollback capabilities—helping operators make network changes confidently and reliably at scale. |
VXLAN, Classic LAN, AI, External, Routed, IPFM, Data Broker, ACI |
| Fabric software management |
Cisco Nexus Dashboard streamlines device upgrades and maintenance with an easy-to-use image management workflow. It supports upgrades, downgrades, patching, EPLDs, and SMUs, and can recommend or create groups for switch upgrades, making the process more controlled. Before upgrading, it performs a pre-upgrade analysis to identify potential issues. The dashboard allows switches to be placed in maintenance mode and supports RMA actions directly from the topology display. Both disruptive and nondisruptive upgrades are supported. After upgrades, users receive a post-upgrade report to review changes and confirm success. |
VXLAN, Classic LAN, AI, External, Routed, IPFM, Data Broker, ACI |
| Git repository integration |
Users can seamlessly integrate their Git repository with Cisco Nexus Dashboard, enabling synchronization for nondefault templates. This feature facilitates external nondefault template modifications, ensuring a streamlined process as changes are pulled into Nexus Dashboard and deployed across fabrics. Users can also push any template updates back to the Git repository, as needed. |
VXLAN, Classic LAN, AI, External, Routed, IPFM, Data Broker, ACI |
| Live Protect |
Leverage advanced eBPF technology to deliver real-time security for data center network devices. Configuration is flexible, allowing management on individual devices via NX-OS CLI or API, or full automation across your data center fabric through CI/CD pipelines. Nexus Dashboard provides centralized orchestration, offering instant visibility into CVE-affected devices, automating the deployment of security shields, and continuously monitoring their effectiveness. Additional capabilities include:
●
Real-Time Threat Protection: Instantly access and apply the latest CVE compensating controls from Cisco for rapid response to new vulnerabilities.
●
Automated Shield Deployment: Tetragon compiles CVE controls into eBPF policy shields, which are deployed in monitor or enforce mode for immediate mitigation.
●
Version Control and Rollback: Every eBPF policy is versioned, allowing for safe rollbacks and flexible policy management.
●
Comprehensive Observability: Monitor policy activity in real time and export logs to Nexus Dashboard, Splunk, or your preferred collector for integration with existing security tools.
|
VXLAN, Classic LAN, AI, External, Routed, IPFM, Data Broker |
| Quantum key distribution for MACsec through SKIP protocol |
Cisco Secure Key Integration Protocol (SKIP) is supported in your Nexus switches and empowers establishing communication with QKD devices and utilizing these devices in the exchange of MACsec encryption keys used for inter-fabric connectivity. Nexus Dashboard automates the configuration of quantum keys that are used to connect two fabrics using inter-fabric links for data-center VXLAN EVPN, enhanced classic LAN, and external connectivity networks. |
VXLAN, Classic LAN, Routed, External |
| Non-Nexus Platform Support: IOS-XE and IOS-XR |
For Cisco IOS® XE platform Cisco Catalyst® 9000 Series switches, Cisco Nexus Dashboard supports VXLAN EVPN automation. Nexus Dashboard will also provide additional support for Cisco IOS XR devices, Cisco ASR 9000 Series Aggregation Service Routers, and Cisco Network Convergence System (NCS) 5500 modular platforms, to be managed in external fabrics in managed mode. Nexus Dashboard will be able to generate and push configurations to these switches, and configuration compliance will also be enabled for these platforms. |
VXLAN (Campus), External |
| REST and JavaScript Object Notation (JSON) API |
● All northbound APIs are REST based. Cisco Nexus Dashboard's GUI uses these REST APIs for all GUI functions.
● Includes self-documented “swagger”-style built-in documentation, with examples
● Enables integration with third-party or custom orchestration and automation tools such as Ansible and Terraform.
|
VXLAN, Classic LAN, AI, External, Routed, IPFM, Data Broker, ACI |
| Provisioning and automation for IPFM fabrics |
Cisco Nexus Dashboard simplifies day-0 provisioning for IP Fabric for Media (IPFM) by using preconfigured policy templates based on industry best practices. This allows for rapid and consistent underlay network setup, reducing time and complexity while ensuring optimal performance and scalability. The dashboard also supports Non-Blocking Multicast (NBM) deployment, which improves multicast traffic handling and efficient bandwidth use across the network. Additional Highlights:
●
Flow and host policy control:Flow and host policy control: manages host and flow policies including control over which endpoints can send traffic and defines detailed parameters for multicast flows, such as bandwidth, QoS, and policing ensuring consistent policy enforcement across the network fabric.
●
End-to-end flow visualization for multicast flows: Enables detailed tracking of multicast flows across the network. This end-to-end visibility assists in ensuring optimal performance and aids in the rapid identification and resolution of issues.
●
RTP flow monitoring: Network health and RTP flow health monitoring to pinpoint packet loss.
●
Multicast NAT: allows step-by-step multicast network address translation (NAT) configuration. It can support configuration templates for ingress- and egress-multicast NAT and unicast-to-multicast and multicast-to-unicast translations. In addition to configurations, Nexus Dashboard provides complete visibility of pre- and post-NAT flows, in both tabular and topology views.
●
Multitenancy VRF: VRF support for Non-Blocking Multicast (NBM) deployments where we can logically isolate multiple customers so that they can coexist on the same fabric. Multiple VRFs can be enabled in either an IPFM NBM-active or NBM-passive mode.
●
Broadcast controller integration: API gateway for broadcast controller
●
SMPTE 2022-7 fabric redundancy visualization: For networks employing SMPTE 2022-7 redundancy, Cisco Nexus Dashboard offers side-by-side visualization of the red and blue fabrics. This feature allows operators to monitor both network paths simultaneously, ensuring seamless content delivery and facilitating quick detection of discrepancies between redundant paths.
|
IPFM |
Table 3. Cisco Nexus Dashboard orchestration features and benefits
| Feature |
Benefit |
Support Fabric Types |
| Orchestrator capabilities |
Extends ACI fabric orchestration across various environments. It centralizes management, supports multidomain orchestration, and offers benefits such as templated orchestration to minimize errors, secure automated connectivity, and consistent network policies. |
ACI |
| Application template deployment modes |
Cisco Nexus Dashboard provides flexible deployment modes, including Multi-Site (stretch) for unified environments across sites and autonomous mode for independent site operations. The Cisco ACI® autonomous application template facilitates centralized configuration management, preventing shadow objects and supporting consistent orchestration. |
ACI |
| Versioning and rollback capabilities |
The platform offers a streamlined one-click upgrade workflow and supports configuration templates with versioning and rollback. Multi-site support extends network segments across up to 14 fabrics for unified orchestration. |
ACI |
| Provisioning policy templates |
Provisioning policies include various templates for application, tenant, fabric, L3Out, and L4-L7 service graphs, simplifying management with a unified view. Cisco ACI transit routing enables seamless inter-site L3Out connectivity, integrating components such as SR-MPLS L3Out and WAN mainframes. |
ACI |
| Service chaining and orchestration |
Advanced L4-L7 service chaining and policy-based routing (PBR) enhance flexibility and efficiency, simplifying security and network service deployments across on-premises and cloud data centers. |
ACI |
| Endpoint Security Group (ESG) for distributed ACI fabrics |
Endpoint Security Group (ESG) for distributed ACI fabrics enables granular security-policy orchestration and flexible segmentation across sites. Usability improvements include patch API enhancements, unified installation, and improved change control. Planning and architecture tools provide new Multi-Site topology views and flexible template management, supporting ESG in Multi-Site deployments and autonomous remote leaf groups. |
ACI |
| ND API gateway for ACI fabrics |
Cisco Nexus Dashboard will route APIC API calls to the ACI fabrics managed by Nexus Dashboard. |
ACI |
Table 4. Cisco Nexus Dashboard visibility and telemetry features and benefits
| Feature |
Benefit |
Supported Fabric Types |
| Mixed fabric support |
Onboard and monitor standalone NX-OS switches (ISN/IPN) used to interconnect ACI pods/fabrics. |
VXLAN, Classic LAN, Routed, External, ACI |
| Time-series database |
Gather evidence from past data. Peer back in time to look at a specific sequence of events and gather intelligent insights. |
VXLAN, Classic LAN, AI, External, Routed, IPFM, ACI, Data Broker |
| Anomalies |
Anomalies are unusual or unexpected events, behaviors, or patterns detected within a network managed by Cisco Nexus Dashboard. Anomalies may indicate potential issues such as performance degradation, configuration errors, security threats, or operational problems. Nexus Dashboard uses collected telemetry and analytics to automatically identify these deviations from normal network operation, alerting administrators so they can investigate and address potential problems before they impact network performance or reliability. |
VXLAN, Classic LAN, AI, External, Routed, IPFM, ACI, Data Broker |
| Anomaly correlation |
Groups related network anomalies together to identify underlying issues more efficiently. By analyzing patterns and connections among multiple anomalies, it helps administrators quickly find root causes and resolve network problems faster. |
VXLAN, Classic LAN, AI, External, Routed, IPFM, Data Broker, ACI |
| Assurance |
Provides comprehensive analysis and validation of network operations. It is designed to ensure network reliability and performance by monitoring network assurance, policy intent, change management, and performance metrics. Assurance provides a high level of network integrity and performance, reducing downtime and improving overall network health. |
VXLAN, Classic LAN, AI, External, Routed, ACI |
| Traffic analytics |
Traffic analytics allow users to monitor network performance metrics such as latency, congestion, and packet drops. This feature automatically discovers services running in the network by matching well-known and user-defined Layer-4 ports to their corresponding service endpoint categories for TCP and UDP traffic. The system assesses service performance based on defined thresholds for these metrics, raising anomalies when deviations occur. Traffic Analytics can operate in Full mode for platforms and software versions that support it, as well as compatibility mode for platforms such as the Catalyst 9000 series switches which do not support TA Full mode operation. |
VXLAN, Classic LAN, AI, External, Routed, ACI |
| Flow telemetry |
Flow telemetry (FT) and flow-telemetry events (FTEs) help minimize troubleshooting time through automated root-cause analysis of dataplane anomalies, such as packet drops, latency, workload movements, routing issues, ACL drops, and more. Monitor flow-rate usage to optimize FT performance. |
VXLAN, Classic LAN, AI, External, Routed, ACI |
| L4-L7 traffic visibility |
Track end-to-end flows across externally connected devices such as firewalls, to help locate dataplane issues across device silos and deduce the locations of packet drops. |
VXLAN, ACI |
| AI fabric and storage traffic congestion detection |
Gain visibility into RoCEv2 traffic congestion and performance over time with ECN and PFC counters. |
VXLAN, AI |
| Search and explore |
Provides a unified, intuitive way for users to quickly find and examine information across their entire network environment. With this feature, administrators can search for devices, interfaces, events, configuration items, and other network elements using keywords or filters. The Explore functionality allows users to drill down into detailed views, visualize relationships, and gain deeper insights into network operations and health which streamlines troubleshooting, monitoring, and management tasks by making relevant data easy to access and navigate from a single interface. |
VXLAN, Classic LAN, AI, External, Routed, ACI |
| Connectivity analysis |
Allows users to visualize and troubleshoot network paths between endpoints. It provides detailed insights into how traffic flows across the network, identifies potential bottlenecks or issues, and helps verify connectivity and policy enforcement. |
VXLAN, Classic LAN, AI, External, Routed, ACI |
| Compliance |
Automatically enforce your IT governance and security policies in the network by establishing golden configuration and communication rules. |
ACI |
| Pre-change analysis |
Avoid network disruption when changing configurations by predicting the impact of the intended changes before deploying. |
ACI |
| Delta analysis |
Narrow down what network changes occurred between two points in time and quickly identify network health, configuration, and resource changes. |
VXLAN, Classic LAN, AI, External, Routed, ACI |
| Upgrade assist |
Perform 40+ checks prior to upgrades, and detect changes in configuration or operational state before and after fabric switch upgrades. |
VXLAN, Classic LAN, AI, External, Routed, Data Broker, ACI |
| Microburst detection |
Expose and locate invisible microbursts. Find out congestion hot spots and protect application performance. |
VXLAN, Classic LAN, AI, External, Routed, Data Broker, ACI |
| Multicast traffic visibility |
Gain visibility into multicast sources, groups, receivers, switches, and traffic rates to monitor state and accelerate troubleshooting. |
VXLAN, Classic LAN, External, IPFM, ACI |
| Energy Management |
Optimize energy consumption and costs per site on a device level and measure carbon footprints across energy sources. |
VXLAN, Classic LAN, AI, External, Routed, ACI |
| Real-time telemetry |
Reflect new events, changes and/or anomalies for interfaces, telemetry collection status, and hardware statistics in near real-time. |
VXLAN, Classic LAN, AI, External, Routed, ACI |
| Routing table |
View routing table changes at the fabric and switch level, including next-hop and historical details. |
VXLAN, Classic LAN, AI, External, Routed, ACI |
| Resource utilization |
Provide efficient capacity planning to maintain top network performance. Get fabric-wide visibility of resource utilization and historical trends. Detect components exceeding capacity thresholds ahead of time; for example, TCAM, routes, ACL entries, ports, tenants, VRFs, and EPGs. |
VXLAN, Classic LAN, AI, External, Routed, ACI |
| TCAM utilization |
Manage TCAM capacity resources and security policy with advanced utilization analysis. |
VXLAN, Classic LAN, External, Routed, ACI |
| Hardware resources |
Proactively monitor and report hardware-related anomalies by leveraging telemetry data from sensors such as CPU, memory, disk, power supply, fan speed, and temperature. |
VXLAN, Classic LAN, AI, External, Routed, ACI |
| Statistics |
Use detailed dataplane statistics to diagnose, locate, and remediate issues. Monitor and use protocol anomalies and state information to remediate BGP, vPC, LACP, CDP, and LLDP problems. |
VXLAN, Classic LAN, AI, External, Routed, ACI |
| Endpoints |
Locate virtual machines, bare-metal hosts, and other endpoints in the data-center fabric. Use historical data to track their movements. |
VXLAN, Classic LAN, AI, External, Routed, ACI |
| Topology view and topology snapshot |
Users can utilize their natural visuo-spatial ability to explore, navigate, discover, and zoom into issues, perform rapid troubleshooting using filters to focus on problematic nodes, and extend their historical view of their environments by comparing topology snapshots from different points in time to see which devices have been added or removed within their managed fabrics. |
VXLAN, Classic LAN, AI, External, Routed, IPFM, Data Broker, ACI |
| Customizable dashboards |
Build custom dashboards for NOC-style monitoring by aggregating data from multiple sources into a single view. Monitor and manage key concerns—such as which issues should be visible to other users—using prebuilt, use case–specific dashboards or by creating your own with a flexible set of data-source widgets. |
VXLAN, Classic LAN, AI, External, Routed, ACI |
| Advisories |
Get notified on PSIRTs, bugs, field notices, and EoS/EoL announcements. Take necessary action to stay secure and compliant and prevent unscheduled outages. |
VXLAN, Classic LAN, AI, External, Routed, IPFM, Data Broker, ACI |
| Software and hardware conformance |
Minimize risk of running End-of-Sale (EoS) or end-of-life (EoL) devices. View the current and project the future status of network software and hardware inventory against known EoS/EoL notices to plan for upgrades. |
VXLAN, Classic LAN, AI, External, Routed, IPFM, Data Broker, ACI |
| Scale conformance |
Automatically ensure that deployments are within recommended scale limits to minimize potential outages. |
VXLAN, Classic LAN, AI, External, Routed, IPFM, Data Broker, ACI |
| Log Collector |
Automate the mundane, repetitive tasks of log collection and quickly make them available to Cisco TAC Service Requests (SRs). |
VXLAN, Classic LAN, AI, External, Routed, ACI |
| Data Export |
Share Cisco Nexus Dashboard's enriched, value-added output with the application ecosystem through Kafka message bus, syslog, SNMP and email-based notifications. Build synergetic workflows with third-party IT applications. |
VXLAN, Classic LAN, AI, External, Routed, IPFM, Data Broker, ACI |
| Email notification |
Get offline alerts about network health using the email-notification facility. Pick and choose which issues you need to be alerted about. |
VXLAN, Classic LAN, AI, External, Routed, IPFM, Data Broker, ACI |
| Reporting |
Export anomaly and advisory summaries through data CSV download, email and PDFs. Download content as PDF through browser Print and Save. |
VXLAN, Classic LAN, AI, External, Routed, IPFM, Data Broker, ACI |
Cisco Nexus Dashboard is designed with broad compatibility in mind, offering seamless support for multiple generations of Cisco Nexus and MDS switching platforms, ensuring operational continuity and investment protection across evolving data-center infrastructures. Whether managing legacy 8G and 16G Fibre Channel environments or modern 32G and 64G high-performance fabrics, Nexus Dashboard provides consistent visibility, analytics, and control through a unified interface. As the industry moves toward even higher-speed technologies, Nexus Dashboard is built to support next-generation speed increases, allowing organizations to adopt cutting-edge hardware without sacrificing centralized management or operational simplicity.
Cisco Nexus Dashboard brings exceptional power and intelligence to the management of high-performance storage networks, offering a unified platform that simplifies operations and enhances visibility across complex SAN environments. With robust performance management capabilities, it delivers real-time and historical telemetry that enables deep insights into traffic patterns, resource utilization, and potential bottlenecks. SAN Insights (SAN Analytics) takes this further by streaming rich, flow-level telemetry directly from MDS switches, allowing precise visibility into IOPS, latency, throughput, and congestion hotspots. Integrated SAN Zoning tools simplify and secure access control between initiators and targets, while operational dashboards provide customizable, at-a-glance views of fabric health and key performance indicators. Coupled with congestion management features that help detect, isolate, and resolve traffic contention before it impacts workloads, Nexus Dashboard empowers IT teams to proactively optimize storage performance, ensure data availability, and scale confidently in mission-critical environments.
Table 5. Cisco Nexus Dashboard SAN deployment features and benefits
| Feature |
Description and benefit |
| SAN Zoning support |
Cisco Nexus Dashboard simplifies and secures SAN Zoning by providing an intuitive interface for managing configurations, real-time validation, and visual alerts for potential issues. This reduces errors, speeds up zoning tasks, and helps prevent service disruptions. |
| SAN Insights / SAN Analytics |
SAN Insights in Cisco Nexus Dashboard uses real-time telemetry from Cisco MDS switches to turn SAN Analytics data into actionable visuals. It provides deep visibility into fabric performance, host-to-target flows, IOPS, throughput, latency, and congestion, helping teams quickly find bottlenecks, optimize resources, and troubleshoot more effectively. |
| Configuration drift |
Cisco Nexus Dashboard automatically detects and highlights configuration changes across devices, policies, and fabric elements. It provides side-by-side comparisons that pinpoint exact line and value differences, helping quickly identify unintended or unauthorized modifications and speeding troubleshooting and remediation. |
| Default performance utilization policies |
In Cisco Nexus Dashboard, the default Performance Utilization Policy is enabled by default to deliver immediate visibility into data center fabric health. It automatically collects key telemetry metrics like interface utilization without manual setup, providing baseline monitoring that helps detect performance degradation and potential bottlenecks early. |
| SAN Fabric limits |
Cisco Nexus Dashboard visually displays fabric limits—such as maximum FLOGIs, zones, zone sets, and policies per switch—so operators can see how close they are to capacity. This clarity supports smarter capacity planning and proactive scaling decisions. |
| Multi-Interface Charting comparison |
The Multi-Interface Charting feature in Cisco Nexus Dashboard for SAN fabrics lets users compare performance metrics like Rx/Tx throughput across multiple interfaces, ports, line cards, or switches in a single chart. This makes it easier to spot anomalies, find underperforming links, and confirm consistent performance across the fabric. |
| Optics visualization |
Cisco Nexus Dashboard provides proactive optics health monitoring by continuously analyzing telemetry from SFPs (Tx/Rx power, temperature, voltage) against historical baselines. It identifies trending anomalies and gradual degradation early, highlights at-risk optics with visual alerts, and enables teams to remediate or replace components before failures occur. |
| Discovery Mute |
Discovery Mute is a control mechanism within Cisco Nexus Dashboard that allows administrators to temporarily suppress automatic device discovery activities for selected network elements or domains. This feature provides operators with precise control over when and how Nexus Dashboard scans the network for new devices, configuration changes, or topology updates. |
Managing Cisco Nexus Smart Switches on Cisco Nexus Dashboard
Table 6. Managing Cisco Nexus Smart Switches – features and benefits
| Feature |
Benefit |
| Lifecycle management, automation, and integrated security for Smart Switches |
Cisco Nexus Dashboard delivers comprehensive lifecycle management and networking automation workflows specifically tailored for Cisco Nexus smart switches. It achieves seamless integration with Cisco Security Cloud Control/Hypershield, providing enhanced insights, assurance, and advanced troubleshooting capabilities for these intelligent network devices. This integration is crucial for modern data centers requiring both agility and robust security. |
| NetOps and SecOps: isolated workflows, seamless delivery |
On Cisco Smart Switches, Cisco Nexus Dashboard facilitates a clear separation of duties through isolated yet seamlessly delivered NetOps (network operations) and SecOps (security operations) workflows. NetOps teams leverage Nexus Dashboard for traditional network management tasks, whereas SecOps teams utilize Cisco Security Cloud Control/Hypershield to manage security policies. This separation enables teams to maintain their established persona-based operational models, practices, and procedures, fostering efficiency and reducing conflicts. |
| Deployment with Hypershield |
NetOps teams utilize Cisco Nexus Dashboard to deploy a single, standardized NX-OS image across all Cisco Nexus smart switches within a fabric. This includes deploying the necessary Cisco Hypershield firmware within the DPUs (Data Processing Units) of the Cisco Nexus smart switches, enabling L3/L4 stateful segmentation capabilities. |
| Network automation |
Cisco Nexus Dashboard automates a wide range of networking tasks, including network fabric policy provisioning, VLAN management, and VRF configuration. It also gathers valuable network traffic insights and telemetry data to inform network optimization strategies. |
| Traffic redirection |
Cisco Nexus Dashboard manages VRF/VLAN traffic redirection policies, directing traffic to the DPU for L3/L4 stateful segmentation and inspection. |
| High availability |
Cisco Nexus Dashboard facilitates the creation of high-availability, active/active firewall pairs between Cisco Nexus smart switches and their integrated DPUs. This ensures continuous operation and synchronizes state tables for seamless failover. |
| Security policy automation |
Cisco Hypershield, through Cisco Security Cloud Control, automates security policy provisioning and lifecycle management directly within the Cisco Nexus smart switch DPU. It also gathers security policy hit counts and compliance insights, providing a comprehensive view of the security posture. |
| Network insights |
Cisco Nexus Dashboard provides existing network insights capabilities specifically adapted for Cisco Nexus smart switches, offering detailed performance metrics, anomaly detection, and root cause analysis tools. |
| Security insights |
Cisco Nexus Dashboard offers security-focused insights, including policy visibility, compliance information, and security event correlation. It shares critical network health and traffic analytics with the security team through Cisco Security Cloud Control/Hypershield, fostering collaboration. |
| Troubleshooting workflows |
Cisco Nexus Dashboard offers a suite of troubleshooting workflows, including packet tracing between the NPU and DPU firewalls, packet-capture capabilities, and traffic spanning for detailed analysis. The topology view automatically highlights potential hotspots, accelerating root-cause analysis and reducing Mean Time To Resolution (MTTR). |
Table 7. Cisco Nexus Dashboard integrations
| Integration |
Benefit |
| VMM integrations |
Cisco Nexus Dashboard seamlessly integrates with virtualization and container platforms such as vCenter, Kubernetes, and OpenShift, bridging the gap between physical infrastructure and virtual environments. These integrations extend end-to-end visibility by providing rich insights into VMs, containers, and pods—including details such as IP and MAC addresses, connectivity status, associated networks/vSwitches, and their relationships to leaf switches or top-of-rack (ToR) devices in the data center. This holistic view enables more effective troubleshooting, optimized resource management, and stronger operational alignment between network and application teams. |
| DNS |
Integrate Cisco Nexus Dashboard with your DNS provider to enrich endpoint details with hostname information, thereby making it easier to identify and track your endpoints. |
| AppDynamics |
Analyze the impact of your network on application performance – all from a single console. |
| Infoblox IPAM |
Enhance Cisco Nexus Dashboard's visibility by enabling it to monitor remote IP resource pool usage and allocations for comprehensive host visibility. |
| Panduit PDU |
Monitor energy usage and unlock sustainability insights for fabrics and individual devices connected to a Panduit PDU. |
| Hypershield |
Embed security directly into your network with AI-powered management and automation tools |
| Slurm |
Simple Linux Utility for Resource Management (Slurm) is a high-performance, open-source workload manager used to allocate and schedule compute resources in AI clusters |
| Slack |
Query Nexus Dashboard from a Slack workspace |
For detailed platform and compatibility support, refer to: https://www.cisco.com/c/dam/en/us/td/docs/Website/datacenter/day2ops/index.html.
Cisco Nexus Dashboard software does not require an additional license, and it is included with all Cisco Nexus 9000 Series switch tiered-license purchases. Cisco Nexus Dashboard feature access is based on the purchased switch licensing tier. Automation features are offered as part of Cisco Data Center Networking (DCN) Essentials. Orchestration features are offered as part of DCN Advantage. Selected visibility and telemetry features are available in DCN Essentials, DCN Advantage and DCN Premier licensing tiers.
For information on Cisco Nexus Dashboard features entitlement tiers, please refer to the DCN Subscriptions page.
Licensing: There are no additional licensing requirements for Cisco Nexus Dashboard. For a guide to ordering, please refer to the ordering guide.
Cisco Nexus Dashboard delivers increased scale to meet the growing demands of modern, distributed data-center environments. Designed for large-scale operations, Nexus Dashboard can support thousands of network devices and endpoints across multiple fabrics and sites, providing centralized visibility and control without sacrificing performance. Its scalable architecture allows organizations to expand their infrastructure—whether it’s adding more switches, sites, or services—while maintaining consistent policy enforcement and operational efficiency.
Please check the latest scale information for capacity planning here: https://www.cisco.com/c/dam/en/us/td/docs/dcn/tools/nd-sizing/index.html.
Please refer to the sizing guide for physical and virtual cluster size guidelines.
Table 8. ND-CLUSTERG5S (based on Cisco UCS M8 server) – Cisco Nexus Dashboard platform cluster hardware specifications
| Hardware specifications |
Cisco Nexus Dashboard platform cluster node specifications |
| Memory |
256 GB |
| Processor |
AMD 9454 |
| Hard disk |
6* 2.4 TB each = 14.4 TB total |
| SSD |
960 GB |
| NVMe |
1.6 TB |
| Power supply |
1200 Watts |
Table 9. ND-CLUSTERG5L (based on Cisco UCS M8 server) – Cisco Nexus Dashboard platform cluster hardware specifications
| Hardware specifications |
Cisco Nexus Dashboard platform cluster node specifications |
| Memory |
512 GB |
| Processor |
AMD 9655P |
| Hard disk |
6* 3.2 TB each = 19.2 TB total |
| SSD |
960 GB |
| NVMe |
1.6 TB |
| Power supply |
1200 Watts |
Table 10. ND-CLUSTER-L4 (based on Cisco UCS M6 servers) ‒ Cisco Nexus Dashboard platform cluster hardware specifications
| Hardware specifications |
Cisco Nexus Dashboard platform cluster node specifications |
| Memory |
256 GB |
| Processors |
AMD 2.8GHz 7443P |
| Hard disk |
4* 2.4 TB each = 9.6 TB total |
| SSD |
960 GB |
| NVMe |
1.6 TB |
| Power supply |
1050 Watts 1600 Watts |
Table 11. Virtual Nexus Dashboard – Data profile form factor (vND-Data)
| Hardware Specifications |
Cisco Nexus Dashboard Virtual node specifications |
| Processors |
32 vCPU |
| Memory |
128GB |
| Storage |
3TB SSD/NVMe and 50GB HDD/SSD/NVMe |
| Supported Hypervisors |
VMware ESXi 7.0, 7.0.1, 7.0.2, 7.0.3, 8.0, 8.0.2 |
Table 12. Virtual Nexus Dashboard – App profile form factor (vND-App)
| Hardware Specifications |
Cisco Nexus Dashboard Virtual node specifications |
| Processors |
16 vCPU |
| Memory |
64GB |
| Storage |
550GB HDD/SSD/NVMe |
| Supported Hypervisors |
VMware ESXi 7.0, 7.0.1, 7.0.2, 7.0.3, 8.0, 8.0.2 |
Table 13. Amazon AWS cloud form factor requirements per node of Cisco Nexus Dashboard
| Specifications |
Cisco Nexus Dashboard cloud node specifications |
| Amazon EC2 instance type |
m5.4xlarge (recommended), m4.4xlarge |
| Amazon Elastic Block Store (EBS) |
100G gp2 SSD, 300G gp2 SSD |
| Amazon Simple Storage Service (S3) |
Standard S3 storage |
Table 14. Ordering information
| Part number |
Product description |
| ND-CLUSTER-L4 |
Cisco Nexus Dashboard platform cluster based on Cisco UCS M6 server |
| ND-NODE-L4= |
Cisco Nexus Dashboard platform node based on Cisco UCS M6 server |
| ND-CLUSTERG5S |
Cisco Nexus Dashboard small platform cluster based on Cisco UCS M8 server |
| ND-NODE-G5S= |
Cisco Nexus Dashboard small platform node based on Cisco UCS M8 server |
| ND-CLUSTERG5L |
Cisco Nexus Dashboard large platform cluster based on Cisco UCS M8 server |
| ND-NODE-G5L= |
Cisco Nexus Dashboard large platform node based on Cisco UCS M8 server |
| ND-VIRTUAL |
Cisco Nexus Dashboard virtual platform (OVA, KVM) |
Table 15. Cisco Nexus Dashboard third-party ecosystem
| Partner |
Integration capability |
Applications link |
| ServiceNow |
ServiceNow incident visibility and management on Cisco Nexus Dashboard |
ServiceNow App for Cisco Nexus Dashboard* |
| Splunk® |
Real-time and historical monitoring (organization-specific KPIs and dashboards), troubleshooting, cross-tier correlation, and alerting automation for Cisco Nexus Dashboard Insights |
Cisco Nexus Dashboard Insights App for Splunk Cisco Nexus Dashboard Insights Add-on for Splunk |
| HashiCorp Terraform |
Terraform provider to support Cisco Nexus Dashboard Orchestrator Automation |
Terraform Provider for Nexus Dashboard Orchestrator Automation |
| Red Hat Ansible |
Ansible module to support Cisco Nexus Dashboard Fabric Controller and Cisco Nexus Dashboard Orchestrator Automation |
Ansible Collection for Nexus Dashboard Fabric Controller and Nexus Dashboard Orchestrator Automation |
Cisco Nexus Dashboard platform clusters have a 90-day limited liability warranty.
Cisco environmental sustainability
Information about Cisco’s environmental sustainability policies and initiatives for our products, solutions, operations, and extended operations or supply chain is provided in the “Environment sustainability” section of Cisco’s Corporate Social Responsibility (CSR) Report.
Reference links to information about key environmental sustainability topics (mentioned in the “Environment sustainability” section of the CSR Report) are provided in the following table:
Table 16. Cisco Nexus Dashboard environmental sustainability
| Sustainability topic |
Reference |
| Information on product-material-content laws and regulations |
|
| Information on electronic waste laws and regulations, including products, batteries, and packaging |
Reference links to product-specific environmental sustainability information that is mentioned in relevant sections of this data sheet are provided in Table 16.
*Not available for all Cisco Nexus Dashboard / Cisco Nexus Dashboard Insights versions
Table 17. Cisco Nexus Dashboard environmental sustainability
| Sustainability topic |
Reference |
| General |
|
| Eco-design compliance (EU ErP Lot, etc.) Environmental certifications (EPEAT, Energy Star, etc.) |
Table AA. Product compliance Table BB. Product compliance or Platform features/benefits |
| Power |
|
| Idle, typical, or max product power Hardware-enabled energy features |
Table CC. Product specifications Table DD. Platform features/benefits |
| Software-enabled energy features Power supply information Power calculator |
Table EE. Platform features/benefits Table FF. Product specifications Table GG. Product specifications |
| Material |
|
| Unit weight System weight (product + packaging) Recycled content |
Table HH. Product specifications Table II. Product specifications Table JJ. Product specifications |
Cisco makes the packaging data available for informational purposes only. It may not reflect the most current legal developments, and Cisco does not represent, warrant, or guarantee that it is complete, accurate, or up to date. This information is subject to change without notice.
Power your digital operations transformation with Cisco Nexus Dashboard
Are your operations teams tasked with delivering security, uptime, and business continuity on a complex data-center infrastructure? Do they have the right tools that provide proactive change management and precise troubleshooting information tied together in a unified, easy-to-consume user experience? Start powering the transformation of the networking operations teams by standardizing on the Cisco Nexus Dashboard experience. Meet and exceed critical business mandates of agility and availability as you operate your secure, intent-based data center from Cisco Nexus Dashboard.
Flexible payment solutions to help you achieve your objectives
Cisco Capital® makes it easier to get the right technology to achieve your objectives, enable business transformation, and help you stay competitive. We can help you reduce the total cost of ownership, conserve capital, and accelerate growth. In more than 100 countries, our flexible payment solutions can help you acquire hardware, software, services, and complementary third-party equipment in easy, predictable payments. Learn more.
As applicable, Cisco will provide support for the product as described here: https://www.cisco.com/c/dam/en_us/about/doing_business/docs/cisco-software-support-service.pdf.
Table 18. Document history
| New or revised topic |
Described in |
Date |
| First draft |
|
May 1, 2021 |
| Second draft |
|
May 12, 2021 |
| Third draft |
|
December 15, 2021 |
| Fourth draft |
|
March 14, 2022 |
| Fifth draft |
|
May 23, 2023 |
| Major updates made throughout the data sheet |
Entire data sheet |
June 2025 |
| Major updates made throughout the data sheet |
Entire data sheet |
December 15, 2025 |