Circular Transformation
Cisco is focused on evolving from a linear economy that extracts resources and eventually wastes them, to a circular model that finds new uses for products and their inputs.

Cisco is focused on evolving from a linear economy that extracts resources and eventually wastes them, to a circular model that finds new uses for products and their inputs.
Circular transformation is a key priority in our environmental sustainability strategy. We take a holistic approach to reducing the environmental impact of our products across the product life cycle, in these three focus areas:

Circular design means designing products and systems that enable reuse, minimize environmental impacts, drive innovation, and realize value for our stakeholders. We are designing our products and packaging with circularity in mind, aligning them to 25 Circular Design Principles organized across five focus areas. We leverage a web-based Circular Design Evaluation Tool that enables engineering teams to assess product and packaging designs against these Principles and identify areas for improvement.
Over the past five years, Cisco created and scaled an operating system to develop processes and tools, align business strategies, and empower our people to embed circularity into the design process. Read more about the company's journey to advance Circular Design.
The percentages below are based on new product and packaging designs released in fiscal 2025.

Incorporate recycled content into our products, reduce the use of nonrenewable materials, and consider resource scarcity risks as part of material selection.

Standardize and modularize components and enclosures to simplify our supply chain and enable reuse, repair, remanufacturing, and recycling.

Use recycled and renewable packaging materials, reduce foam and plastic use, move toward fiber-based designs, remove unused accessories, and increase packaging efficiency.

Improve product energy efficiency through activity-based power and power management features.

Design products with easily separable components that use similar materials to facilitate reuse, repair, remanufacturing, and recycling.
1 Excludes plastics contained in commodity components (e.g., plastic screws, fans, and cables).
Over the past few years, numerous initiatives have been implemented at Cisco, such as:
These initiatives have evolved into common product design practices enforced through our Circular Design Principles and Evaluation Tool.
In fiscal 2023, we set a goal that by fiscal 2025, 50% of the plastic used in our products (by weight) will be made of recycled content, excluding commodity components from suppliers and products designed and manufactured by our Original Design Manufacturers (ODMs). We increased the percentage of recycled content from 23% in fiscal 2023 to 45% by end of fiscal 2025. While we did not meet the 50% target, our teams drove innovation and deepened collaboration across our supply chain, resulting in an increase in recycled plastic use. Key accomplishments between fiscal 2023 and fiscal 2025 include:
These efforts have laid a strong foundation for continued improvement as we strive to increase the use of recycled materials in our products.
Improving product performance while maintaining or reducing energy use allows us to address our most significant source of greenhouse gas (GHG) emissions, help meet the growing energy demands of artificial intelligence (AI) models, make our products more competitive, and help customers save on energy costs. Our Scope 3 emissions table provides more information on emissions from the use of our products and our progress toward our 2040 net-zero goal. Our focus areas for improving product efficiency include:
See new certifications for Cisco’s Nexus Switches, 8000 Series Routers, and Catalyst Smart Switches on the
ENERGY STAR registry.
Cisco designs its packaging with product protection as the top priority because repairing or replacing products that are damaged in transit creates additional business and environmental impacts. We have adopted Circular Design Principles — removing unnecessary packaging and choosing materials that are easy to recycle — which has contributed to Cisco's ability to reach our milestone goals. Cisco closely monitors evolving global packaging regulations to meet applicable requirements.
Beyond basic packaging and material requirements, Cisco employs the following principles to evaluate additional aspects of packaging design:
Packaging for new product introductions is also evaluated against Cisco's circular design criteria. For Cisco legacy products, including those produced by our acquired companies, we are working to incorporate packaging best practices.
Our fiber-based and rigid plastic packaging contains a minimum of 25% recycled content. What happens to our packaging at the end of its useful life influences how Cisco’s product packaging is designed. Most of our product packaging is made either of a single material or of multiple materials that are separable for recycling so they can be easily absorbed into local municipal recycling programs. Cisco does not collect used packaging, as shipping empty product packaging to Cisco for recycling would create unnecessary environmental impacts.
Customers’ ability to recycle our packaging depends on the recycling facilities in place in their location. The majority of Cisco product packaging is fiber-based corrugated material that is recyclable. The plastic used in Cisco packaging falls into categories identified by Resin Identification Codes 1 to 7. Cisco’s plastic components carry labels indicating their plastic recycling code number to support end-of-life recycling.
We strive to use recyclable packaging. However, sometimes there are limited options for alternative, sustainable materials. For example, foams, expanded polymers, and metallized antistatic bags are not easily recycled, but they are essential to the safe transport of many products. We make every attempt to minimize the volume of packaging materials we use.
Conventional foam is made from nonrenewable materials and is not widely recyclable. Cisco set a goal to reduce foam used in product packaging by 75% (by weight, from a fiscal 2019 base year) to divert waste from landfill and transition to circular packaging materials.
Since the 2019 announcement of the goal, we achieved:
Our Packaging Engineering team targeted packaging redesigns for products with highest foam usage or shipping volumes, and we remain committed to designing foam-free packaging wherever possible for long-term environmental and business benefits.
78% foam reduction by weight in packaging since 2019
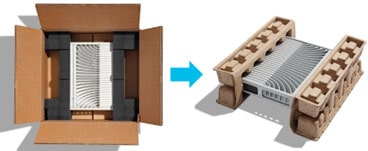
Designing for packaging efficiency reduces material use and shrinks the overall carton size, while simultaneously providing an appropriate level of product protection. A more efficient package reduces waste and GHG emissions from transport. Packaging efficiency is measured by comparing actual weight to dimensional weight. Dimensional weight is calculated by multiplying the length, width, and height of the carton and dividing by a dimensional factor. Reducing the gap between dimensional weight and actual weight indicates a reduction in excess space. Cisco measures progress toward packaging efficiency achieved through packaging redesigns.
In fiscal 2025, we reached 73% cumulative improvement, exceeding our fiscal 2025 packaging efficiency goal of 50%.
Cisco continues to explore alternatives to plastic-based stretch wrap to stabilize and protect palletized products in transit. In fiscal 2019, we piloted reusable pallet wraps in our operations and continued to use reusable wraps through fiscal 2025. This effort allowed us to avoid the use of 125 metric tonnes of plastic wrap over six years, which is equivalent to over 22 million plastic shopping bags.
Cisco packaging engineers also work closely with our upstream supply chain partners to develop packaging that can be reused throughout the manufacturing process. For example, Cisco’s “box patch” program helps our supply chain partners avoid wasted material from reboxing and emissions associated with returns of damaged goods. The "box patch" is an adhesive label that covers minor cosmetic damage that can occur during shipping. These processes prevent the need for reboxing and shipping between supply chain partners, reducing corrugated waste and transportation emissions while avoiding shipping delays.
A life cycle assessment (LCA) is used to model the environmental impacts of a product across multiple impact categories over the product life cycle, from cradle to grave. We use LCAs to quantify key environmental impacts of our products, identify hot spots for continuous product design and operational improvement, and work to identify opportunities to reduce resources used throughout our supply chain.
Cisco’s LCA methodology aligns with International Organization for Standardization (ISO) 14040:2006, and we use the five product life cycle stages defined by the GHG Protocol in the Product Life Cycle Accounting and Reporting Standard, in accordance with ISO 14040:2006 and ISO 14044:2006 standards:
Over the course of fiscal 2025, we increased the number of LCAs completed for our products to better reflect Cisco’s vast product portfolio, and several of these LCA reports have been published on our new Environmental Impact webpage. Customers and partners can use these reports to understand the impact of the products they purchase from Cisco and to support GHG emissions reporting. The published LCA reports span multiple product types, including switches, routers, and access points. One LCA study compares a Cisco 8000 series router with its previous generation and analyzes how the impacts change. More information on our process and strategy can be found in our Environmental Impact Frequently Asked Questions document.
In fiscal 2025, we further enhanced our scalable LCA model by incorporating primary data to more accurately reflect our supply chain processes. We also received third-party verification that our LCA assessments are in alignment with ISO 14040:2006 and ISO 14044:2006 standards.
Due to increasing stakeholder interest in GHG impact specifically, the primary focus of our LCA work is to develop Product Carbon Footprints (PCFs), which analyze the GHG emissions impact of our products. In general, our PCF work has shown that our products generate the most GHG emissions during the product-use life cycle phase.
To respond to stakeholder requests for PCFs, we built a Scalable PCF Model that can estimate the GHG emissions for most hardware products across our portfolio. In fiscal 2025, we received third-party verification that our assessments and methodology are in alignment with ISO 14067:2018.
Cisco actively participates in developing more robust and comparable PCF and LCA standards and tools by providing ongoing input to various working groups, particularly those shaping the Product Attribute to Impact Algorithm (PAIA) methodology and tools for PCFs. For details on the PAIA consortium and other Cisco initiatives, refer to the list of initiatives and organizations with which we participate.
Ecolabels are applied to products to support an environmental claim, and are defined as:
When applicable, Cisco’s products are evaluated against the following Type I ecolabels: ENERGY STAR®, Electronic Product Environmental Assessment Tool (EPEAT), and 80 PLUS. ENERGY STAR looks at the energy efficiency of the product, while EPEAT evaluates a larger set of environmental and social criteria related to each product.
Cisco has products certified to the ENERGY STAR standard under the Enterprise Servers, Large Network Equipment, and Telephones categories. Cisco also has EPEAT-registered products under the Servers category listed in EPEAT's online registry, and PSUs that are certified to 80 PLUS, a program specifically for PSU efficiency. These certified PSUs can be found on CLEAResult's online database.
An Environmental Product Declaration (EPD) is a Type III ecolabel. The claim must be independently verified and developed using product category rules (PCRs). At this time, there are no published PCRs that apply to Cisco's products; therefore, we are unable to generate EPDs.
Cisco enables customers to advance circularity through their purchasing decisions.
Cisco’s certified remanufactured products are backed by the same Cisco warranty and service options as new products. Equipment is sold through Cisco authorized resellers and is available in more than 100 countries.
The promotion allows partners and distributors to boost their profitability and maximize customer relationships with competitive pricing on industry-leading network solutions, which includes increased discounts on select areas, including switching, routing, wireless, IP telephony, security, and other advanced technologies.
Visit this blog for more information on Cisco Refresh's Circularity Promotion.
This IT payment solution that supports circularity makes it easier for customers to build a strategy that supports their sustainability goals. The program offers predictable payments, an up-front incentive, free returns shipping, and a Circular Economy Program confirmation on returned assets. Learn how DLL took advantage of Green Pay.
The Cisco partner ecosystem is an important network of companies that we collaborate with to deliver our technology solutions and services to customers worldwide. We provide our partners with the tools, education, and data needed to build a robust sustainability practice focused on circularity, reducing environmental impact, and driving customer value.
Central to the concept of a circular economy is maintaining assets at their highest and best use for as long as possible. Cisco’s programs facilitate product returns for reuse and recycling, offer comprehensive service and repair, and remanufacture used equipment for sale through Cisco Refresh. These programs create a second life for equipment, saving resources required for new manufacturing and reducing waste.
Cisco was an original signatory of the Capital Equipment Pledge, committing to 100% product return upon request, at no cost to our customers, in feasible markets. In support of the pledge, our Cisco Takeback and Reuse Program is currently available in more than 100 countries globally.
Cisco’s Supply Chain Services & Logistics organization supports customer and partner hardware Return Material Authorizations (RMAs). We optimize our network and inventory levels as parts are used, customers deploy new products, and hardware becomes obsolete. We replace, recover, and refurbish equipment and components through an extensive logistics, warehouse, planning, and repair operations network to maximize products’ useful life. Devices are repaired and tested to support adherence to the latest manufacturing specifications.
The Customer Experience Intelligent RMA Experience (IRE) program aims to accelerate the resolution of cases involving an RMA and to enable a seamless RMA experience requiring minimal touch for the customer, reducing risk of damage to the product. IRE provides RMA support using an AI/machine learning prediction engine and robotic process automation. In fiscal 2025, IRE helped avoid nearly 13,397 RMAs through automation of workflows to troubleshoot some of the most common issues with products in the field. This process helps reduce GHG emissions and supports Cisco’s circular economy efforts.
The Returns Portal is an online destination for customers and partners to find consolidated information for Cisco returns. Some returns programs include the following:


Returned devices that can be reused are remanufactured and either resold by Cisco Refresh, or used by Cisco service operations or our internal labs. Products that are not reusable are harvested for components and recycled by one of our authorized recyclers.
Cisco rigorously assesses returned products for their condition and reuse eligibility. Those deemed usable or repairable, and for which there is demand, undergo thorough testing and/or repair to ensure they meet our quality standards. To prioritize data security, all data is sanitized to National Institute of Standards and Technology (NIST) 800-88 R1 specifications before the product is prepared for reuse. Products are either returned to stock, repaired, or sent to the Repo Depo to internally redistribute lab equipment. In fiscal 2025, Repo Depot redistributed 16,295 items, diverting approximately 82,777 pounds of equipment from Cisco’s recycling stream.
Cisco’s contracted recyclers are certified to one or more e-scrap-specific recycling standards, such as R2, R2 RIOS, eStewards, and WEEELABEX. We preapprove all recycling companies and locations before sending Cisco equipment for processing, and mandate periodic reporting and enforcement of our processes with subcontractors.
Recyclers may harvest processors, memory, and other hardware with sufficient market value to offset the cost of their harvesting, cleaning, packaging, and resale. Harvested components must be cleared of data in compliance with the NIST 800-88 R1 standard before being available for resale.
Steel, aluminum, cardboard, plastic, wire/cable, and printed circuit boards (PCBs) are removed from units. PCBs are shredded and sorted further before going to a specialized smelter where copper, palladium, silver, and gold are recovered. These metals are then sold on the global metals markets. Other materials, including batteries or packaging materials, are sent to downstream recyclers to become raw material inputs for new products.
Read about Cisco’s Environmental Management System and compliance with relevant environmental regulations, such as Waste Electrical and Electronic Equipment (WEEE), Battery & Packaging Compliance, under Environmental Standards and Compliance.
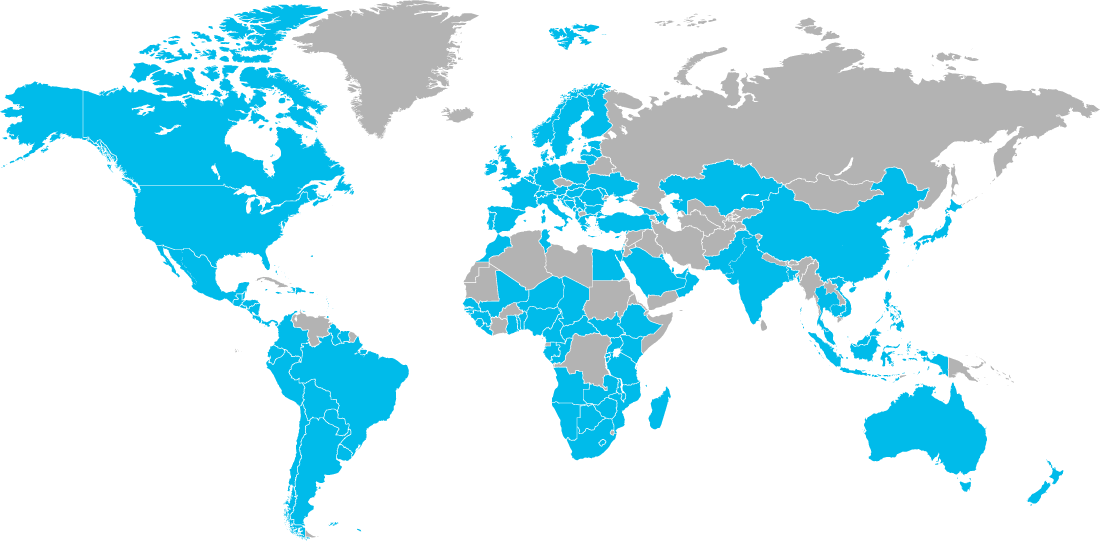
Map current as of FY25
As Cisco takes a holistic approach to reducing the environmental impact of our products across the product life cycle, we have three areas of focus:
Circular Design: Apply circular design principles to our products and packaging and optimize product life cycles from the start.
Circular Offerings: Enable customers and partners to adopt circularity through a portfolio of offers, including Cisco Refresh and Green Pay.
Recover & Redeploy: Recapture hardware to advance a circular life cycle and extend the lifespan of products.
Material use: Incorporate recycled content into our products, reduce the use of nonrenewable materials, and consider resource scarcity risks as part of material selection.
Standardization and modularization: Standardize and modularize components and enclosures to simplify our supply chain and enable reuse, repair, remanufacturing, and recycling.
Packaging and accessories: Use recycled and renewable packaging materials, reduce foam and plastic use, move toward fiber-based designs, eliminate unused accessories, and increase packaging efficiency.
Smart energy consumption: Improve product energy efficiency through activity-based power and power management features.
Disassembly, repair, and reuse: Design products with easily separable components that use similar materials to facilitate reuse, repair, remanufacturing, and recycling.
FY21: Launch
FY22: Pilot
FY23: Deploy
FY24: Scale
FY25: Evolve
| Manufacturing | Transport | Use | Disposal | Reuse | |
|---|---|---|---|---|---|
| Abiotic Depletion Potential | Manufacturing99.0% | Transport0.1% | Use0.4% | Disposal0.0% | Reuse0.0% |
| Global Warming Potential | Manufacturing14.3% | Transport0.5% | Use85.2% | Disposal0.0% | Reuse0.0% |
| Primary Energy Demand | Manufacturing12.5% | Transport0.4% | Use87.2% | Disposal0.0% | Reuse0.0% |
| Blue Water Consumption | Manufacturing23.8% | Transport0.1% | Use76.2% | Disposal0.0% | Reuse0.0% |
Note: Numbers may not add up to 100% due to rounding.