WAAS:NFS AOのトラブルシューティング
章:NFS AOのトラブルシューティング
この記事では、NFS AOのトラブルシューティング方法について説明します。
主要記事
WAASのアーキテクチャとトラフィックフローについて
WAASの事前トラブルシューティング
最適化のトラブルシューティング
アプリケーションアクセラレーションのトラブルシューティング
CIFS AOのトラブルシューティング
HTTP AOのトラブルシューティング
EPM AOのトラブルシューティング
MAPI AOのトラブルシューティング
NFS AOのトラブルシューティング
SSL AOのトラブルシューティング
ビデオAOのトラブルシューティング
汎用AOのトラブルシューティング
過負荷状態のトラブルシューティング
WCCPのトラブルシューティング
AppNavのトラブルシューティング
ディスクおよびハードウェアの問題のトラブルシューティング
シリアルインラインクラスタのトラブルシューティング
vWAASのトラブルシューティング
WAAS Expressのトラブルシューティング
NAM統合のトラブルシューティング
内容
NFSアクセラレータのトラブルシューティング
NFSアクセラレータは、NFSv3トラフィックを最適化します。他のNFSバージョンは、NFS AOによって最適化されません。
一般的なAOの設定とステータスは、show acceleratorコマンドとshow licenseコマンドで確認できます(「Troubleshooting Application Acceleration」の記事を参照してください)。NFSアクセラレータの操作には、Enterpriseライセンスが必要です。
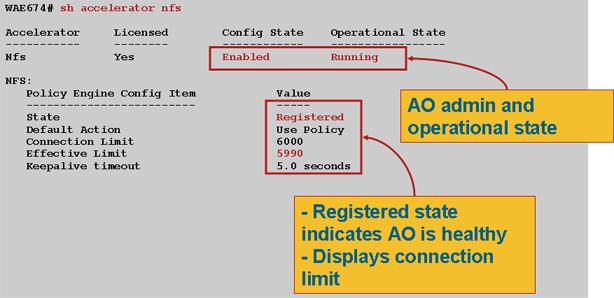
次に、図1に示すようにshow accelerator nfsコマンドを使用してNFS AO固有のステータスを確認します。NFS AOが有効、実行中、登録済みであり、接続制限が表示されることを確認します。Config StateがEnabledで、Operational StateがShutdownの場合は、ライセンスの問題を示しています。
- 図1. NFSアクセラレータのステータスの確認
show running-configコマンドを使用して、NFSトラフィックポリシーが正しく設定されていることを確認します。ファイルシステムのアプリケーション分類子NFSアクションに対するNFSの高速化を表示し、NFS分類子に対して適切な照合条件を次のように表示する必要があります。
WAE674# sh run | include NFS
      name File-System classifier NFS action optimize full accelerate nfs       <-------------
WAE674# sh run | begin NFS
...skipping
   classifier NFS
      match dst port eq 2049                                                    <-------------
   exit
show statistics connection optimized nfsコマンドを使用して、WAASデバイスが最適化されたNFS接続を確立していることを確認します。NFS AOが使用されたことを示す、NFS接続用の[Accel]列に[N]が表示されることを確認します。
WAE674# sh stat conn opt nfs
D:DRE,L:LZ,T:TCP Optimization,
C:CIFS,E:EPM,G:GENERIC,H:HTTP,M:MAPI,N:NFS,S:SSL,V:VIDEO,

ConnID  Local IP:Port         Remote IP:Port        PeerID             Accelerator
582     10.56.94.101:33606    10.56.94.80:2049      0:1a:64:d3:2f:b8   NTDL         <-----Look for "N"
show statistics accelerator nfsコマンドを使用して、次の項目を確認します。
- NFSトラフィックはNFSv3です。[NFSバージョンあたりのRPC呼び出し合計]フィールドを確認してください。このフィールドの出力は5つの値の配列で、主に4番目のカウンタで報告されるNFSv3トラフィックを表示します。その他のアレイ位置の数が多い場合は、他のNFSバージョンを意味します。
- NFSトラフィックは暗号化されません。[Total RPC Calls per Authentication Flavor]フィールドを確認します。このフィールドの出力は4つの値の配列で、最初の3つのカウンタに対応する暗号化されていないトラフィックがほとんど表示されます。最後のカウンタの値が大きい場合は、暗号化されたNFSトラフィックを示します。また、[Total RPC Calls with Unknown Authentication Flavor]フィールドをチェックします。これらの接続は最適化されていないため、0または小さい数字を表示します。
- NFS接続は非同期です。Percentage of Requests Served Locallyフィールドがゼロでないことを確認します。
WAE# sh statistics accelerator nfs

NFS:
  Global Statistics
  -----------------
  Time Accelerator was started:                                      Fri Oct 23
16:40:06 2009
  Time Statistics were Last Reset/Cleared:                           Fri Oct 23
16:40:06 2009
  Total Handled Connections:                                         170
  Total Optimized Connections:                                       170
  Total Connections Handed-off with Compression Policies Unchanged:  0
  Total Dropped Connections:                                         0
  Current Active Connections:                                        0
  Current Pending Connections:                                       0
  Maximum Active Connections:                                        13
  Total RPC Calls per Authentication Flavor:                         65
298544    0         0                                                          <----Should see 0 or few in last field
  Total RPC Calls with Unknown Authentication Flavor:                0         <----Should see 0 or few
  Total RPC Calls per NFS Version:                                   0
0         0         298609    0                                                <----Should see 0 or few in first two and last fields
  Total RPC Calls with Unknown NFS Version:                          0         <----Should see 0 or few
  Total Requests:                                                    298609
  Total Local Replies:                                               191713
  Percentage of Requests Served Locally:                             64        <----Should be nonzero
  Percentage of Requests Served Remotely:                            36
  Average Time to Generate Local READ Reply (ms):                    15
  Average Time to Generate Local WRITE Reply (ms):                   0
  Average Time to Generate Local GETATTR Reply (ms):                 0
  Average Time to Generate Local Reply (ms):                         0
  Average Time to Receive Remote Reply (ms):                         10
  Meta-Data Cache Access Count:                                      206017
  Meta-Data Cache Hit Count:                                         191673
  Remaining Number Of Entries in Meta-Data Cache:                    128926
  Meta-Data Cache Hit Ratio:                                         93
NFS接続の統計情報を表示するには、次のようにshow statistics connection optimized nfs detailコマンドを使用します。
WAE674# show stat conn opt nfs detail
Connection Id:            1916
   Peer Id:                  00:14:5e:84:24:5f
   Connection Type:          EXTERNAL CLIENT
   Start Time:               Thu Jun 25 07:09:09 2009
   Source IP Address:        10.10.10.20
   Source Port Number:       928
   Destination IP Address:   10.10.100.102
   Destination Port Number:  2049
   Application Name:         File-System                                  <-----Should see File-System
   Classifier Name:          NFS                                          <-----Should see NFS
   Map Name:                 basic
   Directed Mode:            FALSE
   Preposition Flow:         FALSE
   Policy Details:
          Configured:        TCP_OPTIMIZE + DRE + LZ
             Derived:        TCP_OPTIMIZE + DRE + LZ
                Peer:        TCP_OPTIMIZE + DRE + LZ
          Negotiated:        TCP_OPTIMIZE + DRE + LZ
             Applied:        TCP_OPTIMIZE + DRE + LZ
   Accelerator Details:
               Configured:   NFS                                          <-----Should see NFS configured
                  Derived:   NFS
                  Applied:   NFS                                          <-----Should see NFS applied
                     Hist:   None
                                               Original            Optimized
                                   -------------------- --------------------
   Bytes Read:                                     5120                 4639
   Bytes Written:                                 28136                 1407
. . .

NFS : 1916

   Time Statistics were Last Reset/Cleared:                           Thu Jun 25
 07:09:09 2009
   Total Bytes Read:                                                  5120
28136
   Total Bytes Written:                                               28136
5120
   Bit Flags for I/O state:                                           19
   Histogram of Buffers Read From Local Endpoint:                     31
1         0         0         0
   Total NFS Requests:                                                32
   Total Replies Served Locally:                                      4
   Percentage of Requests Served Locally:                             12
   Percentage of Requests Served Remotely:                            88
   Average Time to Generate Local READ Reply (ms):                    0
   Average Time to Generate Local WRITE Reply (ms):                   0
   Average Time to Generate Local GETATTR Reply (ms):                 0
   Average Time to Generate Local Reply (ms):                         0
   Average Time to Receive Remote Reply (ms):                         103
   Total RPC Procedure Calls:                                         0
9         0         10        7         0         4         1         0
0         0         0         0         0         0         0         0
1         0         0         0         0
. . .

 Total Unknown RPC Procedure Calls:                                    0
  Total Write RPCs Using Stable-how Enumerated Values:               0
0         1
  Total WRITE RPCs with Invalid Stable-how Value:                    0
  Bytes Buffered for READ Purpose:                                   0
  Start Time of Session:                                             Thu Jun 25
07:09:09 2009

  Meta-Data Cache Access Count:                                      9
  Meta-Data Cache Hit Count:                                         4
  Remaining Number Of Entries in Meta-Data Cache:                    1000
  Meta-Data Cache Hit Ratio:                                         44
  Current number of entries in Meta-Data Cache:                      0
. . .
NFS AOロギング
NFS AOの問題のトラブルシューティングには、次のログファイルを使用できます。
- トランザクションログファイル:/local1/logs/tfo/working.log(および/local1/logs/tfo/tfo_log_*.txt)
- デバッグログファイル:/local1/errorlog/nfsao-errorlog.current(およびnfsao-errorlog.*)
デバッグを簡単にするには、まずACLを設定して、パケットを1つのホストに制限する必要があります。
WAE674(config)# ip access-list extended 150 permit tcp host 10.10.10.10 any
WAE674(config)# ip access-list extended 150 permit tcp any host 10.10.10.10
トランザクションロギングを有効にするには、次のようにtransaction-logs設定コマンドを使用します。
wae(config)# transaction-logs flow enable
wae(config)# transaction-logs flow access-list 150
トランザクション・ログ・ファイルの終わりを表示するには、type-tailコマンドを使用します。
NFS AOのデバッグログを設定および有効にするには、次のコマンドを使用します。
注:デバッグロギングはCPUに負荷がかかり、大量の出力を生成する可能性があります。実稼働環境では慎重に慎重に使用してください。
ディスクへの詳細なロギングは、次のように有効にできます。
WAE674(config)# logging disk enable
WAE674(config)# logging disk priority detail
ACLの接続のデバッグロギングは、次のように有効にできます。
WAE674# debug connection access-list 150
NFS AOデバッグのオプションは次のとおりです。
WAE674# debug accelerator nfs ?
  all               enable all accelerator debugs
  async-write       enable async write optimization debugs
  attributes-cache  enable attributes-cache optimization debugs
  nfs-v3            enable NFSv3 layer debugs
  read-ahead        enable read ahead optimization debugs
  rpc               enable RPC layer debugs
  shell             enable shell (infra) debugs
  utils             enable utils debugs
NFS接続のデバッグログを有効にして、デバッグエラーログの最後を次のように表示できます。
WAE674# debug accelerator nfs all
WAE674# type-tail errorlog/nfsao-errorlog.current follow
 フィードバック