Access Point Deployment Information
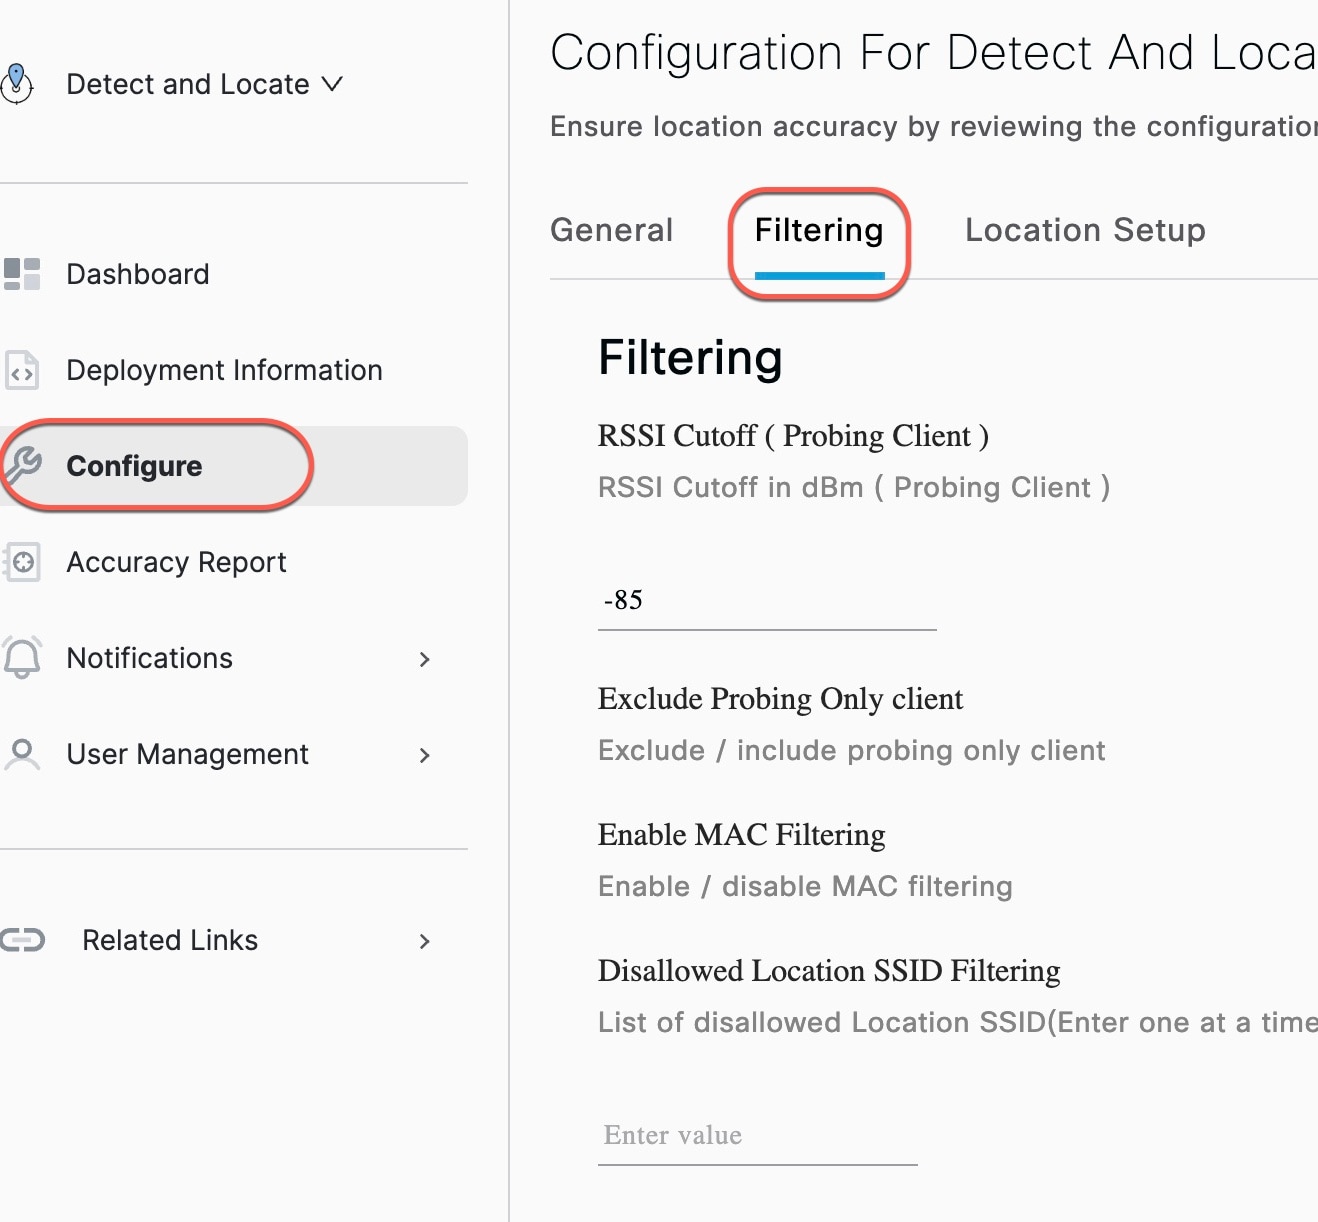
The Deployment Information dashboard provides an overview of Access Points (APs) with respect to the Wireless Controller and available floor maps in the account. The dashboard displays information based on devices reporting within the last hour and the Filtering settings configured in the Cisco Spaces: Detect and Locate app.
 Note |
The consolidation of reporting APs occurs over an hour period, after which the report is published. The current report may differ from previous reports due to devices entering and leaving the network. |
It captures data related to reporting (active) and missing APs only after applying all selected filters to the incoming data. For example, when you enable the Probing Client filter, the system excludes packets from probing devices and collects AP data only for the remaining devices. This does not mean other APs stop transmitting data; it simply indicates their data is excluded due to the applied filters.
Another instance of APs not transmitting data occurs when there are no devices to report on a given floor. As a result, APs flagged as inactive due to data unavailability in Cisco Spaces require cross-checking in Cisco Catalyst Center to confirm their uptime and health status. If the APs are confirmed as active in Cisco Catalyst Center, no further action is required.

In the AP Information area, view this information:
-
Reporting Data Active Access Points (APs)
-
Inactive APs
-
APs connected to wireless controller
-
APs you have placed on the uploaded map.
The Deployment Information window presents two graphs. One graph displays data collected from the wireless controller, while the other shows the same data gathered from the Cisco Spaces maps. Please compare the information in the two graphs.

Left Graph: Shows APs count in relation to wireless controller
-
APs Placed on Map: These are the APs that are both connected to a wireless controller and placed on the floor maps across any hierarchy, campus, or floor.
In the sample image, 20 APs are connected across all wireless controller, and seven of them are placed on the map.
-
APs Not Placed on Map: These are APs that are connected to an active wireless controller within the tenant but have not been placed on any map across any hierarchy, campus, or floor.
In the sample image, out of the 20 total connected APs, 13 are not placed on the Cisco Spaces map.
-
APs Sending Data: These are APs from which RSSI data has been received in the last one hour after the filters are applied.
In the sample image, 7 APs are sending RSSI data, that indicates that data is received from 7 out of the 20 total APs.
-
APs Not Sending Data: These are APs from which no RSSI data is received in the last one hour after the filters are applied.
In the sample image, 13 APs are not sending data, that indicates no RSSI data is reported from these APs, out of the total 20.
Right Graph: Shows Aps count in relation to floor maps
Inactive APs are displayed on the Cisco Spaces map, but they do not report the data they receive. The data is not reported because the APs are either not connected to the Wireless Controller or they are connected but not transmitting the measured data. You can find the specifics of this information by cross-referencing with the graphs.
-
APs Connected to Controller: These are APs that are currently connected to the wireless controller and also placed on the map across various hierarchies or campuses.
In the sample image, there are 37 APs placed on the map, out of which 13 are connected to the wireless controller.
-
APs Not Connected to Controller: These are APs that are placed on the map across any hierarchy, campus, or floor but are not currently connected to any controller in the tenant. This count may include AP's from previously added controllers that were never removed from the map.
In the sample image, there are 24 such APs placed on the map but not connected to any controller. Do not confuse this with the APs not sending data mentioned earlier. Those APs are connected to a controller but simply not placed on the map. In contrast, the 24 APs here are placed on the map but not connected to any controller.
-
Reporting (Active) APs: These are APs that are both placed on the map and have reported RSSI data within the last one hour.
In the sample image, 13 APs are active, placed on the map and sending RSSI data.
-
Inactive APs: These are APs that are placed on the map but have not reported any RSSI data in the last one hour. This includes APs that may no longer be connected to any wireless controller but are still visually present on the map.
In the sample image, 24 APs are inactive, meaning no recent RSSI data has been received from them.
 Note |
Each of the categories in both graphs displays detailed information when the respective buckets are clicked on. |
Detailed AP information
To see a more detailed list of APs in any of the category, click each metric. A slide-in pane is displayed with AP name, MAC address and wireless controller IP.

 Feedback