Presence Analytics
With the CMX location analytics, organizations get a lot of useful business intelligence from the wireless and location technologies. For location technology to work, you require precise maps and triangulated computation from at least three Access Points (APs). In case of organizations with one or two APs, it is not possible to do a triangulated location computation. With presence analytics, the organizations with one or two AP deployments can still use the wireless technology to understand the customer pattern and behavior.
Presence analytics is a comprehensive location analytics and engagement platform that detects presence of visitors via their mobile devices using the access points.
Cisco APs detects probing requests from wireless devices and forwards those messages to Wireless LAN Controllers (WLC) through Control and Provisioning of Wireless Access Points (CAPWAP) tunnel. The WLC sends those messages as measurement notifications to Mobility Services Engine (MSE) through (Network Mobility Services Protocol (NMSP) protocol. The probe requests are transmitted at regular intervals from the wireless devices and contain information that can be used to identify the visitor trends, dwell time, and new vs. repeat visitor information within a range of wireless hotspot. These devices can be detected by the access points irrespective of its wireless association state. Even if a device is not connected to the access point, its presence is still detected if the device is within the signal range and the wireless is turned on.
The presence analytics uses Received Signal Strength Indication (RSSI), along with the duration of high signal strength to determine whether a client device is in the site or just passing by. Data collected by the APs is reported in the Analytics dashboard.
- Location statistics to improve customer engagement and loyalty across sites.
- Insight into mobile behavior across locations and enables you to enhance your on site customer experience, make better decisions about how to engage the visitors, and optimize business strategies.
- Statistics on the number of first visitors vs. repeat visitors and number of devices passing by vs. devices spending time in the store.

Note![]() When the CMX analytics service is enabled, the presence analytics gets enabled. Presence works only on the access points that belong to a presence site. If you have not configured any presence sites, then no presence data will be collected and no dashboard wizards and reports will run.
When the CMX analytics service is enabled, the presence analytics gets enabled. Presence works only on the access points that belong to a presence site. If you have not configured any presence sites, then no presence data will be collected and no dashboard wizards and reports will run.
Importing Access Points
Since presence analytics does not require maps to be created, you should manually import access points from the Prime Infrastructure (PI) to Mobility Services Engine (MSE).
You can import access points from the PI to MSE in the following ways:
- Importing Access Points from the Prime Infrastructure NBAPI
- Exporting Access Points from the Prime Infrastructure Report
Importing Access Points from the Prime Infrastructure NBAPI
To import access points from the Prime Infrastructure (PI) Northbound API(NBAPI), follow these steps:
Step 1![]() Click the Settings icon located at the top right side of the CMX Analytics home page.
Click the Settings icon located at the top right side of the CMX Analytics home page.
The Presence Analytics tab appears.
Figure 6-1 Presence Analytics Tab
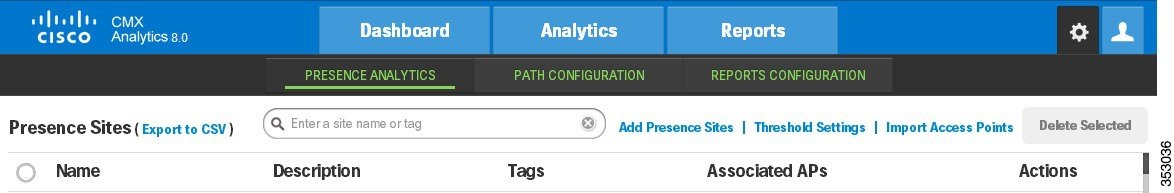
Step 2![]() Click the Import Access Points link. The page for importing access points from the PI appears.
Click the Import Access Points link. The page for importing access points from the PI appears.
Step 3![]() Enter the IP address or hostname of the server where you have installed the PI in the PI Host/IP text box.
Enter the IP address or hostname of the server where you have installed the PI in the PI Host/IP text box.
Step 4![]() Enter the PI username in the Username text box.
Enter the PI username in the Username text box.
Step 5![]() Enter the password in the Password text box.
Enter the password in the Password text box.
Step 6![]() Click Import to get all access points from the Prime Infrastructure into the presence analytics.
Click Import to get all access points from the Prime Infrastructure into the presence analytics.
Note![]() All access points will be imported. The access points that are already in the MSE will be preserved with original information.
All access points will be imported. The access points that are already in the MSE will be preserved with original information.
Exporting Access Points from the Prime Infrastructure Report
You can generate a report for access points in the Prime Infrastructure and import it to MSE. To export access point from the Prime Infrastructure report, follow these steps:
Step 1![]() Log into the Prime infrastructure user interface through a web browser.
Log into the Prime infrastructure user interface through a web browser.
Step 2![]() Choose Reports > Report Launch Pad.
Choose Reports > Report Launch Pad.
Step 3![]() Choose Device > Inventory from the left sidebar menu.
Choose Device > Inventory from the left sidebar menu.
This report allows you to generate inventory related information for access points, controllers, and MSEs managed by PI.
Step 5![]() In the Inventory Report Details page, configure the following:
In the Inventory Report Details page, configure the following:
- Report Title—Enter a report name.
- Report Type—Choose Combined Inventory report.
- Click Customize Report and configure the following:
–![]() Custom Report Name—Choose AP Inventory from the Custom Report Name drop-drop list.
Custom Report Name—Choose AP Inventory from the Custom Report Name drop-drop list.
–![]() Available data fields/Data fields to include—Use the Add > or < Remove buttons to move the highlighted fields between the Available data fields and Data fields to include columns. Ensure that AP Name is in the Data fields to include column.
Available data fields/Data fields to include—Use the Add > or < Remove buttons to move the highlighted fields between the Available data fields and Data fields to include columns. Ensure that AP Name is in the Data fields to include column.
–![]() Data field sorting—Indicate your sorting preference by the AP Name in the Data field sorting drop-down list.
Data field sorting—Indicate your sorting preference by the AP Name in the Data field sorting drop-down list.
- Scheduling—Select the Enable check box to run the report on the set schedule.
- Export Format—Choose CSV as format to export the report results after a report is run.
- Destination—Choose your destination type (File or Email). Enter the applicable file location or the email address.
- Click Save and Export.
Step 6![]() Click Download in the Export Results page.
Click Download in the Export Results page.
Step 7![]() Open the.csv file and remove all unrelated rows above and below the access point section.
Open the.csv file and remove all unrelated rows above and below the access point section.
Step 8![]() Save the.csv file. You can use this file while importing the site list. See Importing a site list.
Save the.csv file. You can use this file while importing the site list. See Importing a site list.
Managing Presence Sites
A presence site is nothing but a store with group of access points and associated attributes. Presence analytics works only on the access points that belong to a presence site. If you have not configured any presence site, then no presence data will be collected and no dashboard wizards and reports will run.
Note![]() You cannot assign the same access point to multiple presence sites.
You cannot assign the same access point to multiple presence sites.
You can chose one of the options for site listing:
Creating a Presence Site
To create a presence site, follow these steps:
Step 1![]() Click the Settings icon in the CMX Analytics home page.
Click the Settings icon in the CMX Analytics home page.
Step 2![]() Click the Add Presence Sites link.
Click the Add Presence Sites link.
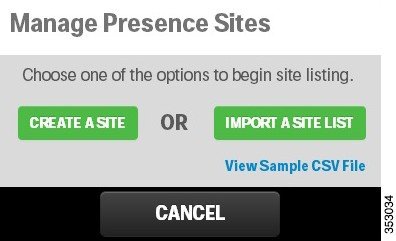
The Manage Presence Sites window appears.
The Create Presence Site Entries Sites window appears.
Step 4![]() Configure the following in the Create Presence Site Entries window:
Configure the following in the Create Presence Site Entries window:
- Presence Site Name—Enter a name for the presence site. A site name can be any store and must be unique between presence sites and location zones.
- (Optional) Presence Site Description—Enter a brief description for the presence site.
- (Optional) Tags—Mark presence sites with any additional tags or labels that can be used to filter the site list. You can tag sites by location, size of store, etc.
- To associate APs with the presence site, do the following:
–![]() For a quick search of the access points, enter a partial or complete AP name or IP address in the Associated Access Points search text box and select the appropriate AP name or IP address or select the radio button next to AP Name.
For a quick search of the access points, enter a partial or complete AP name or IP address in the Associated Access Points search text box and select the appropriate AP name or IP address or select the radio button next to AP Name.
Note![]() You can associate multiple access points to a site but cannot associate the same access points to multiple sites.
You can associate multiple access points to a site but cannot associate the same access points to multiple sites.
- (Optional) Expand the Threshold Settings panel and configure the following. You can specify threshold settings on each presence site that overrides the global settings inherited from the global settings. See Reports for more information.
–![]() Signal Strength—It is the measurement that a mobile device sends to the access point. You can use the sliders to either increase or decrease the threshold levels. Use the first slider to lower the threshold settings and the second slider to higher the threshold along with the dwell time to determine whether a device is in the site.
Signal Strength—It is the measurement that a mobile device sends to the access point. You can use the sliders to either increase or decrease the threshold levels. Use the first slider to lower the threshold settings and the second slider to higher the threshold along with the dwell time to determine whether a device is in the site.
–![]() Dwell—Dwell time is used along with the signal strength to determine whether a device is in the site or not.
Dwell—Dwell time is used along with the signal strength to determine whether a device is in the site or not.
Step 5![]() Click SAVE AND CREATE NEXT to create another presence site.
Click SAVE AND CREATE NEXT to create another presence site.
Step 6![]() Click SAVE AND CLOSE after creating all presence sites.
Click SAVE AND CLOSE after creating all presence sites.
The presence site created appears in the presence site list.
Importing a site list
To import a site list, follow these steps:
Step 1![]() Follow Step 1 through Step 8 to export access points from the Prime Infrastructure (PI) to Mobility Services Engine (MSE).
Follow Step 1 through Step 8 to export access points from the Prime Infrastructure (PI) to Mobility Services Engine (MSE).
Step 2![]() Click the Settings icon in the CMX Analytics home page.
Click the Settings icon in the CMX Analytics home page.
Step 3![]() Click the Add Presence Sites link.
Click the Add Presence Sites link.
Step 4![]() In the Manage Presence Sites window, click Import a Site List.
In the Manage Presence Sites window, click Import a Site List.
Step 5![]() Browse to and import the saved CSV file from anywhere in your file system, and click Open.
Browse to and import the saved CSV file from anywhere in your file system, and click Open.
Step 6![]() Click Confirm in the CSV Import dialog window.
Click Confirm in the CSV Import dialog window.
Editing a Presence Site
To edit a presence site, follow these steps:
Step 1![]() Click the Settings icon in the CMX Analytics home page.
Click the Settings icon in the CMX Analytics home page.
Step 2![]() From the Presence Sites list, select the radio button next to the presence name and click
From the Presence Sites list, select the radio button next to the presence name and click  icon.
icon.
The Modify Presence Site window appears.
Step 3![]() Make appropriate changes and click SAVE AND CLOSE.
Make appropriate changes and click SAVE AND CLOSE.
Deleting a Presence Site
You can either delete a single presence site or multiple sites. To delete a presence site, follow these steps:
Step 1![]() Click the Settings icon in the CMX Analytics home page.
Click the Settings icon in the CMX Analytics home page.
Step 2![]() To delete a single presence site, highlight and select the radio button next to presence site and click
To delete a single presence site, highlight and select the radio button next to presence site and click  icon.
icon.
Step 3![]() To delete multiple presence sites, select the sites radio button and click Delete Selected.
To delete multiple presence sites, select the sites radio button and click Delete Selected.
Step 4![]() Click Confirm in the confirmation dialog box to complete the deletion.
Click Confirm in the confirmation dialog box to complete the deletion.
Threshold Settings
Presence analytics uses signal strength of a device along with the duration of high signal strength to determine whether a client device is in the site or just passing by. Signal strength alone cannot determine if the device is in the site or not. Presence analytics uses the following two Received Signal Strength Indication (RSSI) threshold settings to determine whether a device is in the site or not:
- Lower threshold—The default lower threshold value is -95 dBm. You can ignore those devices whose RSSI is -95 dBm or lower.
- Higher threshold—The default higher threshold value is -65 dBm. If a device strength is higher than the higher threshold value for over X number of minutes, then that device is considered as visitor or in the store.
- Dwell—Dwell time is used along with the signal strength to determine whether a device is in the site or not.
You can manage threshold levels in the following ways:
Global Threshold Settings
The global threshold settings are default for all presence sites that do not have specific threshold settings. To set the global settings, follow these steps:
Step 1![]() Click the Settings icon in the CMX Analytics home page,
Click the Settings icon in the CMX Analytics home page,
The Presence Analytics tab appears.
Step 2![]() Click the Threshold Settings link.
Click the Threshold Settings link.
Step 3![]() Configure the following in the Threshold Settings window:
Configure the following in the Threshold Settings window:
- Signal Strength—You can use the sliders to either increase or decrease the threshold levels. Use the first slider to lower the threshold and the second slider to higher the threshold along with the dwell time to determine whether a mobile device is in the store.
- Dwell—Dwell time is used along with signal strength to determine whether a device is in the site.
Site Threshold Settings
You can specify threshold settings on each presence site that overrides the global settings inherited from the global settings. You can specify the threshold settings either while creating the presence site or while editing the presence site.
See Creating a Presence Site and Editing a Presence Site for more information.
Multi-Site Threshold Settings
To change the threshold settings for multiple sites, follow these steps:
Step 1![]() Click Settings icon in the CMX Analytics home page,
Click Settings icon in the CMX Analytics home page,
The Presence Analytics tab appears.
Step 2![]() Select multiple sites by clicking the radio button next to the presence site or for a quick search of the presence site, enter a partial or complete presence site name in the search box at the middle of the window and click Threshold Settings link.
Select multiple sites by clicking the radio button next to the presence site or for a quick search of the presence site, enter a partial or complete presence site name in the search box at the middle of the window and click Threshold Settings link.
Step 3![]() Make the necessary changes and click SAVE.
Make the necessary changes and click SAVE.
Adding a Widget for Presence Sites
To add a widget for presence site, follow these steps:
Step 1![]() Click the page selector icon located at the top left side of the dashboard page.
Click the page selector icon located at the top left side of the dashboard page.
Step 2![]() Click + Add Page from the left pane. Four widget dashlets appear in the right pane.
Click + Add Page from the left pane. Four widget dashlets appear in the right pane.
Step 3![]() Enter a name for dashboard in the Untitled Page text box and click Save. The newly added dashboard appears in the left pane.
Enter a name for dashboard in the Untitled Page text box and click Save. The newly added dashboard appears in the left pane.
Step 4![]() Click + Add Widget to add a new widget to the dashboard. Configure the following in the Add a Widget window:
Click + Add Widget to add a new widget to the dashboard. Configure the following in the Add a Widget window:
–![]() Dwell—Displays the average time that a device is spending in the site.
Dwell—Displays the average time that a device is spending in the site.
–![]() Device Count—Displays the number of devices in the site.
Device Count—Displays the number of devices in the site.
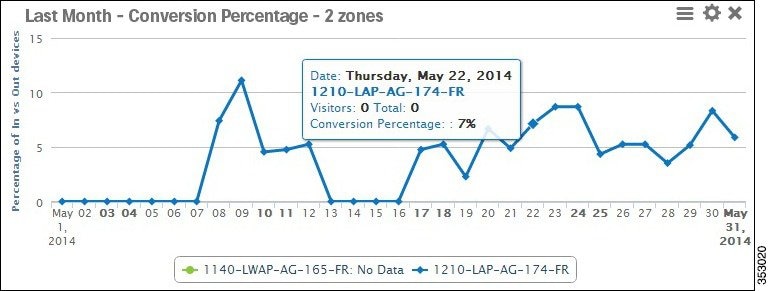
–![]() Conversion Percentage—Displays the ratio between the devices that are coming into the store vs devices that are passing by. Hover your mouse to see the number of visitors and total.
Conversion Percentage—Displays the ratio between the devices that are coming into the store vs devices that are passing by. Hover your mouse to see the number of visitors and total.
- Visualization tab—Choose the display format for your widget: Line Chart or Bar Chart.
- Zones tab—Select the presence site for analysis. You can either do a quick search of the presence site by entering a partial or complete site name in the search text box or select the presence site radio button.
- Date & time tab—Configure the following:
–![]() Click the calendar icon to choose the start date and end date or choose a preset value from the Select from a Preset drop-down list. The presets are Today, Yesterday, This Week, and
Click the calendar icon to choose the start date and end date or choose a preset value from the Select from a Preset drop-down list. The presets are Today, Yesterday, This Week, and
This Month.
–![]() Click the time icon to choose the time, hour, and minute or choose a preset value from the Select from a Preset drop-down list. The presets available are All day, Business hours,
Click the time icon to choose the time, hour, and minute or choose a preset value from the Select from a Preset drop-down list. The presets available are All day, Business hours,
Morning, Lunch time, Afternoon, and Evening.
Step 5![]() Click ADD WIDGET to add a this widget to the dashboard.
Click ADD WIDGET to add a this widget to the dashboard.
The newly added widget with the data appears in the dashboard. The data provides information on the visitor traffic trends, dwell time, new vs. repeated visitor, etc. You can make use of this statistics to improve the customer engagement.
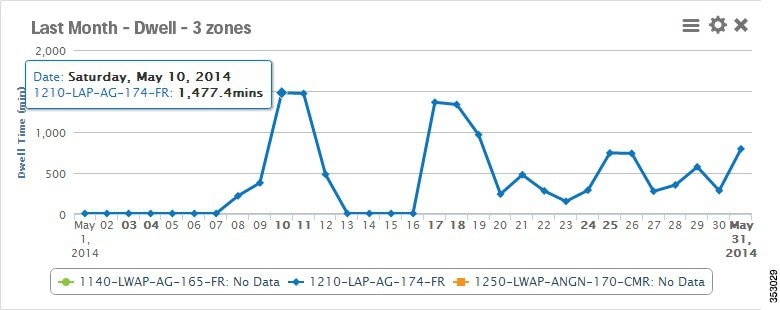
Figure 6-3 Device Count Wizard
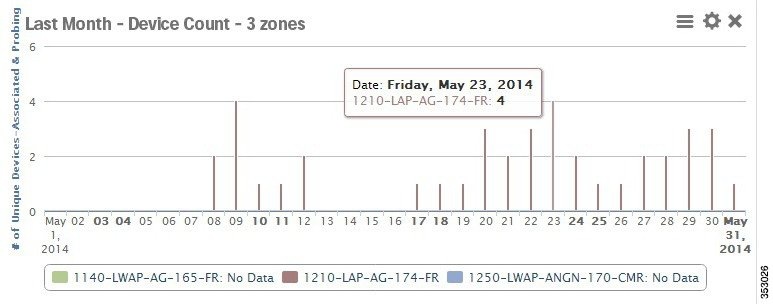
Figure 6-4 Conversion Percentage Wizard
Reports
Presence analytics supports the following reports. For more information on reports, see Chapter 7, “Reports”.
 Feedback