User Guide for Cisco Unified CVP VXML Server and Cisco Unified Call Studio Release 12.0(1)
Bias-Free Language
The documentation set for this product strives to use bias-free language. For the purposes of this documentation set, bias-free is defined as language that does not imply discrimination based on age, disability, gender, racial identity, ethnic identity, sexual orientation, socioeconomic status, and intersectionality. Exceptions may be present in the documentation due to language that is hardcoded in the user interfaces of the product software, language used based on RFP documentation, or language that is used by a referenced third-party product. Learn more about how Cisco is using Inclusive Language.
Logging plays an
important part in voice application development, maintenance, and improvement.
During development, logs help identify and describe errors and problems with
the system. Voice applications relying heavily on speech recognition require
frequent tuning in order to maximize recognition effectiveness. Voice
application design may also be changed often, taking into account the behaviors
of callers over time. The more information an application designer has about
how callers interact with the voice application, the more that can be done to
modify the application to help callers perform their tasks faster and easier.
For example, a
developer could determine the most popular part of the voice application and
make that easier to reach for callers. If a large proportion of callers ask for
help in a certain part of the application, the prompt might need to be
rewritten to be clearer. After analyzing the declaration of various callers,
the effectiveness of grammars can be determined so that additional words or
phrases can be added or removed. None of this is possible without detailed logs
of caller behavior. While each component of a complete VRU system, such as the
voice browser and speech recognition system provide their own logs, VXML Server
provides logs that combine all this information with the application logic.
This chapter explains the details of logging on VXML Server.
Because of the
importance of logging, VXML Server has been designed to offer the maximum
flexibility with regards to what can be logged, how it is logged, and where it
is logged. The logs generated by VXML Server by default can be customized to
fit the needs of a deployment. In addition, a Java API exists that allows
developers to create their own ways of handling logging for better integration
with the deployed environment or tailored specifically for special needs.
Loggers
VXML Server handles
all logging activity through the use of loggers. Loggers are plug-ins to VXML
Server that listen for certain logging events and handle them in a custom
manner, from storing the information in log files, sending the information to a
database, or even to interface with a reporting system. Any number of loggers
can be used, even multiple instances of the same logger. A logger may or may
not require a configuration that will allow the designer to customize how the
logger performs.
VXML Server comes with
several loggers that provide all necessary information in text log files. Some
provide configurations to allow for a level of customization in how the loggers
perform. VXML Server exposes a Java API to allow developers the flexibility of
creating their own loggers to allow for even more customization. See the
Programming Guide for Cisco
Unified CVP VXML Server and Cisco Unified Call Studio
for detailed information on how to build custom loggers.
VXML Server
communicates with loggers by triggering logging events that the loggers listen
for and then deal with. VXML Server activates loggers in a fully multithreaded
environment to maximize performance.
Loggers are divided
into two categories: global loggers and application loggers. Global loggers are
activated by logging events that apply to VXML Server as a whole and that is
not directly related to any particular application (for example, a record of
all calls made to the VXML Server instance). Application loggers are activated
by logging events that apply to a particular application running on VXML Server
(for example, a call visiting an element). Each logger type is constructed
using separate Java APIs and deals with a separate list of possible logging
events . Each logger type is also given a separate area to store logs, although
a logger may choose to ignore this area if it does not log to files.
Global
Loggers
The
global_config.xml file found in the
conf
directory of
%CVP_HOME%\VXMLServer is used to define the global
loggers VXML Server is to use. The administrator can define any number of
global loggers to be simultaneously active, even multiple instances of the same
logger class. This file also lists the names of the configuration files for
these loggers, if they are configurable. The configuration files must be placed
in the same conf directory as the
global_config.xml file. The
global_config.xml file and any configuration files must
be edited by hand, there is no interface for editing them. Refer to
VXML
Server Configuration for more details about this file and how to define
global loggers within it.
Global loggers are
loaded by VXML Server when it starts up and remain in memory until it is shut
down. Any change made to the
global_config.xml file is not loaded until VXML Server
is restarted.
VXML Server provides
the
logs
folder of
%CVP_HOME%\VXMLServer for log file storage if the
Global Loggers require it. To keep each logger instance’s logs separate, a
subfolder with the name of the logger instance is created, and all logs
generated by the logger instance are stored there.
By default, VXML
Server utilizes three loggers to create text log files containing VXML
Server-specific information: a log that keeps track of calls made to the
system, a log for tracking VXML Server administration activity, and an log that
shows errors that occur on the VXML Server level (as opposed to the application
level). The global error logger requires a configuration that allows for
detailed control over how the logger operates.
The following sections
describe these three prebuilt global loggers, their configurations (if any),
and the information stored in their logs.
Global Call
Logger
The global call logger
records a single line for every application visit handled by VXML Server into a
text call log. Most calls will begin and end in a single application so in that
case a line in the call log is equivalent to a physical phone call. For
situations where one application performs an application transfer to another
application, a separate line will be added to the call log for each application
visit despite the fact that they all occur in the same physical call. Because
each application visit is logged separately in each application’s own log file,
the call log provides a way to stitch together a call session that spans
multiple applications.
The call log file
names are in the format
call_logYYYY-MM-DD.txt where
YYYY,
MM, and
DD are the year,
month, and day when the call log was first created. By default, the log folder
for is named
GlobalCallLogger
(though the name is set in the
global_config.xml file and can be changed by the
administrator). Call log files are rotated daily. The file is organized in a
comma-delimited format with 6 columns:
CallID—This is a
nonrepeating value generated by VXML Server to uniquely identify calls. It is
designed to be unique even across machines, because the log files of multiple
machines running the same applications may be combined for analyses. The format
of the session ID is IP.SECS.INCR where IP is the IP address of the VXML Server
instance on which the call originated, SECS is a large integer number
representing the time the application visit was made and INCR is an
automatically incremented number managed by VXML Server. Each part is delimited
by dots and contains no spaces. For example: 192.168.1.100.1024931901079.1.
Note
If a voice
application uses a Subdialog Invoke element to transfer across multiple VXML
Server instances, the IP address included in the CallID is the IP address of
the instance the call started on. Because of this, it is possible that a CallID
in log files on one machine may contain an IP address for another machine. This
allows a physical call to be traced across multiple servers (from a logging
standpoint), even if Subdialog Invoke is used to transfer to between various
voice applications.
SessionID—The session ID
is used to track a visit to a specific application. Therefore, with application
transfers, one call ID may be associated with multiple session IDs. For this
reason, session IDs are basically the call ID with the application name
appended to the end. For example: 192.168.1.100.1024931901079.1.MyApp.
callers—This integer
represents the total number of callers interacting with the system at the time
the call was received (excluding the current call).
order—A number indicating
the order of each application visited in a call. The order begins at 1. This
column exists to report the order in which a caller visited each application
should the data be imported to a database.
Application—The name of
the application visited.
Time—A timestamp of the
application visit in the format
MM/DD/YYYY
HH:MM:SS.MMM where the hour is in 24-hour time and
MMM
represents a 3-digit millisecond value. This represents when the call was
received or the application transfer occurred.
Global Error
Logger
The Global Error
Logger records errors that occur outside the realm of a particular application.
Application-level errors are logged by application-level loggers, which are
described later in this chapter. Another type of error that the Global Error
Logger receives is an application-level error that encountered trouble with its
logging. In order to prevent the loss of the data, VXML Server activates a
global logger event with the original application error as a backup.
The error log file
names are in the form
error_logYYYY-MM-DD.txt where YYYY, MM, and DD are the year,
month, and day when the error log was first created. By default, the log folder
is named
GlobalErrorLogger (though the name is set in the
global_config.xml file and can be changed by the
administrator). Global error log files are rotated daily.
Note
If no error
occurred on a particular day, no error log is created.
The file is organized
in a comma-delimited format with 2 columns:
Time—The time the error
occurred.
Description—The error
description. One possible value can be
max_ports,
indicating the caller was put on hold because all the Unified CVP license ports
were taken. While the call was eventually handled correctly, this is placed
here as a notice that the license may not have enough Unified CVP ports to
match caller volume. Another value is
bad_url:[URL], indicating that a request was made to VXML
Server for a URL that could not be recognized. This most likely will occur if
the voice browser refers to an application that does not exist. The last
description is error, indicating that some other error occurred.
Note
The global error
log is not designed to be parsed, even though the columns are separated with
commas. This is because when the error log reports a Java-related error, it may
include what is called a
Java stack
trace, which contains multiple lines of output.
The Global Error
Logger utilizes a configuration to control how it logs certain types of errors
and how often the log files should be purged. The configuration is specified as
an XML file created by the designer and placed in the
conf
directory of
%CVP_HOME%\VXMLServer.
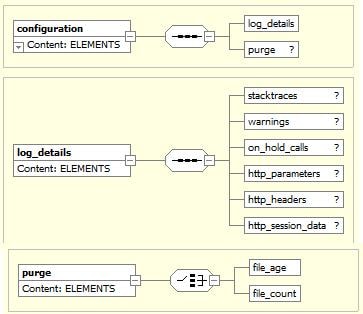
Figure 1. Global Error
Log Configuration
The
Global Error Log
Configuration diagram displays the format for the XML Global Error Logger
configuration file. The main tag for the configuration,
configuration, has two attributes,
name
and
version.
Name
is expected to contain the logger instance name. The
version is expected to include the version of the
configuration, which is currently
1.0. The
subsequent sections describe the functionality of the various tags in the
configuration.
Global Error Logger Configuration: Log Details
The
<log_details> tag controls which errors to log
and what information to include about those errors. The possible child tags
are:
<stacktraces>—Indicates that any Java errors that
occur should also have their stack traces printed in the log. The absence of
this tag indicates not to include stack traces.
<on_hold_calls>—Indicates that a call that was put on
hold should be logged. The
application_name attribute can have the values
true and
false,
true being
to include the name of the application the caller attempted to reach when being
put on hold and
false to not
include the application name.
<http_parameters>—Indicates that an error caused by an
unrecognized URL (such as a request for an application that does not exist)
should include the HTTP parameters passed to the URL. This tag can be helpful
to know since it could help determine why the request was made. The
length attribute provides a limit, in a number of
characters, to be included in the log. This prevents the log from being filled
up with too much parameter data.
Note
The parameter
data appears on one line, no matter how long.
<http_headers>—Indicates that an error caused by an
unrecognized URL (such as a request for an application that does not exist)
should include the HTTP headers passed to the URL. This can be helpful to know
since it could help determine why the request was made. The
length attribute provides a limit, in a number of
characters, to be included in the log. This tag prevents the log from being
filled up with too much header data.
Note
The header data
appears on one line, no matter how long.
<http_session_data>—Helps debug situations where the VXML Server
receives HTTP requests that it does not expect or understand. When this tag is
used, the JSession ID (if known) and its association with the VXML Server Call
ID (if known) are displayed in the global error logger. This tag is helpful in
debugging
bad_url
errors.
Bad_url
errors are generally displayed when the VXML Server receives a HTTP request
that cannot be recognized. Use of this option increases the amount of memory
used by the VXML Server.
Use this feature
only for debugging situations.
Global Error Logger Configuration: File Purging
The Global Error
Logger can be configured to automatically delete files that conform to certain
criteria. Properly configured, this allows an administrator to avoid having the
system’s hard drive fill up with logs, which would prevent new calls from being
logged.
Note the following
information about file purging:
Because loggers
are activated only when events occur in a call, the file-purging activity only
takes place when an error event occurs. As a result, a system that encounters
no errors will not automatically delete files until a new error occurs.
When the Global
Error Logger starts up for the first time, it applies the purging strategy on
any files that exist in the logger directory. Therefore, if an application
server is shut down with files in the logger directory and then restarted a
long time later, these files might be deleted when the application server
starts up and the logger initializes.
The Global Error
Logger applies its purging strategy to any files found in its logger directory,
including non-error log files. Other files added to the logger folder after the
application server has started could be deleted when the Error Logger
encounters a new error.
The optional
<purge> tag defines the purging strategy. If this
tag does not appear in the configuration, no file purging will take place. The
tag can contain one of the following child tags:
file_age—The Global Error
Logger will delete error log files older than
X days, where
X is an integer greater than 0 specified in the
older_than attribute.
file_count—The Global
Error Logger will delete error log files if the logger folder contains greater
than
X files, where
X is an integer greater than 0 specified in the
greater_than attribute. When the files are deleted, the
oldest ones are deleted first until the folder reaches the desired file count.
Because stack
traces span multiple lines, including stack traces may complicate the process
of importing the error logs into spreadsheets or databases. This is rarely done
for error logs.
If there is a bad
URL error message, it will include 100 characters of the URL input parameters
and 300 characters of the HTTP headers, all on one line in the log file.
Nothing is logged
for a call that is put on hold.
When a new file is
added to logger instance’s dedicated directory by the Global Error Logger, if
the directory contains files that are older than 14 days (2 weeks), the files
will be deleted.
Java stack
traces will not appear in the error logs. When a Java exception occurs, only
the error message itself will appear in the error log without the stack trace.
When a call is
put on hold, that fact will be logged along with the application name that the
caller was attempting to visit.
If there is a
bad URL error message, only the URL itself will be logged without any HTTP
parameters or headers.
No file purging
will take place. The administrator is responsible for maintaining the logs on
the system.
Global
Administration History Logger
The Global
Administration History Logger records administration events that occur on VXML
Server itself. Application-level administration history is logged by
application-level loggers, which are described later in this chapter. These
events are triggered by an administrator executing administration script (see
Administration
for more on administering VXML Server).
The administration log
file names begin with
admin_historyYYYY-MM-DD.txt where YYYY, MM, and DD are the
year, month, and day when the administration log was first created. By default,
the log folder is named
GlobalAdminLogger (though the name is set in the
global_config.xml file and can be changed by the
administrator). Administration history log files are rotated daily.
Note
If no
administration activity occurred on a particular day, no administration history
log will be created.
The file contains
three columns: the time, what script was run, and its result, separated by
commas. The result is usually
success and if
not, contains the description of the error encountered. The possible values of
the result are:
server_start—Listed when
the VXML Server web application archive initializes. This occurs if the Java
application server on which VXML Server is installed starts up or the
administrator of the application server explicitly started up the VXML Server
web application archive.
server_stop—Listed when
the VXML Server web application archive is stopped. This occurs if the Java
application server on which VXML Server is installed shuts down or the
administrator of the application server explicitly stops the VXML Server web
application archive.
deploy_all_new_apps—Listed when the
deployAllNewApps script is run.
flush_all_old_apps—Listed
when the
flushAllOldApps script is run.
suspend_server—Listed
when the
suspendServer script is run.
resume_server—Listed when
the
resumeServer script is run.
update_common_classes—Listed when the
updateCommonClasses script is run.
Note
Running the
status
script does not trigger an administration event and thus does not update the
history log.
Application
Loggers
Application loggers
are defined in the settings for that application. The application designer can
choose any number of application loggers they want to listen to events for a
particular application, giving each instance a name. A logger may or may not
require a configuration that will allow the designer to customize how the
logger performs. The configuration files must be placed in the
data/application directory of the deployed application.
Unique to application
loggers is the ability for one to specify that all logging events for a call be
passed to the logger it in the order in which they occurred in the call. Some
application loggers may even require this functionality to be turned on as
their functionality depends on the events arriving in order. The application
designer can choose to ensure this functionality is the case even for
application loggers that do not explicitly require it to have logs appear
orderly. There is some performance degradation as a result of this
functionality so an application logger that does not require this should not
enable it.
VXML Server provides
the
logs
folder of a particular application for log file storage should the loggers
require it. To keep each application logger instance’s logs separate, a
subfolder with the name of the instance is created and all logs created by the
logger instance are stored there.
By default, VXML
Server includes four loggers that provide various application-specific
information: an activity logger that records caller behavior, an application
administration history logger that records administration activities, an error
logger that lists errors that occur within calls to the application, and a
debug logger that provides additional information useful when creating and
debugging a new application. The activity logger and error logger require
configurations that allow for detailed control over how the loggers operate.
The following sections
describe these four prebuilt application loggers, their configurations (if
any), and the information stored in their logs.
Application Activity
Logger
The Activity Logger
is the main application logger included with VXML Server. It records into text
log files all of the activity taken by callers when they visit an application.
It stores information about the call itself such as its ANI, what elements the
caller encountered and in what order, and even detailed actions such as the
values entered by the caller or the confidences of their declaration. The names
of the log files created by the Activity Logger begin with
activity_log
and are delimited for easy importing into spreadsheets and databases. These
logs have a fixed number of columns:
SessionID—The session ID
of the application visit as described in the
VXML
Server Call Log section.
Time—A timestamp of the
event in a readable format.
[Element name]—The name
of the current element the activity belongs to. Only functional elements (voice
elements, action elements, decision elements, and insert elements) can appear
here. This column would be empty if the activity does not apply to an element.
Category—The category of
the action:
start—Information on new
visits to the application.
end—Information on how
the application visit ended.
element—Information on
the element visited and how the element was exited. The element column is empty
for the
start and
end categories.
interaction—Detailed
information about what a caller did within a voice element.
data—Element data to be
logged.
custom—Custom
developer-specified data to log.
Action—A keyword
indicating the action taken. A list of actions is given in the following table.
Description—Some
qualifier or description of the action.
The following table
lists all of possible category and actions that can appear in the activity log
and descriptions on what they represent.
Category
Action
Description
start
newcall or
source
newcall is used when the
application visit is a new call. The description is empty.
source
is used when another application transferred to this application. The name of
the application transferred from is listed in the description.
start
ani
The
description is the ANI of the caller.
NA if
the ANI is not sent.
start
areacode
The area code
of the ANI.
NA if
the ANI is not sent.
start
exchange
The exchange
of the ANI.
NA if
the ANI is not sent.
start
dnis
The
description is the DNIS of the call.
NA if
the DNIS is not sent.
start
iidigits
The
description is the IIDIGITS of the call.
NA if
the IIDIGITS is not sent.
start
uui
The
description is the UUI of the call.
NA if
the UUI is not sent.
start
uid
The
application visit is associated with a user. The UID is listed in the
description.
start
parameter
An HTTP
parameter attached to the initial URL that starts a Unified CVP application.
The description lists the parameter name followed by an
"="
followed by the value. A separate line will appear for each parameter passed.
start
error
An error
occurred in the on-call start action (either a Java class or XML-over-HTTP).
The description is the error message.
end
how
How the call
ended. The description is either
hangup
to indicate the caller hung up,
disconnect to indicate the system hung up on the caller,
application_transfer:APPNAME to indicate a transfer to
another Unified CVP application occurred (where APPNAME stands for the name of
the destination application),
call_transfer to indicate a telephony blind transfer
occurred, or
app_session_complete to indicate that the call session ended
by another means such as a timeout or the call being sent to an VRU system
outside of Unified CVP.
end
result
The
description explains why the call ended.
normal
indicates the call ended normally,
suspended indicates the application is suspended,
error
indicates an error occurred,
timeout indicates that the VXML Server session timed out,
and
invalidated indicates the application itself invalidated the
session.
end
duration
The duration
of the call, in seconds.
end
error
An error
occurred in the on call end action (either a Java class or XML-over-HTTP). The
description is the error message.
element
enter
The element
was entered. The description is empty. This is always the first action for an
element.
element
hotlink
A hotlink
was activated while in the element. This can be either a global or local
hotlink. The description lists the hotlink name.
element
hotevent
A hotevent
was activated while in the element. The description lists the hotevent name.
element
error
An error
occurred while in the element. The description lists the error message.
element
flag
A flag was
triggered. The description lists the flag name.
element
exit
The element
was exited. The description lists the exit state of the element or is empty if
a hotlink, hotevent or error occurred within the element.
interaction
audio_group
An audio
group was played to the caller. The description is the audio group name.
interaction
inputmode
How the
caller entered data. The description can be
dtmf
or
speech.
interaction
utterance
The caller
said something that was matched by the speech recognition engine. The
description lists the match it made of the utterance. This action will always
appear with the interpretation and confidence actions.
interaction
interpretation
In a
grammar, each utterance is mapped to a certain interpretation value. The
description holds the interpretation value for the caller’s utterance. This
action will always appear with the utterance and confidence actions.
interaction
confidence
The
confidence of the caller's matched utterance. This is a decimal value from 0.0
to 1.0. DTMF entries will always have a confidence of 1.0. This action will
always appear with the utterance and interpretation actions.
interaction
nomatch
The caller
said something that did not match anything in the grammar.
interaction
noinput
The caller
did not say anything after a certain time period.
data
[NAME]
When an
element creates element data, one can specify if to log the element data.
Element data slated to be logged will appear here with the element data name as
the action and the value as the description.
custom
[NAME]
Anywhere the
developer adds custom name/value information to the log will have the name
appear as the action and the value stored within as the description.
Note the following
guidelines about the Activity Logger:
Due to its
complexity, the Activity Logger requires that the enforce call event order
option to be set for the logger instance using it and will throw an error if it
is not set.
When one
Unified CVP application performs an application transfer to another
application, the reported timestamps of the
end
category of the source application and the
start
category of the destination application could be imprecise when the source
application ends with the playing of audio content. This is due to the fact
that voice browsers typically request VoiceXML pages in advance if the current
page contains only audio and a submit to the next page. In other words, the
browser could be playing audio to the caller while making a request for the
next VoiceXML page. If that page were the last of an application, the
subsequent request would begin the process of entering the new application
including having the Activity Logger handle start and end of call logging for
the two applications. It would then report the end time for the source
application as being before the time the caller actually
experienced the destination application by hearing its
audio.
The Activity
Logger utilizes a configuration to control the finer details of the information
it stores in its log files. The configuration controls five different aspects
of the Activity Logger:
Format of the
files
How much data
to store in them
How often to
rotate the files
How caching
should work
How often
should log files be purged
This configuration
is specified as an XML file created by the designer in Builder for Call Studio.
The following figure shows the format for the XML Activity Logger configuration
file.
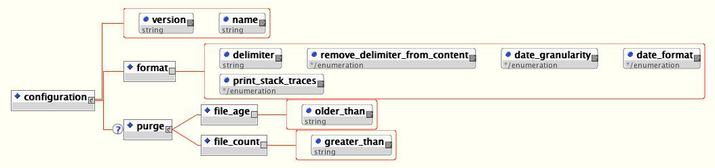
Figure 2. Activity
Logger Configuration File Format
The main tag for
the configuration, configuration, has two attributes,
name and
version.
Name is expected to contain the logger instance name
although can be given any name desired. The
version is expected to include the version of the
configuration, which is currently
1.0. The
subsequent sections describe the functionality of the various tags in the
configuration.
Activity Logger
Configuration: Format
The
<format> tag allows for the modification of how
the activity log files are formatted. All Activity Logger configurations are
required to define a format. The possible attributes are:
delimiter—This required
attribute defines the delimiter to use to separate columns on a line.
Delimiters can be any string value, though typically will be a comma or tab. To
use a special white space character such as a new line or tab, use the escaped
version.
The possible
values are:
\n
(denoting a new line)
\t
(denoting a tab)
\r
(denoting a return)
\f
(denoting a line feed)
remove_delimiter_from_content—When this required attribute
is set to
true,
the Activity Logger attempts to eliminate the delimiter from any content
appearing in the logs to ensure that the log file can be imported flawlessly.
For example, if the delimiter is a comma and the configuration is set to remove
the delimiter, when it is to log the content
This, is the
description, it will appear in the log as
This is the
description so that it does not affect the accuracy of the importing
process. This extra step, though, does incur a slight performance hit. This
step will not be performed if this attribute is set to false.
end_of_line—This
optional attribute controls the delimiter used to separate lines. When this
optional attribute is set to
true, the Activity Logger will separate lines appropriate to
the operating system on which VXML Server is running. Set the attribute to
explicitly set the new line delimiter. Delimiters can be any string value,
though typically will be a white space character. To use a special white space
character such as a new line or tab, use the escaped version.
The possible
values are:
\n
(denoting a new line)
\t
(denoting a tab)
\r
(denoting a return)
\f
(denoting a line feed)
date_format and
date_granularity—These required attributes set how the
second column of the activity log references a date when the event occurred.
The format and granularity are specified.
There are
three possible values for the
date_format attribute:
standard—This is a standard readable date format in the form
MM/DD/YYYY HH:MM[:SS][.MMM] where the hour is in 24-hour
time and the last three digits are the milliseconds. The seconds and
milliseconds are displayed with brackets to indicate that their appearance is
based on the
date_granularity attribute. For a
date_granularity attribute set to
minutes, just the hours and minutes of the time will be
displayed. For a granularity set to
seconds, just the hours, minutes and seconds will be
displayed. For a granularity set to
milliseconds, all components will be displayed.
minimal—This is a minimal time value that omits the date and
is in the form
HH:MM[:SS][.MMM] where the hour is in 24-hour time and the
last three digits are the milliseconds. The seconds and milliseconds are
displayed with brackets to indicate that their appearance are based on the
date_granularity attribute. For a
date_granularity attribute set to
minutes, just the hours and minutes will be displayed. For a
granularity set to
seconds, just the hours, minutes and seconds will be
displayed. For a granularity set to
milliseconds, all components will be displayed.
number—This displays a large integer number representing the
full date and time as an elapsed time since January 1, 1970, 00:00:00 GMT. For
a
date_granularity attribute set to
minutes, the number will be 8 digits in length (representing
the number of minutes elapsed since that date). For a granularity set to
seconds, the number will be 10 digits in length
(representing the number of seconds elapsed since that date). For a granularity
set to
milliseconds, the number will be 13 digits in length
(representing the number of milliseconds elapsed since that date).
Activity Logger
Configuration: Scope
The Activity
Logger configuration provides the administrator the ability to control what is
logged based on their own needs. This configuration is done by defining logging
levels and the events that each level contains. During the debugging stage, for
example, the logging level can be set to record all events and once in
production, the logging level can be set to record more important events.
The
<scope> tag defines the logging level to use in
the
logging_level attribute. The child tag
<definitions> encapsulates all possible logging
levels. All Activity Logger configurations are required to define a scope with
at least one logging level.
To define a
logging level, a separate
<level> tag is added within the
<definitions> tag and given a name in the
name attribute. This tag will include a separate
<event> tag for each event the logging level
includes. The
id
attribute defines the name of the event. The following table lists all possible
event IDs and describes when that event occurs.
Note
At minimum, the
start and
end events
are required for any logging level as these events are used by the Activity
Logger to maintain information about its log files and which calls are using
them.
Event ID
Event Description
start
This event
occurs when a new visit is made to the application (could be a new call or
visit using an application transfer). This event is
required in all logging levels.
end
This event
occurs when an application visit ends. This event is
required in all logging levels.
elementEnter
This event
occurs when an element is entered. This applies to both standard and
configurable elements as well as VoiceXML Insert elements.
elementExit
This event
occurs when an element exits (either normally or due to something occurring
within it that took the call flow elsewhere).
elementFlag
This event
occurs when a flag element is visited by a caller.
defaultInteraction
This event
occurs when a voice element returns interaction logging content as a result of
caller activity within a VoiceXML page.
elementData
This event
occurs when element data is created that has been configured to be stored in
the log.
custom
This event
occurs when custom content is to be added to the log, either by visiting an
element whose configuration specified content to add or by executing custom
code using either the Java or XML APIs that specifies to add to the log.
hotlink
This event
occurs when a global or local hotlink that points to an exit state (as opposed
to throwing a VoiceXML event) is activated by the caller.
hotevent
This event
occurs when a hotevent that has an exit state is activated in the call.
warning
This event
occurs when a warning is encountered.
systemError
This event
occurs when VXML Server encounters an internal error (that is, an error that
does not originate from a custom component). This event will include a stack
trace.
javaApiError
This event
occurs when a custom component created with the Unified CVP Java API encounters
an error. This event will include a stack trace.
xmlApiError
This event
occurs when a custom component created with the Unified CVP XML API encounters
an error. This event will
not
include a stack trace.
vxmlError
This event
occurs when an error event is received from the voice browser. This event will
not
include a stack trace.
Activity Logger
Configuration: File Rotation
In any system that
stores information in log files, high volume can cause these files to become
very large. The goal is to have a strategy for creating new log files in order
to avoid files that are too large. Additionally, file rotation strategies can
help separate the log files into more logical parts. The Activity Logger
defines several rotation strategies to choose from.
Note
To ensure that
the information for a single call is not split across multiple log files, the
Activity Logger ensures that all call information appears in the log that was
active when the call was received. As a result, it is possible for calls to be
updating both pre- and post-rotation log files simultaneously.
Each rotation
strategy determines how the log files are named (though all activity log
filenames begin with
activity_log). The
<rotation> tag defines the rotation strategy to
use by containing one of the following tags:
<by_day>—Creates
a new log file every
X days
where
X is an
integer value greater than 0 specified in the
every attribute. Typically this value is 1, meaning
that every day at midnight, a new log file is created. For low volume systems,
the value can be given a larger value. For example, when set to 7, a new log
file is created once a week. The log files are named
activity_logYYYY-MM-DD.txt where
YYYY is
the year,
MM is
the month, and
DD is
the day that the file is created.
<by_hour>—Creates
a new log file every
X hours
where
X is an
integer value greater than 0 specified in the
every attribute. There is no upper bound on this value,
so it can be greater than 24. The log files are named
activity_logYYYY-MM-DD-HH.txt where
YYYY is
the year,
MM is
the month,
DD is
the day, and
HH is
the hour that the file is created.
Note
The hour is
measured in 24-hour time (0 - 23).
Note
In locales
that use Daylight Saving Time (DST), calls that are placed after the clock is
turned back an hour will continue to be logged in the current log file for the
one a.m hour (the current log file). A new log file is not created when the
clock is turned back for DST for the one a.m hour.
<by_call>—Creates
a separate log file for each call made to the application. The log files are
named
activity_logYYYY-MM-DD-HH-SESSIONID.txt where
YYYY is
the year,
MM is
the month,
DD is
the day, and
HH is
the hour that the file is created (in 24-hour time) and SESSIONID is the VXML
Server session ID (for example,
activity_log2000-01-01-17-192.168.1.100.1024931901079.1.MyApp.txt).
The session ID is included in the filename to ensure uniqueness of the files.
Note
Care must
be taken before using this log file rotation strategy on systems with high load
as this will create a very large number of files.
<by_size>—Creates
a separate log file once the previous log file has reached
X
megabytes in size where
X is an
integer value greater than 0 specified in the mb_limit attribute.
Note
Due to the
fact that multiple calls will be updating the same file and that the Activity
Logger will ensure that all data for a single call appear in the same log file,
the final log file may be slightly larger than the limit.
The log files
are named
activity_logYYYY-MM-DD-HH-MM-SS.txt where
YYYY is
the year, the first
MM is
the month,
DD is
the day,
HH is
the hour (in 24-hour time), the second
MM is
the minute, and
SS is
the second that the file is created. The time information is included in the
file name in order to ensure uniqueness.
Activity Logger
Configuration: Caching
The Activity
Logger has the ability to use a memory cache to store information to log until
either the cache fills or the call ends. Using a cache has several advantages.
The first is that it increases performance by waiting until the end of the call
to perform the file IO. Without a cache, the log file would be updated each
time an event occurred. Another advantage is that with caching on, the log file
will be more readable by grouping the activities belonging to a single phone
call together. Without the cache, the events for all calls being handled by
every application running on VXML Server would be intermingled. While one can
still sort the calls after the log is imported to a spreadsheet or database, it
is much more difficult to track a single call when simply reading the log file
without the cache. The one disadvantage of using a cache is that the log file
is not updated in real-time, only after a call has completed. If there is a
desire to have the logs updated immediately after the events occur, then
caching should be left out of the configuration.
The
<cache> tag has only one child tag:
<per_call>, indicating that the cache’s lifetime
is a single call to an application.
<per_call> defines two attributes:
kb_limit, an integer value greater than 0 that defines
the size of the cache in kilobytes, and
allocate that defines the cache allocation strategy.
The attribute can
be set to two values:
once—The Activity
Logger will allocate the full memory needed for the cache once and then fill it
up with logging information. When filled, the cache is flushed to the log file
and the same section of memory is cleared and then refilled.
as_needed—The Activity
Logger will allocate memory as events arrive in the call until the total amount
of memory has been allocated. When it is to be flushed, the memory is released
and then the allocation begins again.
The advantage of
allocating the memory at once is that since a contiguous section of memory is
being used, the updating, maintenance, and flushing of that memory will be
slightly faster. Additionally, with only one area of memory per call fewer
memory allocations take place, which can affect how often Java garbage
collection runs. A disadvantage is that the cache size needs to be chosen
carefully. A cache incurs too small performance hits as the cache fills up and
is logged multiple times within a call. A cache means too large that a large
amount of memory is allocated and then never used, potentially starving the
rest of the system. A good cache size would be approximately the size of a log
for a typical call to the application. Because the cache is flushed at the end
of a call, there is little reason to make the cache much larger.
The advantage to
allocating the memory as needed is that this minimizes the memory used since
only the memory needed to store the information is used. The cache size is not
as important, and making it larger will not affect the overall memory usage as
drastically as if the cache was allocated all at once because the memory would
not be allocated unless needed.
Configure the cache to be allocated once for performance and as needed
if memory on the system is limited.
Activity Logger
Configuration: File Purging
The Activity
Logger can be configured to automatically delete files that conform to certain
criteria. Properly configured, this logger allow an administrator to avoid
having the system’s hard drive fill up with logs, which prevents new calls from
being logged.
Note the following
information about file purging:
A logger has
control only over the files appearing under the logger instance’s dedicated log
folder and cannot control those files managed by other logger instances. This
logger even applies to multiple instances of the same logger since each logger
instance is given its own unique folder within the
logs folder of the application. Activity Logger file
purging therefore applies only to those files appearing under the logger
instance’s folder.
Because
loggers are activated only when events occur in a call, the file-purging
activity will only take place when a call ends. As a result, a system that
receives no calls at all will not automatically delete files until a new call
is received and completes.
When the
Activity Logger starts up for the first time, it will apply the purging
strategy on any files that exist in the logger directory. Therefore, if an
application server is shut down with files in the logger directory and then
restarted a long time later, these files could be deleted when the application
server starts up and the logger initializes. This applies to any file appearing
in the logger directory, not just activity logs.
The Activity
Logger keeps information about the activity log files in memory and acts on
that to determine whether to delete them rather than by monitoring the
remaining hard drive space on the system. This is done to avoid having to do
file IO to determine if a file is to be purged and so minimizes overhead
(although there still is overhead in deleting files). One consequence is that
the logger keeps track
only of
those files it is managing. The logger is unaware of any files added to the
directory after the application server initializes, so the purging strategy
will affect those files only.
The optional
<purge> tag defines the purging strategy. If this
tag does not appear in the configuration, no file purging takes place. The tag
can contain one of the following child tags:
file_age—The Activity
Logger deletes activity log files older than
X days,
where
X is an
integer greater than 0 specified in the
older_than attribute.
file_count—The Activity
Logger deletes activity log files if the logger folder contains greater than
X files,
where
X is an
integer greater than 0 specified in the
greater_than attribute. When the files are deleted, the
oldest ones are deleted first until the folder reaches the desired file count.
The activity
logs will be delimited with a tab ("\t") and will have any tabs that appear in the content
removed.
The activity
logs will use a Unix-style new line character ("\n") to delimit lines.
As a result, these log files would not appear orderly on Windows Notepad
because it does not recognize these new line characters.
Dates in the
activity logs will appear in the standard format with millisecond granularity.
For example,
05/09/2006
15:45:02.654
Two logging
levels are defined: Minimal, which logs only when a caller entered and exited
an application, and Complete, which logs all events. The Complete logging level
is the one that will be used.
The activity
log files will be rotated every two days, meaning each log file will contain
two days worth of calls before a new file is created.
The cache is
set to 10 K or 5000 characters and is allocated once at the start of a call.
Files that are
older than three days that appear in the logger instance’s dedicated directory
will be purged.
The activity
logs will be delimited with a comma and will not remove any commas that appear
in the content potentially complicating any importing of these logs into
spreadsheets or databases.
The activity
logs will end each line with the character appropriate for the operating system
on which it is generated. If this system is running under Windows, the activity
logs can be viewed in Notepad and if this system is running under Unix, the
activity logs can use the Unix end of line characters that would not be
recognized if opened by Windows Notepad.
Dates in the
activity logs will appear in the minimal format with minute granularity. For
example,
15:45.
Only one
logging level is defined that logs when calls enter and exit an application,
enter and exit an element, and when a flag element is visited.
A new activity
log is created when the previous one has reached approximately 100 MB in size,
regardless on whether the calls spanned weeks or hours.
No logging
cache is used, meaning that when a logging event occurs in a call, it is placed
into the activity log immediately. It allows for real-time logging but incurs a
performance overhead in managing much more IO operations.
No file
purging will take place. The administrator is responsible for maintaining the
logs on the system.
Application Error
Logger
During the voice
application development process, errors can be introduced by configuring
elements incorrectly, spelling mistakes in audio filenames, or by Java coding
bugs. In each of these cases, errors occur while running the application. While
the Activity Logger does report errors, it is preferable to isolate errors in a
separate file so that they are easily found and addressed. Additionally, when
reporting Java errors, a stack trace is desired. The application Error Logger
provides a place for these errors to appear. The error log file names are in
the form
error_logYYYY-MM-DD.txt where YYYY, MM, and DD are the year,
month, and day when the error log was first created and is rotated daily.
Note
The application
Error Logger will report information on errors that are affiliated with the
application in which it is configured. It can even report errors encountered by
other loggers in the same application only if the Error Logger is listed
before other
loggers in the application. If another logger is loaded before the Error
Logger, any errors it encounters will be logged instead to the VXML Server Call
Error Log. It is for this reason that by default Builder for Call Studio puts
the Error Logger at the top of the list of loggers to use for a new
application.
Starting in Release
8.0(1), the application error log now reports on application timeout events.
Previously, timeout events were not located in the application activity logs.
The columns of the
error log are:
SessionID—The session ID
of the application visit described in the VXML Server Call Log section.
Time—The time the error
occurred.
Description—The error
description including a Java stack trace if applicable.
The Error Logger
utilizes a configuration to control two different aspects of the error logs:
the format of the files and how often should log files be purged. This
configuration is specified as an XML file created by the designer in Builder
for Call Studio, as shown in the following figure.
Figure 3. Error Logger
Configuration Format
The main tag for the
configuration,
configuration, has two attributes,
name
and
version.
Name
is expected to contain the logger instance name. The
version is expected to include the version of the
configuration, which is currently
1.0. The
subsequent sections describe the functionality of the various tags in the
configuration.
Error Logger Configuration: Format
The
<format> tag allows for the modification of how
the error log files are formatted. All Error Logger configurations are required
to define a format. The possible attributes are:
delimiter—This required
attribute defines the delimiter to use to separate columns on a line.
Delimiters can be any string value, though typically will be a comma or tab. To
use a special white space character such as a new line or tab, use the escaped
version.
The possible
values are:
\n (denoting a new line)
\t (denoting a tab)
\r (denoting a return)
\f (denoting a line feed)
remove_delimiter_from_content—When this required attribute
is set to
true, the
Activity Logger will attempt to eliminate the delimiter from any content
appearing in the logs to ensure that the log file can be imported flawlessly.
For example, if the delimiter is a comma and the configuration is set to remove
the delimiter, when it is to log the content
This, is the
description, it will appear in the log as
This is the
description so as not to affect the accuracy of the importing process. This
extra step, though, does incur a slight performance hit. This step will not be
performed if this attribute is set to
false.
Note
If the error
log contains Java stack traces, the error logs might be difficult to import as
stack traces fill multiple lines (though their content will be cleaned of the
delimiter if desired).
date_format and
date_granularity—These required attributes set how the
second column of the activity log references a date when the event occurred.
The format and granularity are specified.
There are three
possible values for the
date_format attribute:
standard—This is a
standard readable date format in the form
MM/DD/YYYY
HH:MM[:SS][.MMM] where the hour is in 24-hour time and the last three
digits are the milliseconds. The seconds and milliseconds are displayed with
brackets to indicate that their appearance is based on the
date_granularity attribute. For a
date_granularity attribute set to
minutes,only hours and minutes of the time will be
displayed. For a granularity set to
seconds,
only hours, minutes and seconds will be displayed. For a granularity set to
milliseconds, all components will be displayed.
minimal—This is a minimal
time value that omits the date and is in the form
HH:MM[:SS][.MMM] where the hour is in 24-hour time and the
last three digits are the milliseconds. The seconds and milliseconds are
displayed with brackets to indicate that their appearance are based on the
date_granularity attribute. For a
date_granularity attribute set to
minutes,only hours and minutes will be displayed. For a
granularity set to
seconds,
only hours, minutes and seconds will be displayed. For a granularity set to
milliseconds, all components will be displayed.
number—This displays a
large integer number representing the full date and time as an elapsed time
since January 1, 1970, 00:00:00 GMT. For a
date_granularity attribute set to
minutes,
the number will be 8 digits in length (representing the number of minutes
elapsed since that date). For a granularity set to
seconds,
the number will be 10 digits in length (representing the number of seconds
elapsed since that date). For a granularity set to
milliseconds, the number will be 13 digits in length
(representing the number of milliseconds elapsed since that date).
print_stack_traces—This
required attribute is set to either
true or
false and
determines whether the error log will contain Java stack traces. Stack traces
are very useful to a developer in tracking down the cause of a Java error.
You must keep this option on.
Error Logger Configuration: File Purging
The Error Logger can
be configured to automatically delete files that conform to certain criteria.
Properly configured, this allows an administrator to avoid having the system’s
hard drive fill up with logs, which would prevent new calls from being logged.
Note the following
information about file purging:
Becasue loggers
are activated only when events occur in a call, the file purging activity will
only take place when an error event occurs. As a result, a system that
encounters no errors will not automatically delete files until a new error
occurs.
When the Error
Logger starts up for the first time, it will apply the purging strategy on any
files that exist in the logger directory. Therefore, if an application server
is shut down with files in the logger directory and then restarted a long time
later, these files can be deleted when the application server starts up and the
logger initializes.
Unlike the
Activity Logger, the Error Logger applies its purging strategy to any files
found in its logger directory, including non-error log files. If other files
are added to the logger folder after the application server has started, they
might be deleted when the Error Logger encounters a new error.
The optional
<purge> tag defines the purging strategy. If this
tag does not appear in the configuration, no file purging will take place. The
tag can contain one of the following child tags:
file_age—The Error
Logger deletes error log files older than
X days,
where
X is an
integer greater than 0 specified in the
older_than attribute.
file_count—The Error
Logger deletes error log files if the logger folder contains greater than
X files,
where
X is an
integer greater than 0 specified in the
greater_than attribute. When the files are deleted, the
oldest ones are deleted first until the folder reaches the desired file count.
The error logs
will be delimited with a comma and will have any commas that appear in the
content removed.
Dates in the
error logs will appear in the standard format with seconds granularity. For
example:
05/09/2006
15:45:02.
Java stack
traces will appear in the error logs.
Note
Because stack
traces span multiple lines, including stack traces may complicate the process
of importing the error logs into spreadsheets or databases. This process is
rarely done for error logs.
When a new file
is added to logger instance’s dedicated directory by the Error Logger, if the
directory contains more than 10 files the oldest file will be deleted.
Note
With a large
application or a large number of applications, it is possible to fill all
available disk space with logs. For this reason, all applications have a
default log retention set to 10 GB (100 logs). Customers should review this
setting as needed and modify it to suit their situation.
The error logs
will be delimited with the string
"***" and
will not attempt to remove that string from the content.
Note
The delimiter
does not need to be limited to a single character and can be a multicharacter
string. Usually, a single character makes importing into spreadsheets and
databases straightforward.
Dates in the
error logs will appear in the minimal format with seconds granularity. For
example,
15:45:02.
Java stack
traces will not appear in the error logs. When a Java exception occurs, only
the error message itself will appear in the error log without the stack trace.
No file purging
will take place. The administrator is responsible for maintaining the logs on
the system.
Application
Administration History Logger
Whenever an
application-specific administration script is run, a log file is updated with
information on the script that was run. The administration log filenames are in
the form
admin_historyYYYY-MM-DD.txt where
YYYY,
MM, and
DD are the year, month, and day when the administration history
log was first created and is rotated daily. The file contains three columns:
the time the script was run, what script was run, and its result. The result is
usually
success and if
not contains the description of the error encountered.
The possible values
are:
server_start—Each
application’s history log contains records of each time the application server
starts.
deploy_app—Listed when
the
deployApp script is run.
suspend_app—Listed when
the
suspendApp script is run.
resume_app—Listed when
the
resumeApp script is run.
update_app—Listed when
the
updateApp script is run.
release_app—Listed when
the
releaseApp script is run.
update_common_classes—Listed when the global
updateCommonClasses script is run. The reason this
global admin event is logged by the Application Administration History Logger
is because elements that appear in the
common directory are reloaded by this command, causing
those elements to reload their application-specific configurations.
Running the
status
script does not update the history log. The Administration History Logger does
not use a configuration.
Application Debug
Logger
At times when
debugging an application, it is advantageous to see information concerning the
HTTP requests made by the voice browser and the corresponding HTTP responses of
VXML Server. The Debug Logger creates a single file per call that contains all
HTTP requests and responses that occurred within that call session. The log
files are named
debug_logYYYY-MM-DD-HH-SESSIONID.txt where
YYYY is the year,
MM is the month,
DD is the day, and
HH is the hour (in 24-hour time) that the file is created and
SESSIONID is the VXML Server session ID (for example,
debug_log2000-01-01-17-192.168.1.100.1024931901079.1.MyApp.txt).
The Session ID is included in the filename to ensure uniqueness of the files.
The debug log
contains:
A timestamp of
when each HTTP request was received from the voice browser as well as when the
response was sent back by VXML Server.
All headers of the
HTTP request.
All arguments
passed with the HTTP request, whether they be set with GET or POST.
The entire
VoiceXML page returned in the HTTP response.
We recommend that
you use the Debug Logger only when performing debugging and not in a production
environment because it incurs overhead on the system in creating and managing
file IO and replicating the HTTP response, which must be generated once for the
voice browser and once for each Debug Logger instance.
Note
The Debug
Logger does not require the enforce call event order to be turned on, however,
without it there could be situations where under load the HTTP requests and
responses are out of order or mixed together in the file.
Correlating Unified CVP Call Server Logs with VXML Server Logs
Starting in Release 8.0(1), VXML Server (by default) receives
callid (which contains the call GUID), _dnis, and _ani as session variables in
comprehensive mode even if the variables are not explicitly configured as
parameters in the ToExtVXML array. If the variables are configured in ToExtVXML
then those values are used. These variables are available to VXML applications
as session variables and they are displayed in the VXML server
log.


 Feedback