Cisco UCS Integrated Infrastructure for Splunk Enterprise
Available Languages
Bias-Free Language
The documentation set for this product strives to use bias-free language. For the purposes of this documentation set, bias-free is defined as language that does not imply discrimination based on age, disability, gender, racial identity, ethnic identity, sexual orientation, socioeconomic status, and intersectionality. Exceptions may be present in the documentation due to language that is hardcoded in the user interfaces of the product software, language used based on RFP documentation, or language that is used by a referenced third-party product. Learn more about how Cisco is using Inclusive Language.
- US/Canada 800-553-2447
- Worldwide Support Phone Numbers
- All Tools
 Feedback
 Feedback
Published: June 2025
In partnership with:

About the Cisco Validated Design Program
The Cisco Validated Design (CVD) program consists of systems and solutions designed, tested, and documented to facilitate faster, more reliable, and more predictable customer deployments. For more information, go to: http://www.cisco.com/go/designzone
Executive Summary
The exponential growth in data generation from diverse digital sources such as servers, applications, devices, and user interactions present significant challenges for organizations seeking to analyze, troubleshoot, and monitor their environments effectively. Traditional monitoring and analytics tools often struggle to keep pace, resulting in delayed detection of issues, incomplete visibility, and inefficient troubleshooting processes. These challenges are further amplified by the demand for real-time monitoring and the complexity of integrating data from multiple, siloed sources, making it increasingly difficult to maintain operational reliability and security.
To gain valuable insights from these vast amounts of data generated by IT systems and applications, organizations require powerful analytics platforms. By transforming this data into actionable insights, organizations can improve operational efficiency, enhance security, and make better decisions. Splunk Enterprise is a leading software platform for operational intelligence, focusing on centralized data collection, indexing, and analysis. It offers real-time visibility into IT infrastructure along with advanced search, monitoring, and reporting capabilities. Splunk deployment allows users to gain insights into their infrastructure across hybrid as well as multi-cloud environments.
The performance and scalability of Splunk depends heavily on the underlying infrastructure. Traditional IT architectures can often struggle to meet the demands of Splunk’s data heavy workloads, operational bottlenecks, and escalating costs as data volumes continue to grow. The Cisco Unified Computing System™ (Cisco UCS®) is a next-generation data center platform that unites computing, network, storage access, and virtualization into a single cohesive system. It is designed to simplify data center operations, increase efficiency, and provide centralized management for enterprise application workloads.
Cisco Validated Designs consist of systems and solutions that are designed, tested, and documented to facilitate and improve customer deployments. This CVD document describes the steps for configuring and implementing Splunk Enterprise solution on a Distributed Clustered model with a Search Head Cluster (SHC) for a Single Site Deployment (C3/C13) on Cisco UCS Integrated Infrastructure with the ability to monitor and manage components from the cloud using Cisco Intersight. By moving the management from the fabric interconnects into the cloud, the solution can respond to the speed and scale of your deployments with a constant stream of new capabilities delivered from Cisco Intersight software-as-a-service model at cloud-scale. For those that require management within a secure datacenter, Cisco Intersight is also offered as an on-site appliance with both connected and internet disconnected options.
Solution Overview
This chapter contains the following:
● Audience
Most enterprise IT infrastructures have been built over time and include a wide variety of multivendor networks, compute platforms, operating systems, storage resources, and applications. This diversity creates management complexity that increases costs and hampers agility. Consequently, IT managers need real-time, comprehensive visibility across all applications and every aspect of their infrastructure, so they can identify underlying issues and resolve a problem as soon as possible.
Traditional tools for managing and monitoring IT infrastructures have become outdated considering the constant changes occurring in today's data centers. When issues arise, pinpointing the root cause and achieving visibility across the infrastructure to proactively identify and prevent outages can be nearly impossible. Splunk is a powerful platform that offers a wide range of capabilities, particularly in the areas of data monitoring, infrastructure management, and observability. Splunk is extremely beneficial for data analysis since it allows organizations to search, analyze, and visualize all types of data—both structured and unstructured—from a single platform, delivering actionable insights in real time. Splunk Enterprise can be deployed on-premises, in the cloud, or as a hybrid solution, providing a unified view of data and operational insights for IT, security, DevOps, and business analytics use cases.
Organizations typically start with Splunk to solve a specific problem and then expand from there to address a broad range of use cases, such as application troubleshooting, IT infrastructure monitoring, security, business analytics and many others. As operational analytics become increasingly critical to day-to-day decision-making and Splunk deployments expand to terabytes of data, a high-performance, highly scalable infrastructure is critical to ensuring rapid and predictable delivery of insights. Cisco UCS's ability to expand to thousands of servers allows the Splunk deployments to scale horizontally while continuously delivering exceptional performance.
The Cisco Unified Computing System with Intersight Managed Mode (IMM) is a modular compute system, configured and managed from the cloud. It is designed to meet the needs of modern applications and to improve operational efficiency, agility, and scale through an adaptable, future-ready, modular design. The Cisco Intersight platform is a Software-as-a-Service (SaaS) infrastructure lifecycle management platform that delivers simplified configuration, deployment, maintenance, and support of your UCS resources.
By leveraging Cisco UCS Integrated Infrastructure for Splunk, organizations can focus on deriving insights from their data rather than managing the underlying infrastructure. This solution combines leading innovation in software with Splunk Enterprise and hardware, with the Cisco UCS Integrated Infrastructure. This CVD document offers a deployment model for Splunk Enterprise which can be customized and implemented rapidly to meet Splunk workload requirements.
The intended audience for this document includes, but is not limited to, sales engineers, field consultants, professional services, IT managers, IT engineers and IT architects, partners, and customers who are interested in deploying Splunk Enterprise platform on Cisco UCS.
The purpose of this document is to provide step-by-step configuration and implementation guide for deploying Splunk Enterprise software on Cisco UCS Compute Servers, Cisco Fabric Interconnect Switches and Cisco Nexus Switches. The document also highlights the design and product requirements for integrating compute, network, and storage systems to Cisco Intersight to deliver a true cloud-based integrated approach to infrastructure management.
This design and implementation guide shows a validated reference architecture and describes the specifics of the products used within the Cisco validation lab. This document introduces various design elements and explains various considerations and best practices for successful deployments.
Deploying Splunk Enterprise on Cisco UCS infrastructure delivers a powerful, scalable, and efficient solution for organizations seeking operational intelligence, real-time analytics, and robust data management. Cisco UCS and Splunk team have carefully validated and verified solution architecture and its many use cases while creating detailed documentation, information, and references to assist customers in transforming their data centers to this shared infrastructure model.
Some of the key benefits of this solution are:
● Exceptional Performance and Scalability: Cisco UCS provides industry-leading performance and linear scalability, allowing Splunk Enterprise deployments to efficiently handle massive data volumes, including multiple petabytes of machine data across cloud, on-premises, and hybrid environments. The architecture supports horizontal scaling, so organizations can expand Splunk deployments as data and user demands grow, without sacrificing speed or reliability.
● Simplified and Unified Management: The architecture supports horizontal scaling, so organizations can expand Splunk deployments as data and user demands grow, without sacrificing speed or reliability.
● High Availability and Reliability: The reference architectures are designed for high availability, with redundant components and active-active configurations to ensure continuous operations and minimize downtime. Automated health monitoring and advanced system maintenance features help maintain system integrity and performance.
● Real Time Insights and Proactive Monitoring: Splunk Enterprise, running on Cisco UCS, enables real-time monitoring, analysis, and visualization of data from any source—such as customer transactions, network activity, and application logs—turning raw machine data into actionable business insights. This capability allows organizations to troubleshoot issues rapidly, often reducing investigation times from hours or days to just minutes.
● Flexibility and Storage Optimization: Cisco UCS supports a variety of storage options (NVMe, SSD, HDD), allowing organizations to optimize storage for different Splunk data tiers (hot, warm, cold, archive) based on performance and cost requirements. The infrastructure can be tailored to meet the needs of both medium and large-scale Splunk deployments
● Accelerated Deployment and Reduced Risk: Validated reference architectures and Cisco Validated Designs (CVDs) provide prescriptive, step-by-step guidance for deploying Splunk Enterprise on Cisco UCS, accelerating time-to-value, and minimizing deployment risks
● Integrated Security and Compliance: Splunk and Cisco together provide comprehensive visibility across IT and security environments, accelerating threat detection, investigation, and response to reduce the impact of security breaches. Integrations with Cisco’s security portfolio and Splunk’s analytics-driven security features help organizations improve their security posture and meet compliance requirements.
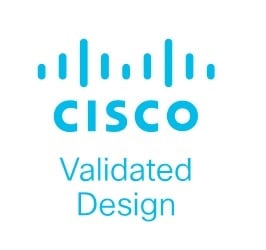
This reference architecture for running Splunk Enterprise on Cisco UCS is built using the following infrastructure components for compute, network, and storage as:
● Cisco UCS Nexus 9000 Switches
● Cisco UCS 5th Generation Fabric Interconnects
● Cisco UCS C-Series M8 Series C225 and C245 Rack Servers
These components have been integrated so that you can deploy the solution quickly and economically while eliminating many of the risks associated with researching, designing, building, and deploying similar solutions from the foundation. Cisco UCS Servers, Cisco FI and Cisco Nexus component families, shown in Figure 1, offer options when solutioning and through implementation that are designed to allow you to scale up or scale out the infrastructure while supporting the same features. There are two modes to configure Cisco UCS, one is UCSM (UCS Managed), and the other is IMM (Intersight Managed Mode). This reference solution was deployed using Intersight Managed Mode (IMM)and the associated best practices and setup recommendations are described later in this document.
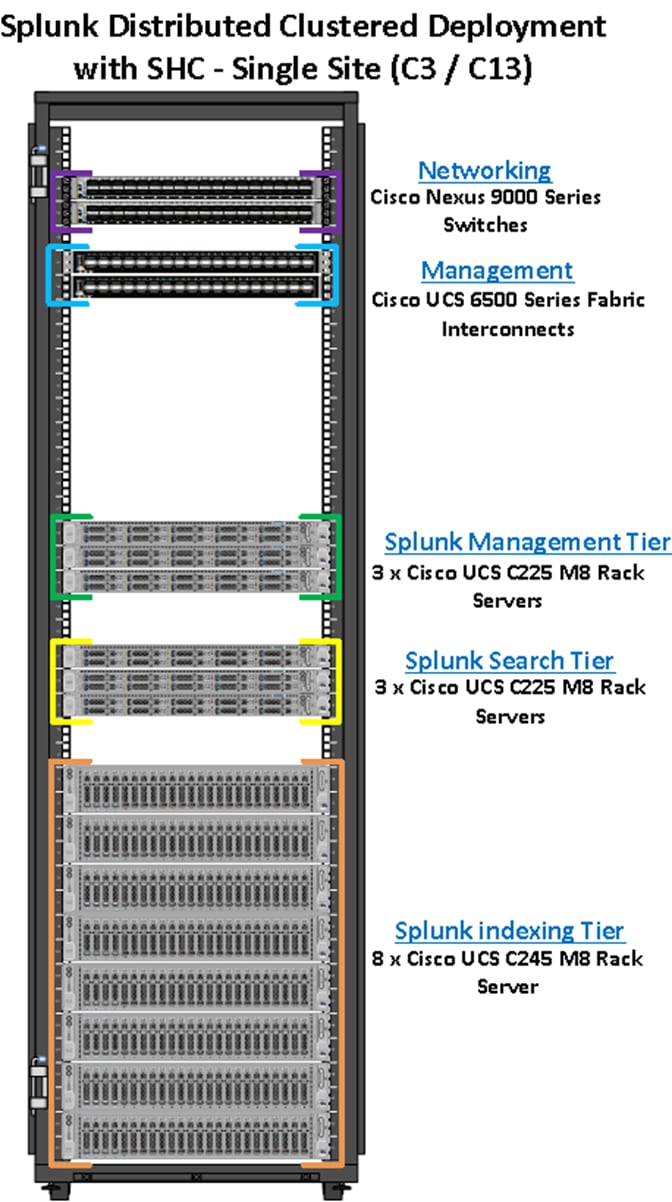
This CVD describes architecture and deployment procedures for Splunk Enterprise using eight (8) Cisco UCS C245 M8 rack servers as indexers, three (3) Cisco UCS C225 M8 rack servers as search heads, and three (3) Cisco UCS C225 M8 rack servers to perform administrative functions.
In this CVD, eight Splunk Indexers provide capacity to index up to 2.4 TB of data per day. This configuration can scale to index hundreds of terabytes to petabytes of data every 24 hours, delivering real-time search results and meeting Splunk application demands with seamless data integration and analytics to multiple users across the globe.
Technology Overview
This chapter contains the following:
● Cisco Unified Computing System
● Cisco UCS Fabric Interconnect
● Cisco UCS C-Series Rack Servers
● Cisco UCS Virtual Interface Card
The Cisco UCS solution for Splunk Enterprise is based on Cisco UCS Integrated Infrastructure for Big Data and Analytics, a highly scalable architecture designed to meet a variety of scale-out application demands with seamless data integration and management integration capabilities built using the components described in the following sections.
Cisco Unified Computing System
Cisco Unified Computing System™ (Cisco UCS®) is an integrated computing infrastructure with intent-based management to automate and accelerate deployment of all your applications, including virtualization and cloud computing, scale-out and bare-metal workloads, and in-memory analytics, as well as edge computing that supports remote and branch locations and massive amounts of data from the Internet of Things (IoT).
Cisco UCS is based on the concept that infrastructure is code. Servers are designed to be stateless, with their identity, configuration, and connectivity extracted into variables that can be set through software. This enables management tools to help guarantee consistent, error-free, policy-based alignment of server personalities with workloads. Through automation, transforming the server and networking components of your infrastructure into a complete solution is fast and error-free because programmability eliminates the error-prone manual configuration of servers and integration into solutions. Server, network, and storage administrators are now free to focus on strategic initiatives rather than spending their time performing tedious tasks.
For more details, go to: https://www.cisco.com/site/us/en/products/computing/servers-unified-computing-systems/resources.html
Cisco UCS Differentiators
Cisco Unified Computing System is revolutionizing the way servers are managed in the datacenter. The following are the unique differentiators of Cisco Unified Computing System and Cisco UCS Manager:
● Embedded Management—In Cisco UCS, the servers are managed by the embedded firmware in the Fabric Inter-connects, eliminating the need for any external physical or virtual devices to manage the servers.
● Unified Fabric—In Cisco UCS, from blade server chassis or rack servers to FI, there is a single Ethernet cable used for LAN, SAN, and management traffic. This converged I/O results in reduced cables, SFPs and adapters – reducing capital and operational expenses of the overall solution.
● Auto Discovery—By simply inserting the blade server in the chassis or connecting the rack server to the fabric interconnect, discovery and inventory of compute resources occurs automatically without any management intervention. The combination of unified fabric and auto-discovery enables the wire-once architecture of Cisco UCS, where compute capability of Cisco UCS can be extended easily while keeping the existing external connectivity to LAN, SAN, and management networks.
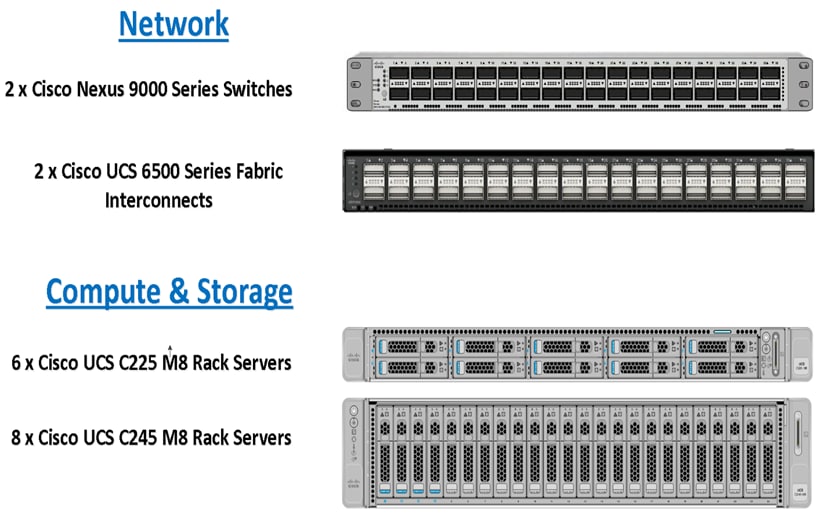
Cisco Intersight
Cisco Intersight is the premier management platform for Cisco UCS. It connects to the systems’ fabric interconnects when they are configured for Intersight managed mode. Because it is cloud based, Software as a Service (SaaS), it has a broad scope that extends to complete infrastructure and application lifecycle management. It has limitless scale so you can manage all your infrastructure from a single control point with role- and policy-based automation. Cisco Intersight can usher your IT operations into today’s hybrid cloud world with your on-premises infrastructure acting as the foundation, with the capability to move and optimize workload performance across multiple clouds. Because it is SaaS, you don’t have to support management servers or worry about updates: you are always accessing the latest software, and you benefit from a continuous stream of new capabilities and features.
Cisco Intersight Software as a Service (SaaS) unifies and simplifies your experience of the Cisco Unified Computing System (Cisco UCS) (Figure 2).
With Intersight, you get all the benefits of SaaS delivery and full lifecycle management of distributed infrastructure across data centers, remote sites, branch offices, and edge environments. This empowers you to deploy, configure, secure, update, maintain, automate, and scale your environment through a cloud-operating model in ways that were not previously possible. As a result, your organization can operate with consistency and control, stay in compliance, and strengthen your security posture to deliver IT infrastructure, resources, and applications faster to support business growth.
For more information, see the following:
● https://www.cisco.com/c/en_sg/products/cloud-systems-management/intersight/index.html
The Cisco UCS 6536 Fabric Interconnect (FI) is a core part of the Cisco Unified Computing System, providing both network connectivity and management capabilities for the system. The Cisco UCS 6536 Fabric Interconnect offers line-rate, low-latency, lossless 10/25/40/100 Gigabit Ethernet, Fibre Channel, NVMe over Fabric, and Fibre Channel over Ethernet (FCoE) functions.
The Cisco UCS 6536 Fabric Interconnect provides the communication backbone and management connectivity for the Cisco UCS X-Series compute nodes, Cisco UCS X9508 X-Series chassis, Cisco UCS B-Series blade servers, Cisco UCS 5108 B-Series server chassis, and Cisco UCS C-Series rack servers. All servers attached to a Cisco UCS 6536 Fabric Interconnect become part of a single, highly available management domain. Additionally, by supporting a unified fabric, Cisco UCS 6536 Fabric Interconnect provides both LAN and SAN connectivity for all servers within its domain.
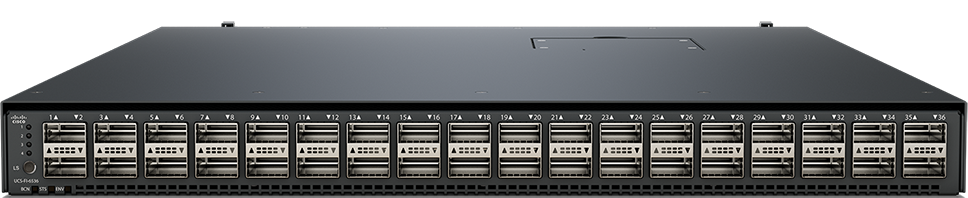
The Cisco UCS 6536 Fabric Interconnect is built to consolidate LAN and SAN traffic onto a single unified fabric, saving on Capital Expenditures (CapEx) and Operating Expenses (OpEx) associated with multiple parallel networks, different types of adapter cards, switching infrastructure, and cabling within racks.
The Cisco UCS 6536 Fabric Interconnect can be managed through Cisco Intersight. The UCS 6536 Fabric Interconnect supports Intersight Managed Mode (IMM), which enables full manageability of Cisco UCS elements behind the UCS 6536 FI through Cisco Intersight. UCS 6536 Fabric Interconnect in Intersight managed mode will support Cisco UCS product models, including Cisco UCS X-Series Servers, Cisco UCS B-Series Blade Servers, and C-Series Rack Servers, as well as the associated storage resources and networks. For more detail, go to: https://www.cisco.com/c/en/us/products/collateral/servers-unified-computing/ucs6536-fabric-interconnect-ds.html
Cisco UCS C-Series Rack Servers
The Cisco UCS C-Series is a family of rack-mount servers designed to deliver high performance, scalability, and flexibility for a wide range of data center workloads. These servers can be deployed as standalone systems or integrated into the broader Cisco Unified Computing System (UCS) architecture for centralized management and automation. For more information, go to: https://www.cisco.com/site/us/en/products/computing/servers-unified-computing-systems/ucs-c-series-rack-servers/resources.html
For this solution, we deployed Cisco’s M8 generation of UCS C-Series rack servers C225 and C245 as explained below.
Cisco UCS C225 M8 Rack Server
The Cisco UCS C225 M8 Rack Server is a versatile general-purpose infrastructure and application server. This high-density, 1RU, single-socket rack server delivers industry-leading performance and efficiency for a wide range of workloads, including virtualization, collaboration, and bare-metal applications. The Cisco UCS C225 M8 Rack Server extends the capabilities of the Cisco UCS rack server portfolio. It powers 5th Gen and 4th Gen AMD EPYC™ Processors with 150 percent more cores per socket designed using AMD’s chiplet architecture. With advanced features such as AMD Infinity Guard, compute-intensive applications will see significant performance improvements and reap other benefits such as power and cost efficiencies.
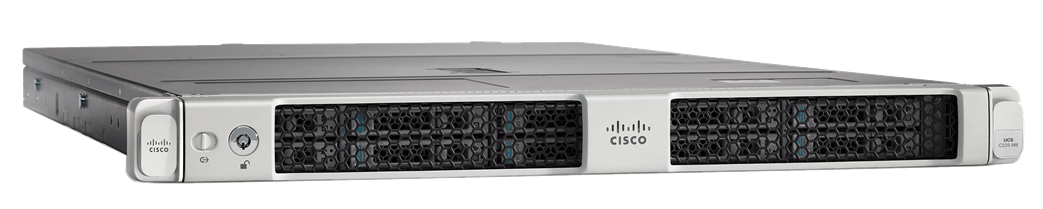
You can deploy the Cisco UCS C-Series rack servers as standalone servers or as part of the Cisco Unified Computing System™ managed by Cisco Intersight® or Cisco UCS Manager to take advantage of Cisco® standards-based unified computing innovations that can help reduce your Total Cost of Ownership (TCO) and increase your business agility.
The Cisco UCS C225 M8 rack server brings many new innovations to the Cisco UCS AMD rack server portfolio. With the introduction of PCIe Gen 5.0 for high-speed I/O, a DDR5 memory bus, and expanded storage capabilities, the server delivers significant performance and efficiency gains that will improve your application performance. For more details, go to: https://www.cisco.com/c/en/us/products/collateral/servers-unified-computing/ucs-c-series-rack-servers/ucs-c225-m8-rack-server-ds.html
Cisco UCS C245 M8 Rack Server
The Cisco UCS C245 M8 Rack Server is perfectly suited for a wide range of storage and I/O-intensive applications such as big data analytics, databases, collaboration, virtualization, consolidation, AI/ML, and high-performance computing supporting up to two AMD CPUs in a 2RU form factor.
The Cisco UCS C245 M8 Rack Server extends the capabilities of the Cisco UCS rack server portfolio. It powers 5th Gen and 4th Gen AMD EPYC™ Processors with up to 160 cores per socket designed using AMD’s chiplet architecture. With advanced features like AMD Infinity Guard, compute-intensive applications will see significant performance improvements and will reap other benefits such as power and cost efficiencies.
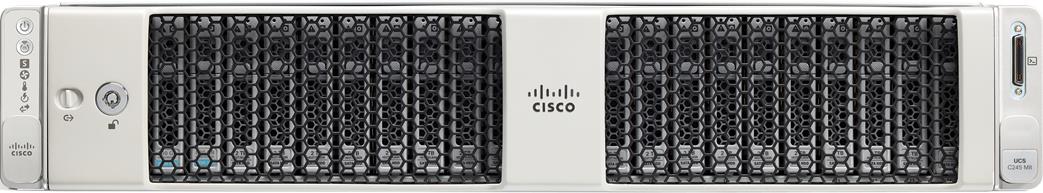
Cisco UCS C245 M8 Rack Servers can be deployed as part of a Cisco UCS–managed environment, through Cisco Intersight, or standalone. When used in combination with Cisco Intersight, the C245 M8 brings the power and automation of unified computing to enterprise applications, including Cisco Single Connect technology, drastically reducing switching and cabling requirements.
For more details, go to: https://www.cisco.com/c/en/us/products/collateral/servers-unified-computing/ucs-c-series-rack-servers/ucs-c245-m8-rack-server-ds.html
Cisco UCS Virtual Interface Card
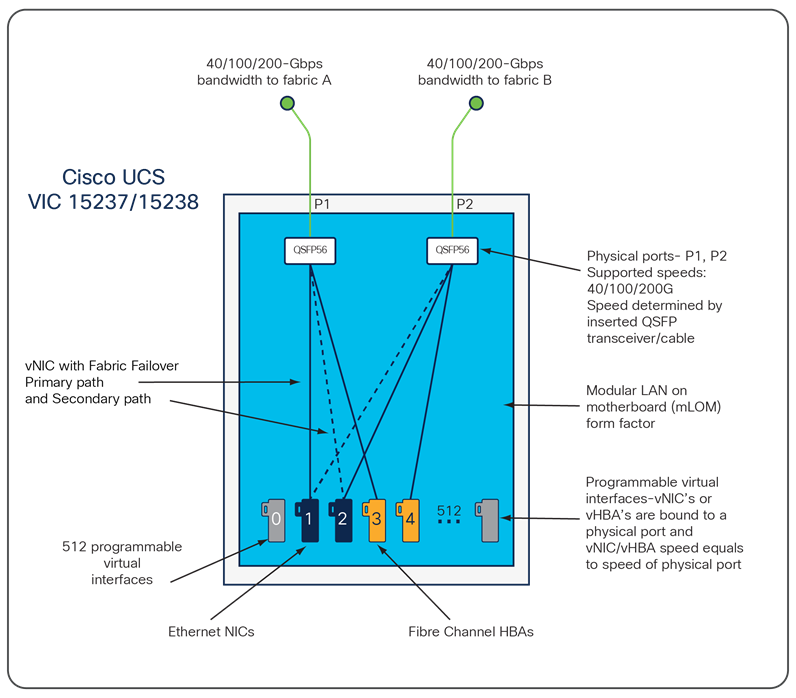
The Cisco UCS Virtual Interface Card (VIC) 15000 Series extends the network fabric directly to both servers and virtual machines so that a single connectivity mechanism can be used to connect both physical and virtual servers with the same level of visibility and control. Cisco® VICs provide complete programmability of the Cisco UCS I/O infrastructure, with the number and type of I/O interfaces configurable on demand with a zero-touch model.
Cisco VICs can support 512 PCI Express (PCIe) virtual devices, either virtual Network Interface Cards (vNICs) or virtual Host Bus Adapters (vHBAs), with a high rate of I/O Operations Per Second (IOPS), support for lossless Ethernet, and 10/25/40/50/100/200-Gbps connection to servers. Cisco VICs supports NIC teaming with fabric failover for increased reliability and availability. In addition, it provides a policy-based, stateless, agile server infrastructure for your data center.
Cisco VIC 15237
The Cisco UCS VIC 15237 and 15238 are dual-port quad small-form-factor pluggable (QSFP/QSFP28/QSFP56) mLOM cards designed for Cisco UCS C-Series M6/M7/M8 rack servers. The card supports 40/100/200-Gbps Ethernet or FCoE. The card can present PCIe standards-compliant interfaces to the host, and these can be dynamically configured as either NICs or HBAs.
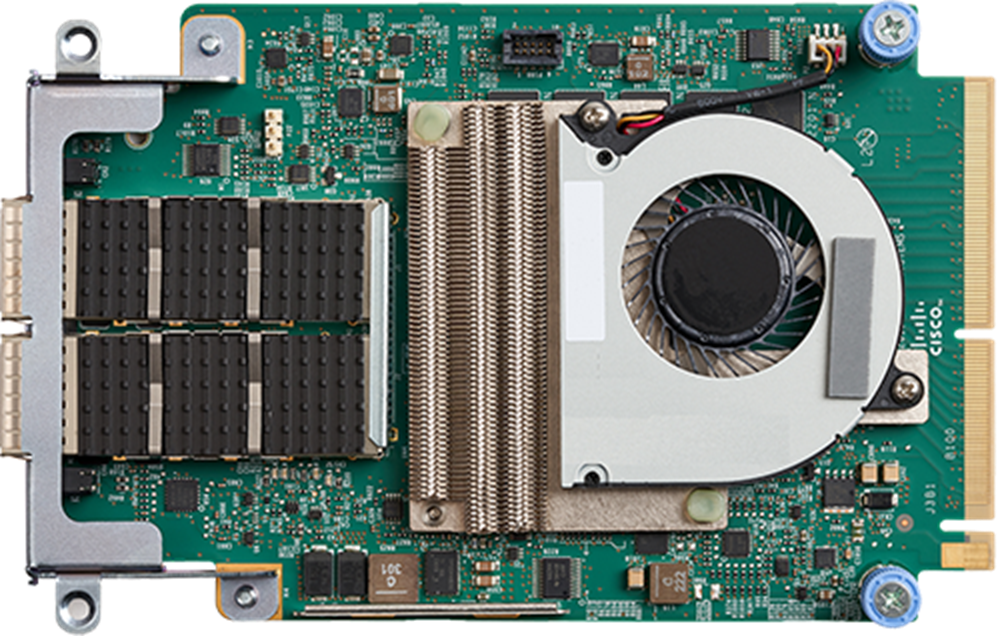
When a Cisco UCS rack server with VIC 15237 is connected to a fabric interconnect (FI-6536), the VIC adapter is provisioned through Cisco Intersight Managed Mode (IMM) or Cisco UCS Manager (UCSM) policies. When the UCS rack server with VIC 15237 is connected to a ToR switch such as Cisco Nexus 9000 Series, the VIC adapter is provisioned through the Cisco IMC or Intersight policies for a UCS standalone server.
For more information, go to: https://www.cisco.com/c/en/us/products/collateral/interfaces-modules/unified-computing-system-adapters/ucs-vic-15000-series-ds.html
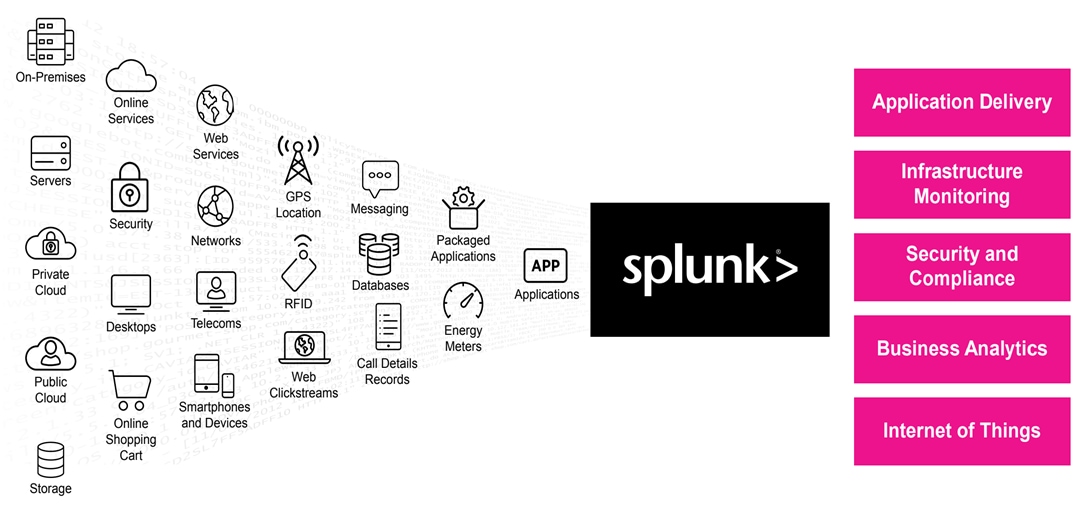
Splunk Enterprise is a software product that enables you to search, analyze, and visualize the data gathered from the components of your IT infrastructure or business. Splunk Enterprise collects data from any source, including metrics, logs, clickstreams, sensors, stream network traffic, web servers, custom applications, hypervisors, containers, social media, and cloud services. It enables you to search, monitor and analyze that data to discover powerful insights across multiple use cases like security, IT operations, application delivery and many more. With Splunk enterprise, everyone from data and security analyst to business users can gain insights to drive operational performance and business results. Splunk makes it easy to input data from virtually any source — without the limitations of database structures.
Splunk Enterprise scales hundreds of terabytes per day to meet the needs of any organization, and supports clustering, high availability, and disaster recovery configurations. It achieves all of this while helping with security and compliance. You can deploy Splunk Enterprise on-premises or in the cloud, use it as a SaaS service via Splunk Cloud Platform, or in any combination you like.
Splunk Enterprise performs three main functions as it processes data:
● It ingests data from files, the network, or other sources.
● It parses and indexes the data.
● It runs searches on the indexed data.
Depending on your needs, you can deploy Splunk Enterprise as a single instance, or you can create deployments that span multiple instances, ranging from just a few to hundreds or even thousands of instances. In small deployments, one instance of Splunk Enterprise handles all aspects of processing data, from input through indexing to search. A single-instance deployment can be useful for testing and evaluation purposes and might serve the needs of department-sized environments.
To support larger environments where data originates on many machines, where you need to process large volumes of data, or where many users need to search the data, you can scale the deployment by distributing Splunk Enterprise instances across multiple machines. This is known as a "distributed deployment". In a typical distributed deployment, each Splunk Enterprise instance performs a specialized task and resides on one of three processing tiers corresponding to the main processing functions:
● Data input tier
● Indexer tier
● Search management tier
Specialized instances of Splunk Enterprise are known collectively as components. With one exception, components are full Splunk Enterprise instances that have been configured to focus on one or more specific functions, such as indexing or search. The exception is the universal forwarder, which is a lightweight version of Splunk Enterprise with a separate executable. There are several types of Splunk Enterprise components. Table 1 lists the tiers and components of Splunk software deployments.
Table 1. Splunk software deployment tiers and components
| Tier |
Components |
Description |
Note |
| Management |
Deployment Server (DS) |
The deployment server manages configuration of forwarder configuration |
Should be deployed on a dedicated instance. |
| License Manager (LM) |
The license manager is required by other Splunk software components to enable licensed features and track daily data ingest volume. |
The license manager role has minimal capacity and availability requirements and can be collocated with other management functions. |
|
| Monitoring Console (MC) |
The monitoring console provides dashboards for usage and health monitoring of your environment. It also contains a number of prepackaged platform alerts that can be customized to provide notifications for operational issues |
In clustered environments, the MC can be collocated with the Manager Node, in addition to the License Manager and Deployment server function in non-clustered deployments. |
|
| Cluster Manager (CM) |
The cluster manager is the required coordinator for all activity in a clustered deployment. |
In clusters with a large number of index buckets (high data volume/retention), the cluster manager will likely require a dedicated server to run on. |
|
| Search |
Search Head (SH) |
The search head provides the UI for Splunk users and coordinates scheduled search activity. |
Search heads are dedicated Splunk software instances in distributed deployments. |
| Search Head Cluster (SHC) |
A search head cluster is a pool of at least three clustered Search Heads. It provides horizontal scalability for the search head tier and transparent user failover in case of outages. |
Search head clusters require dedicated servers of ideally identical system specifications. |
|
| Indexing |
Indexer |
Indexers are the heart and soul of a Splunk deployment. They process and index incoming data and serve as search peers to fulfill search requests initiated on the search tier. |
Indexers must always be on dedicated servers in distributed or clustered deployments. Indexers perform best on bare metal servers or in dedicated, high-performance virtual machines, if adequate resources can be guaranteed. |
| Data Collection |
Forwarders |
General icon for any component involved in data collection. |
This includes universal and heavy forwarders, network data inputs and other forms of data collection |
For more detail information, go to: https://docs.splunk.com/Documentation/SVA/current/Architectures/Topology
For this solution, we deployed Splunk enterprise on Single Site Distributed Clustered mode with Search Head Cluster (SHC) topology. The Single Site Distributed Clustered Deployment with a Search Head Cluster (SHC) topology uses clustering to add horizontal scalability and removes the single point of failure from the search tier. Figure 3 illustrates a single site distributed clustered deployment with a search head cluster (SHC) topology.
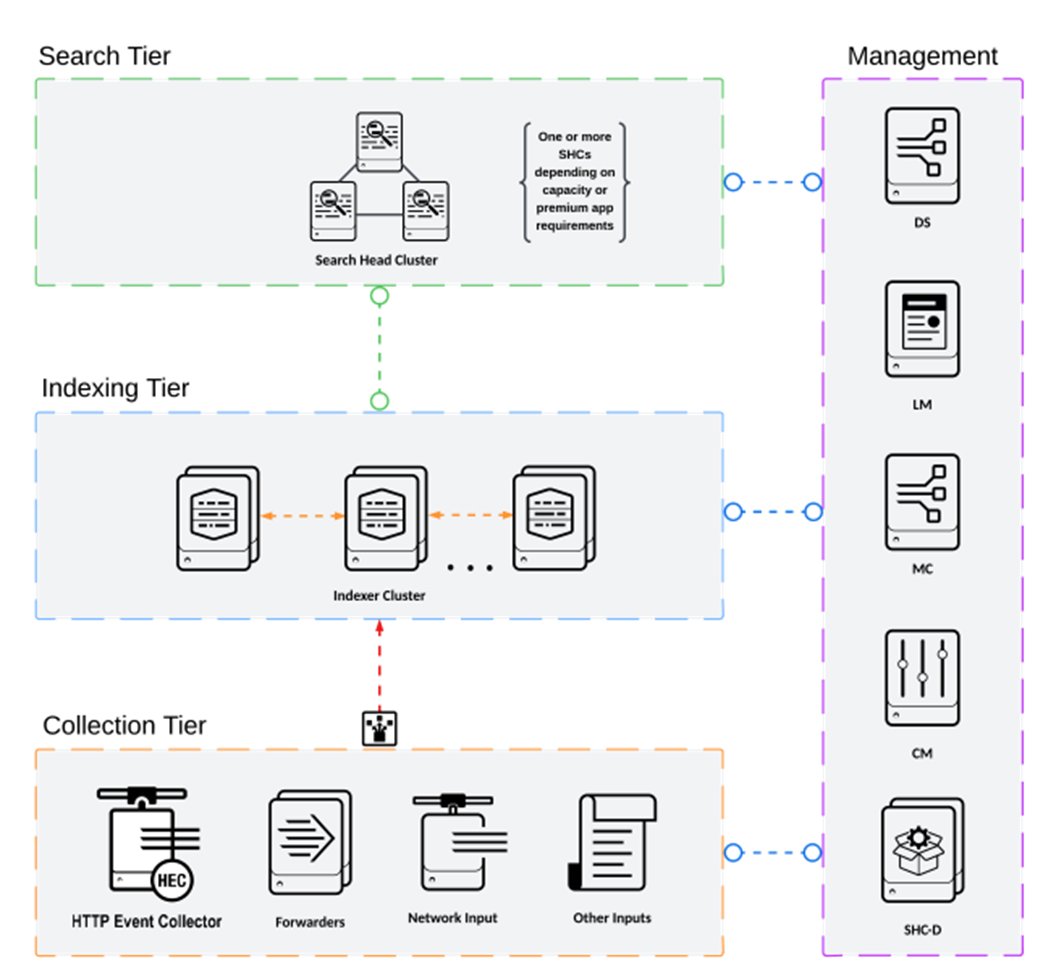
For more information, go to the Splunk Validated Architecture reference here: https://docs.splunk.com/Documentation/SVA/current/Architectures/C3C13
Note: If you’re considering deploying Enterprise Security (ES) in a C13 category code, review the guidance to install ES in search head cluster environments. Splunk strongly recommends engaging with Splunk Professional Services when deploying ES in a HA/DR environment.
Solution Design
This chapter contains the following:
The following sections detail the physical hardware, software revisions, and firmware versions required for deploying Splunk Enterprise on Cisco UCS.
Physical components
Figure 4 illustrates the single rack configuration containing six Cisco UCS C225 and eight Cisco UCS C245 M8 servers along with networking and management switches. Each server is then connected to each of the Fabric Interconnect (FI) by means of dedicated 100G ethernet link. This solution provides an end-to-end 100Gbps Ethernet capable architecture to demonstrate the benefits for running Splunk enterprise environment with superior performance, scalability and high availability using NVMe High Perf Endurance local storage drives.
The reference architecture highlighted in this deployment guide can be further extended to multiple racks catering to specific data storage and processing for the large-scale enterprise deployment with healthy data-movement.
Note: 2.4 TB/day is computed based on indexer’s capacity of indexing 300G per day for core IT operational analytics use cases.
The inventory of the hardware components used in this solution architecture is listed in Table 2.
Table 2. Hardware Inventory and Bill of Material
| Name |
Description |
PID |
Quantity |
| Cisco UCS 6536 Fabric Interconnects |
Cisco UCS 6536 Fabric Interconnect providing both network connectivity and management capabilities for the system |
UCS-FI-6536 |
2 |
| Cisco UCS Nexus Switch |
Cisco Nexus 9336C-FX2 Switch for uplink network connectivity |
N9K-9336C-FX2 |
2 |
| Cisco UCS C225 M8 |
Cisco UCS C-Series 1RU C225 M8 Compute Server Node |
UCSC-C225-M8S |
6 |
| Cisco UCS C245 M8 |
Cisco UCS C-Series 2RU C245 M8 Compute Server Node |
UCSC-C245-M8SX |
8 |
Note: To run Splunk enterprise management tier nodes (admin nodes), we used identical three Cisco UCSC C225 M8 Servers with the following configuration as described in the tables below.
Table 3. Hardware Inventory and Bill of Material
| Name |
Model |
Description |
PID |
| CPU |
16 Cores Processor (1 x AMD EPYC 9124) |
AMD 9124 3.0GHz 200W 16C/64MB Cache DDR5 4800MT/s |
UCS-CPU-A9124 |
| Memory |
192 GB (12 x 16G DDR5) |
16GB DDR5-5600 RDIMM 1Rx8 (16Gb) |
UCS-MRX16G1RE3 |
| Network Adapter |
1 x Cisco VIC 15237 |
Cisco VIC 15237 2x 40/100/200G mLOM C-Series w/Secure Boot |
UCSC-M-V5D200GV2D |
| RAID Controller |
HWRAID |
Cisco Boot optimized M.2 Raid controller. Support for RAID1 |
UCS-M2-HWRAID |
| Cisco Tri-Mode 24G SAS RAID Controller for Local Storage |
Cisco Tri-Mode 24G SAS RAID Controller w/4GB Cache. Support for RAID0, RAID1, RAID5, RAID6, RAID10, RAID50, RAID60 |
UCSC-RAID-HP |
|
| Boot |
2 x 480GB M.2 SATA SSD configured in RAID 1 for OS |
480GB M.2 SATA SSD |
UCS-M2-480G |
| Storage |
2 x 960G NVMe local drives for data storage |
960GB 2.5in U.3 Micron 7450 NVMe High Perf Medium Endurance |
UCS-NVMEG4-M960 |
Note: To run Splunk enterprise search tier nodes (search heads), we used identical three Cisco UCSC C225 M8 Servers with the following configuration as described in the table below.
Table 4. Hardware Inventory and Bill of Material
| Name |
Model |
Description |
PID |
| CPU |
24 Cores Processor (1 x AMD EPYC 9224) |
AMD 9224 2.5GHz 200W 24C/64MB Cache DDR5 4800MT/s |
UCS-CPU-A9224 |
| Memory |
384 GB (12 x 32G DDR5) |
32GB DDR5-5600 RDIMM 1Rx4 (16Gb) |
UCS-MRX32G1RE3 |
| Network Adapter |
1 x Cisco VIC 15237 |
Cisco VIC 15237 2x 40/100/200G mLOM C-Series w/Secure Boot |
UCSC-M-V5D200GV2D |
| RAID Controller |
HWRAID |
Cisco Boot optimized M.2 Raid controller. Support for RAID1 |
UCS-M2-HWRAID |
| Cisco Tri-Mode 24G SAS RAID Controller for local storage |
Cisco Tri-Mode 24G SAS RAID Controller w/4GB Cache. Support for RAID0, RAID1, RAID5, RAID6, RAID10, RAID50, RAID60 |
UCSC-RAID-HP |
|
| Boot |
2 x 480GB M.2 SATA SSD configured in RAID 1 for OS |
480GB M.2 SATA SSD |
UCS-M2-480G |
| Storage |
2 x 960G NVMe local drives for data storage |
960GB 2.5in U.3 Micron 7450 NVMe High Perf Medium Endurance |
UCS-NVMEG4-M960 |
Note: To run Splunk enterprise indexing tier nodes (indexers), we used identical eight Cisco UCSC C245 M8 Servers with the following configuration as described in the table below.
Table 5. Hardware Inventory and Bill of Material
| Name |
Model |
Description |
PID |
| CPU |
48 Cores Processor (2 x AMD EPYC 9224 24-Core) |
AMD 9224 2.5GHz 200W 24C/64MB Cache DDR5 4800MT/s |
UCS-CPU-A9224 |
| Memory |
384 GB (12 x 32G DDR5) |
32GB DDR5-5600 RDIMM 1Rx4 (16Gb) |
UCS-MRX32G1RE3 |
| Network Adapter |
1 x Cisco VIC 15237 |
Cisco VIC 15237 2x 40/100/200G mLOM C-Series w/Secure Boot |
UCSC-M-V5D200GV2D |
| RAID Controller |
HWRAID |
Cisco Boot optimized M.2 Raid controller. Support for RAID1 |
UCS-M2-HWRAID |
| Cisco Tri-Mode 24G SAS RAID Controller for local storage |
Cisco Tri-Mode 24G SAS RAID Controller w/4GB Cache. Support for RAID0, RAID1, RAID5, RAID6, RAID10, RAID50, RAID60 |
UCSC-RAID-HP |
|
| Boot |
2 x 480GB M.2 SATA SSD configured in RAID 1 for OS |
480GB M.2 SATA SSD |
UCS-M2-480G |
| Storage |
16 x 1.9TB NVMe local drives for data storage Hot/Warm Local Storage: 7 TB (8 x 1.9 TB Drives in RAID-10) per Indexer Cold Local Storage: 12.2 TB (8 x 1.9 TB Drives in RAID-5) per Indexer |
1.9TB 2.5in U.3 Micron 7450 NVMe High Perf Medium Endurance |
UCS-NVMEG4-M1920 |
Software components
Table 6 lists the software and firmware version used to validate and deploy this solution.
Table 6. software and firmware revision
| Devices |
Version |
| Cisco UCS FI 6536 |
Bundle Version 4.3(5.250004) |
| Cisco Nexus 9336C-FX2 NXOS |
NXOS System Version - 9.3(7) & BIOS Version – 05.45 |
| Cisco UCS C225 & C245 M8 Server |
Bundle Version 4.3(5.250001) & Firmware Version 4.3(5.250001) |
| Cisco UCS Adapter VIC 15237 |
Firmware Version 5.3(4.84) |
| M.2 Controller |
Firmware Version 2.3.17.1014 |
| MRAID Controller |
Firmware Version 8.6.2.0-00065-00001 |
| Cisco eNIC (Cisco VIC Ethernet NIC Driver) (modinfo enic) |
4.8.0.0-1128.4 (kmod-enic-4.8.0.0-1128.4.rhel9u4_5.14.0_427.13.1.x86_64.rpm) |
| Red Hat Enterprise Linux Server |
Red Hat Enterprise Linux release 9.4 (5.14.0-427.13.1.el9_4.x86_64) |
| Splunk Enterprise Software |
9.4.1 |
Deploying Splunk enterprise on bare metal Cisco UCS rack servers running Red Hat Linux will be carried out on this comprehensive end-to-end 100G architecture, as illustrated in Figure 5. This reference design is a typical network configuration that can be deployed in your environment. You can scale your solution as your workload demands, including expansion to thousands of servers. The configurations vary in disk capacity, bandwidth, price, and performance characteristic.
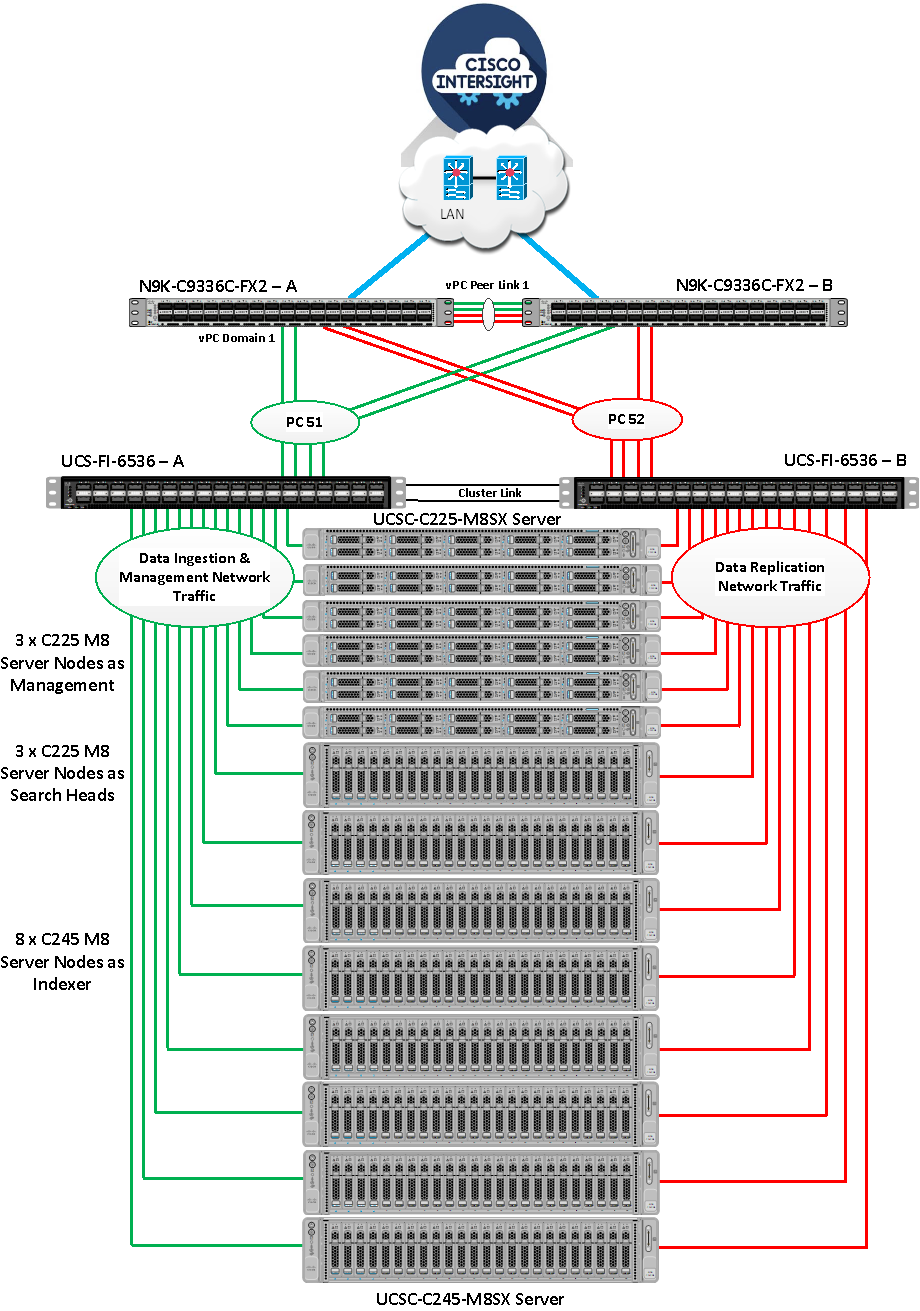
As shown in Figure 5, all the servers are directly connected to the ports of UCS Fabric Interconnects. These ports are configured as server ports in Intersight Managed Mode (IMM). A pair of Cisco UCS 6536 Fabric Interconnects (FI) carries both data ingestion, data replication and management network traffic from the Cisco UCS M8 C225 and C245 servers with the help of Cisco Nexus 9336C-FX2 switches. The Fabric Interconnects and the Cisco Nexus Switches are clustered with the peer link between them to provide high availability. Each server node is equipped with a 5th Gen VIC which offers an aggregate throughput of 200G ethernet connectivity (100G through each FI) in total to the fabric interconnects.
Fabric Interconnect – A links are used for Data Ingestion as well as Management Network Traffic Storage (VLAN1) and shown here as green lines while Fabric Interconnect – B links are used for data replication interconnect network traffic (VLAN 11) and shown here as red lines. This enables Splunk to take advantage of the UCS dual 100G links to isolate the inter server traffic from the ingress (data ingestion from forwards) on separate 10g links. Both VLANs must be trunked to the upstream distribution switch connecting the Fabric Interconnects. Two virtual Port-Channels (vPCs) are configured to provide public network and private network traffic paths for the server blades to northbound Nexus switches.
Additional 1Gb management connections are needed for an out-of-band network switch that is apart from this infrastructure. Each Cisco UCS FI and Cisco Nexus switch is connected to the out-of-band network switch. Although this is the base design, each of the components can be scaled easily to support specific business requirements. For example, more rack servers or even blade chassis can be deployed to increase compute capacity, additional local disk storage capacity can be deployed to improve I/O capability and throughput, and special software features can be added to introduce new features. This document guides you through the detailed steps for deploying the base architecture, as shown in the above figure. These procedures cover everything from physical cabling to network, compute, and storage device configurations.
Figure 6 illustrates the high-level view of the architecture for a Splunk medium or large enterprise deployment.
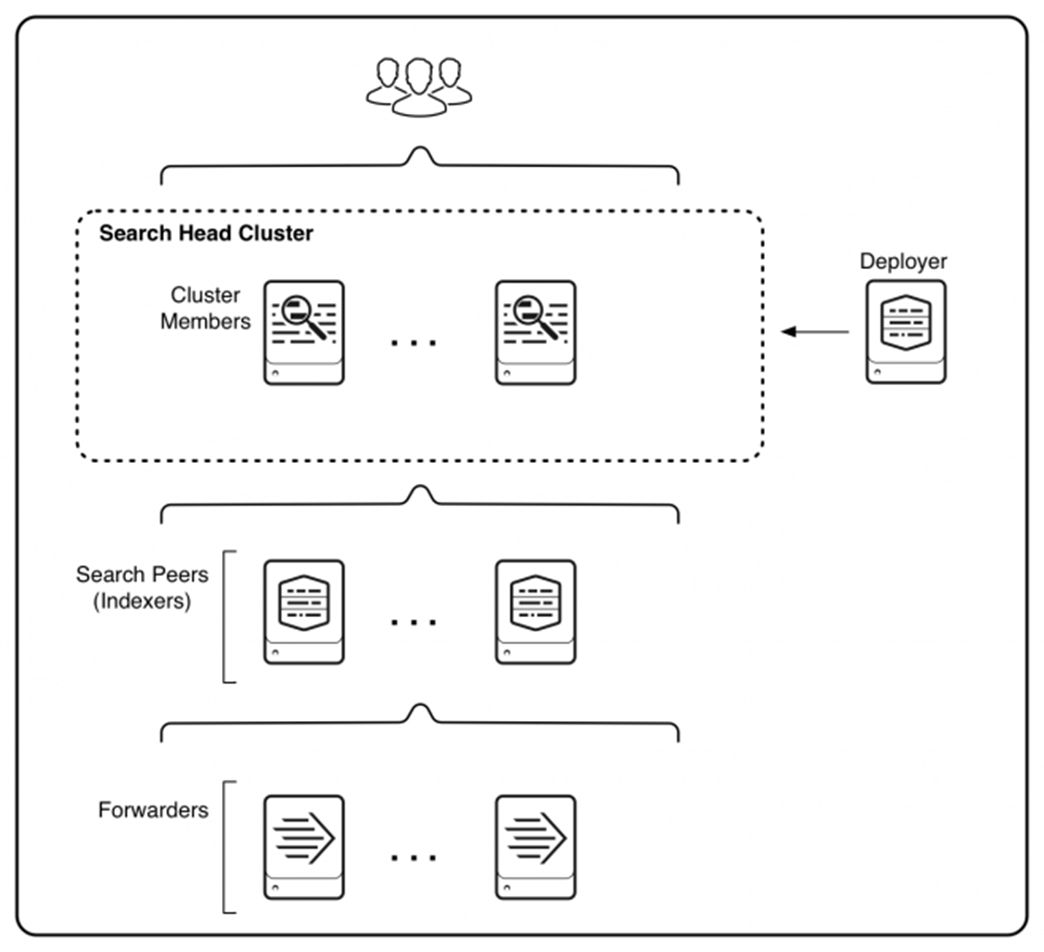
Starting from the bottom, Figure 6 illustrates three tiers of processing:
● Data input. Data enters the system through forwarders, which consume external data and forward the data to the indexers. You configure the forwarders to use their built-in load-balancing capabilities to spread the data across the set of indexers.
● Indexing. Indexers receive, index, and store incoming data from the forwarders.
● Search management. A search head cluster, consisting of three or more search head members, performs the search management function. The search heads in the cluster coordinate their activities to handle search requests, such as ad hoc requests from users and saved search requests, and to distribute the requests across the set of indexers. A deployer distributes apps to the members of the search head cluster.
In the transition from a small enterprise to a medium enterprise deployment, you need to increase both indexing and search capacity. For indexing, you can continue to add indexers. For search, you can add search heads to service more users and more search activity. The recommended approach for deploying multiple search heads is to combine the search heads in a search head cluster. Search head clusters allow users and searches to share resources across the set of search heads. They are also easier to manage than groups of individual search heads. Search head clusters require a minimum of three search heads.
The differences between a medium and a large enterprise deployment are mainly issues of scale and management. The fundamental deployment topologies are similar. They both employ a search head cluster with multiple indexers. A medium to large enterprise deployment provides even greater horizontal scaling. Characteristics of this type of deployment include:
● Indexing volume ranging from 300GB to many TBs per day.
● Many users, potentially numbering several hundred.
● Many thousands of forwarders.
There are several types of components to match the types of tasks in a deployment. Components fall into two broad categories:
● Processing components: These components handle the data.
● Management components: These components support the activities of the processing components.
Processing Components
The types of processing components are:
● Forwarders: Forwarders ingest raw data and forward the data to another component, either another forwarder or an indexer. Forwarders are usually co-located on machines running applications that generate data, such as web servers. The universal forwarder is the most common type of forwarder.
● Indexers: Indexers index and store data. They also search across the data. Indexers usually reside on dedicated machines. Indexers can be either independent (non-clustered) indexers or clustered indexers. Clustered indexers, also known as peer nodes, are nodes in an indexer cluster.
● Search heads: Search heads manage searches. They handle search requests from users and distribute the requests across the set of indexers, which search their local data. The search head then consolidates the results from all the indexers and serves them to the users. The search head provides the user with various tools, such as dashboards, to assist the search experience. Search heads can be independent search heads, search head cluster members, search head nodes in an indexer cluster or search head pool members.
Management Components
Management components are specially configured versions of Splunk Enterprise instances that support the activities of the processing components. A deployment usually includes one or more of these management components:
● Monitoring Console: Performs centralized monitoring of the entire deployment.
● Deployment Server: The deployment server distributes configuration updates and apps to some processing components, primarily forwarders.
● License Manager: The license manager handles Splunk Enterprise licensing
● Cluster Manager: The indexer cluster manager node coordinates the activities of an indexer cluster. It also handles updates for the cluster.
● Search Head Cluster Deployer: The search head cluster deployer handles updates for a search head cluster.
Your deployment might include all or none of these components, depending on the scale and specifics of your deployment topology. Multiple management components sometimes share a single Splunk Enterprise instance, perhaps along with a processing component. In large-scale deployments, however, each management component might reside on a dedicated instance.
Cisco UCS Install and Configure
This chapter contains the following:
● Cisco UCS Configuration – Intersight Managed Mode
● Configure Policies for Cisco UCS Domain
● Configure Cisco UCS Domain Profile
● Configure Policies for Server Profile
This chapter details the Cisco Intersight deployed Cisco UCS C225 and C245 M8 rack server connected to Cisco UCS Fabric Interconnect 6536 as part of the infrastructure build out. For detailed installation information, refer to the Cisco Intersight Managed Mode Configuration Guide
Cisco UCS Configuration – Intersight Managed Mode
This section contains the following procedures:
● Procedure 1. Configure Cisco UCS Fabric Interconnect for Cisco Intersight Managed Mode
● Procedure 2. Claim Fabric Interconnect in Cisco Intersight Platform
● Procedure 3. Configure Cisco Intersight Account and System Settings
● Procedure 5. Configure IMC Access Policy
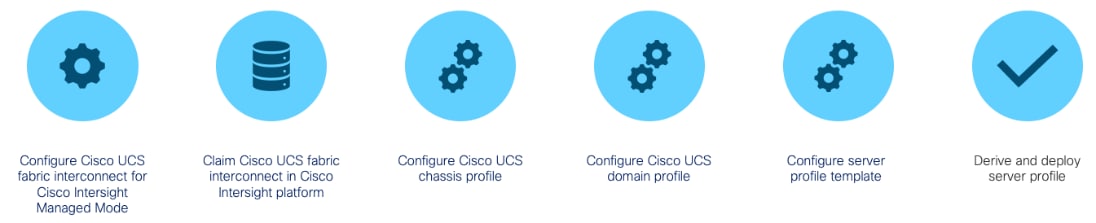
Cisco Intersight Managed Mode (IMM) standardizes policy and operation management for Cisco UCS Servers. The compute nodes in Cisco UCS are configured using server profiles defined in Cisco Intersight. These server profiles derive all the server characteristics from various policies and templates. Figure 7 illustrates the high-level steps to configure Cisco UCS using Intersight Managed Mode.
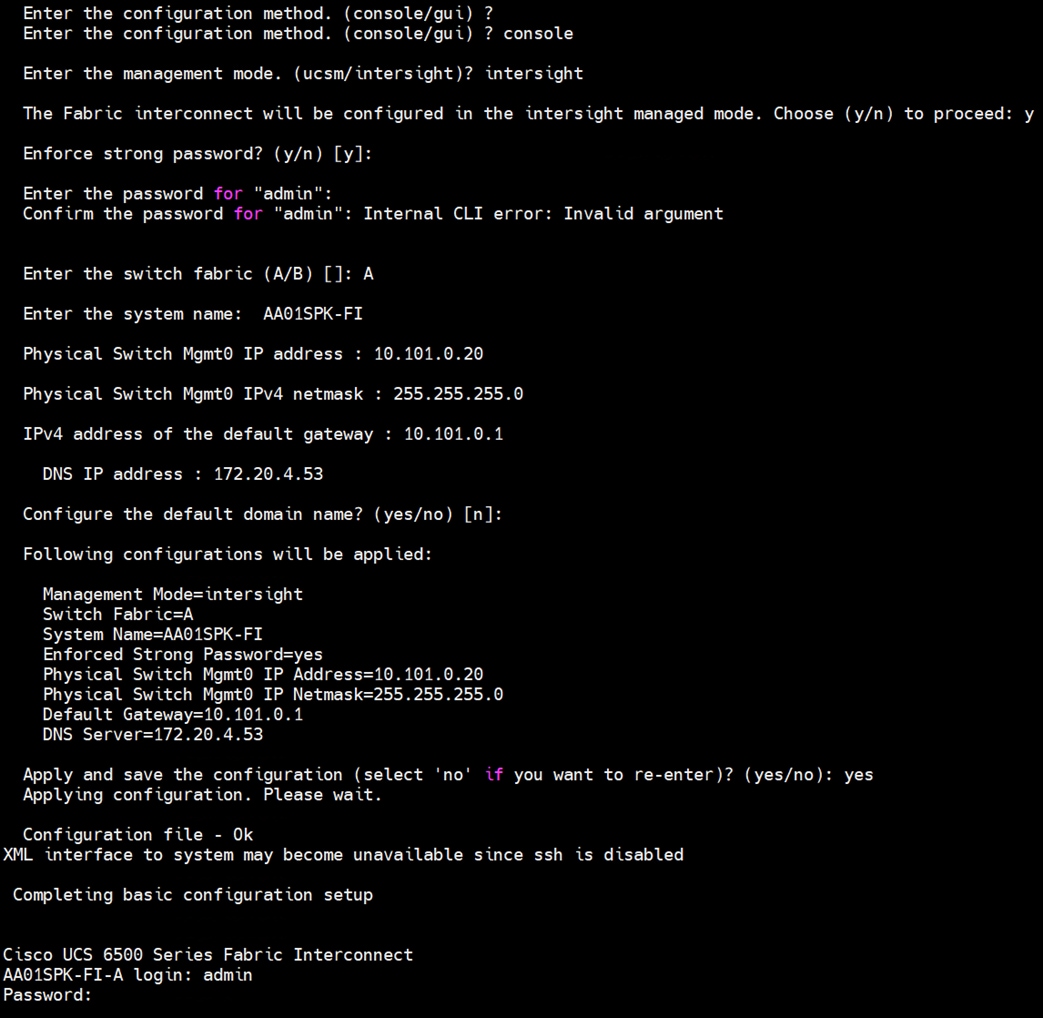
Procedure 1. Configure Cisco UCS Fabric Interconnects for Cisco Intersight Managed Mode
During the initial configuration, for the management mode, the configuration wizard enables you to choose whether to manage the fabric interconnect through Cisco UCS Manager or the Cisco Intersight platform. For this solution, we choose Intersight Managed Mode (IMM) for validating this Splunk Enterprise deployment.
Step 1. Verify the following physical connections on the fabric interconnect:
a. The management Ethernet port (mgmt0) is connected to an external hub, switch, or router.
b. The L1 ports on both fabric interconnects are directly connected to each other.
c. The L2 ports on both fabric interconnects are directly connected to each other.
Step 2. Connect to the console port on the first fabric interconnect and configure the first FI as shown below:
Step 3. Connect the console port on the second fabric interconnect B and configure it as shown below:
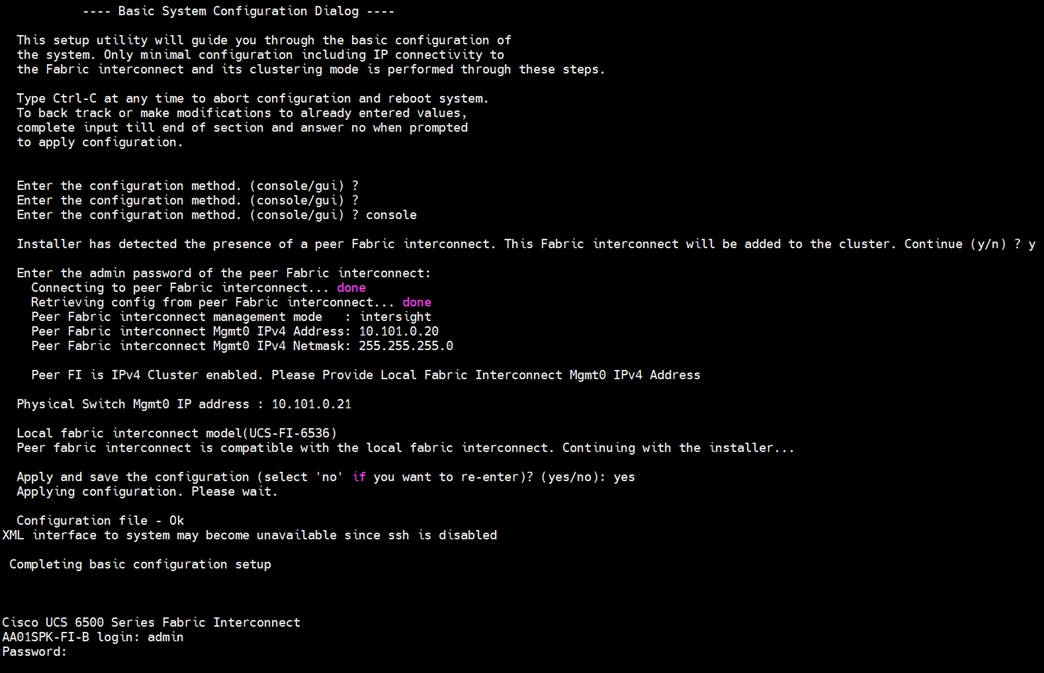
Step 4. After configuring both the FI management addresses, open a web browser and navigate to the Cisco UCS fabric interconnect management address as configured. If prompted to accept security certificates, accept, as necessary.
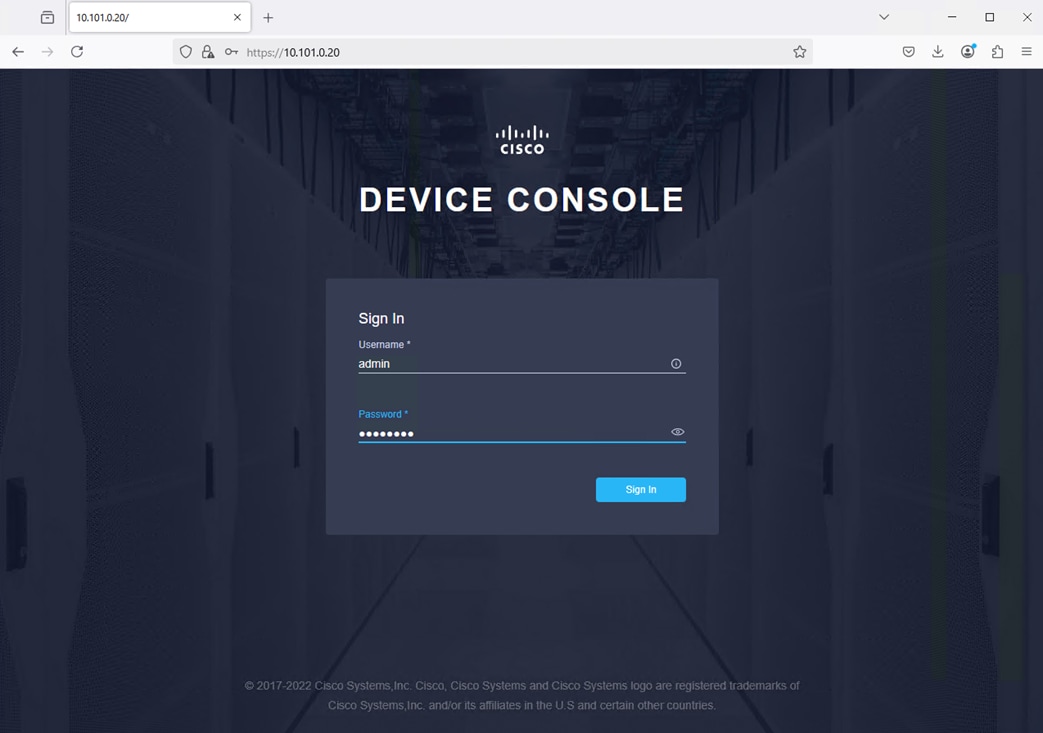
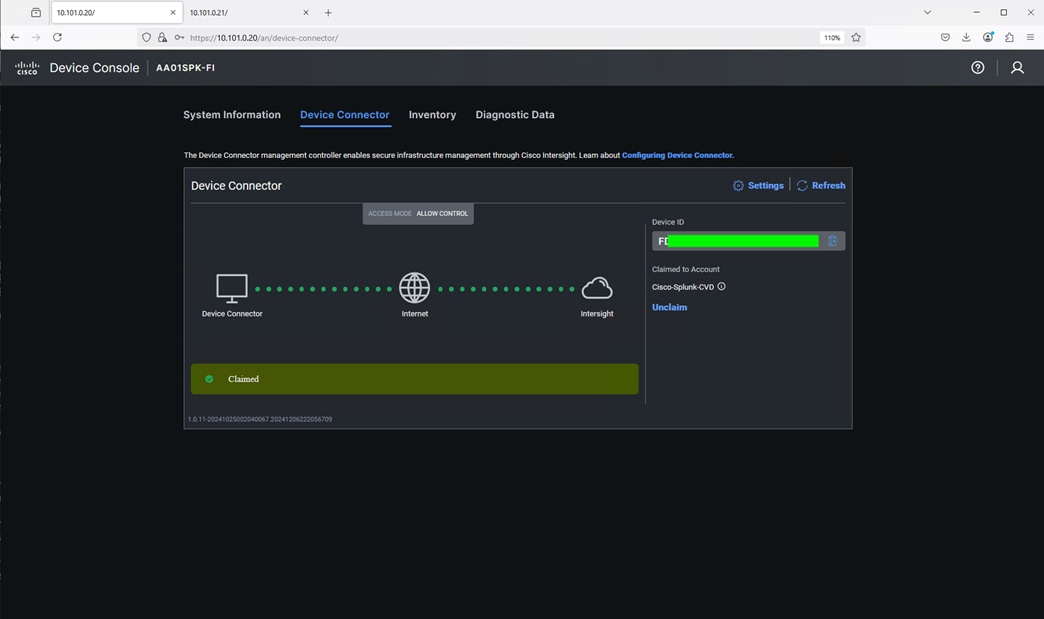
Step 5. Log into the device console for FI-A by entering your username and password.
Step 6. Go to the Device Connector tab and get the DEVICE ID and CLAIM Code as shown below:
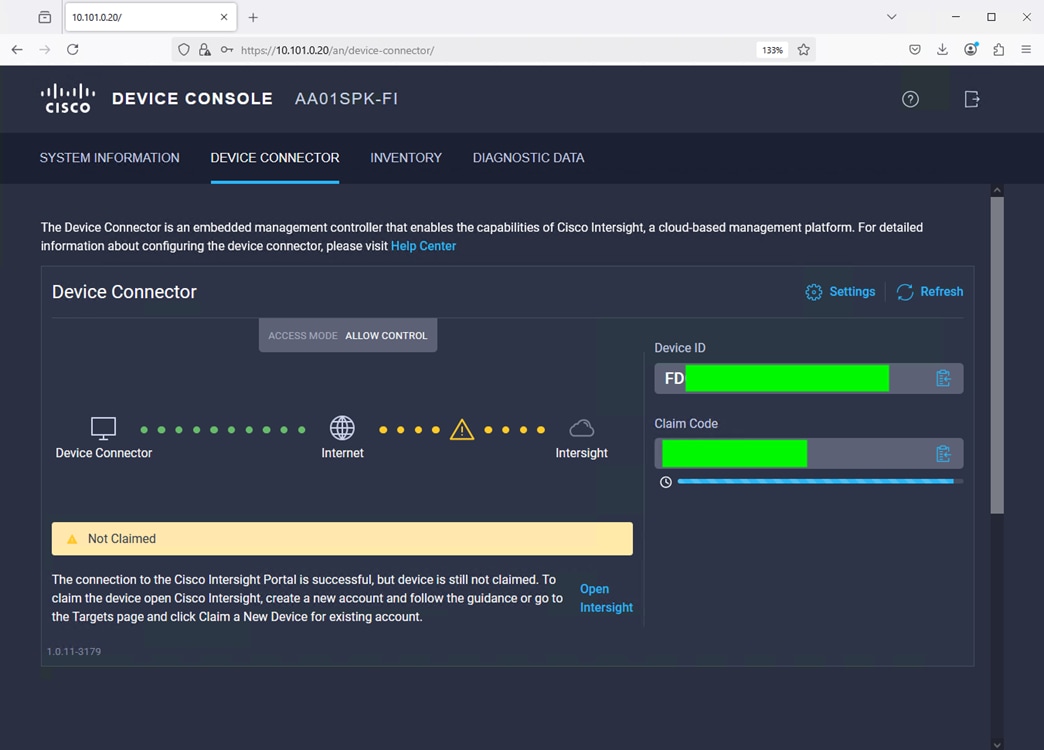
Note: After setting up the Cisco UCS fabric interconnect for Cisco Intersight Managed Mode, FIs can be claimed to a new or an existing Cisco Intersight account. When a Cisco UCS fabric interconnect is successfully added to the Cisco Intersight platform, all subsequent configuration steps are completed in the Cisco Intersight portal.
Procedure 2. Claim Fabric Interconnects in Cisco Intersight Platform
Step 1. After getting the device id and claim code of FI, go to https://intersight.com/.
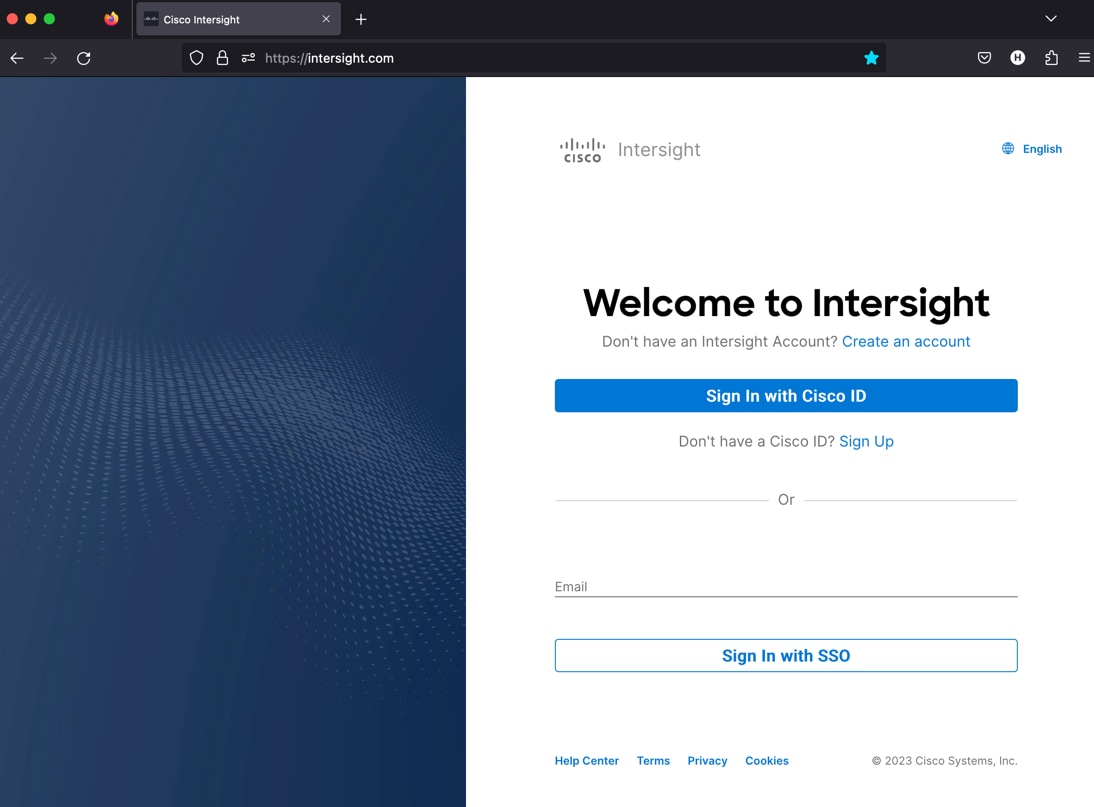
Step 2. Sign in with your Cisco ID or if you don’t have one, click Sing Up and setup your account.
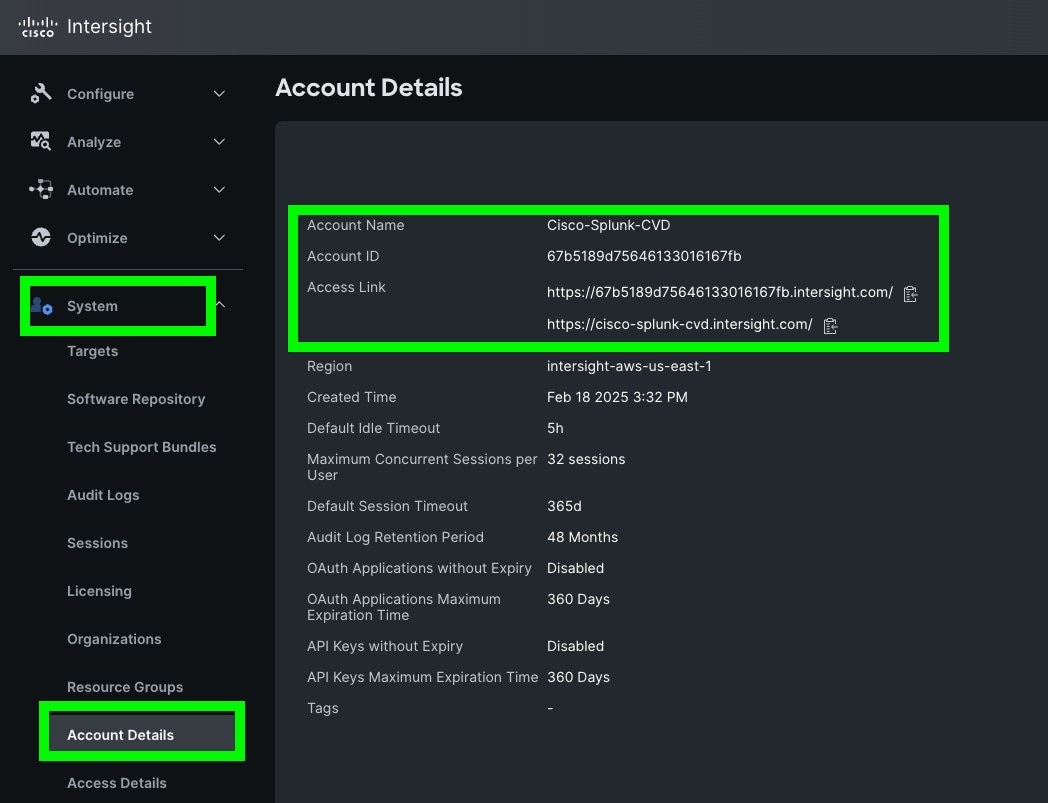
Note: We created the “Cisco-Splunk-CVD” account for this solution.
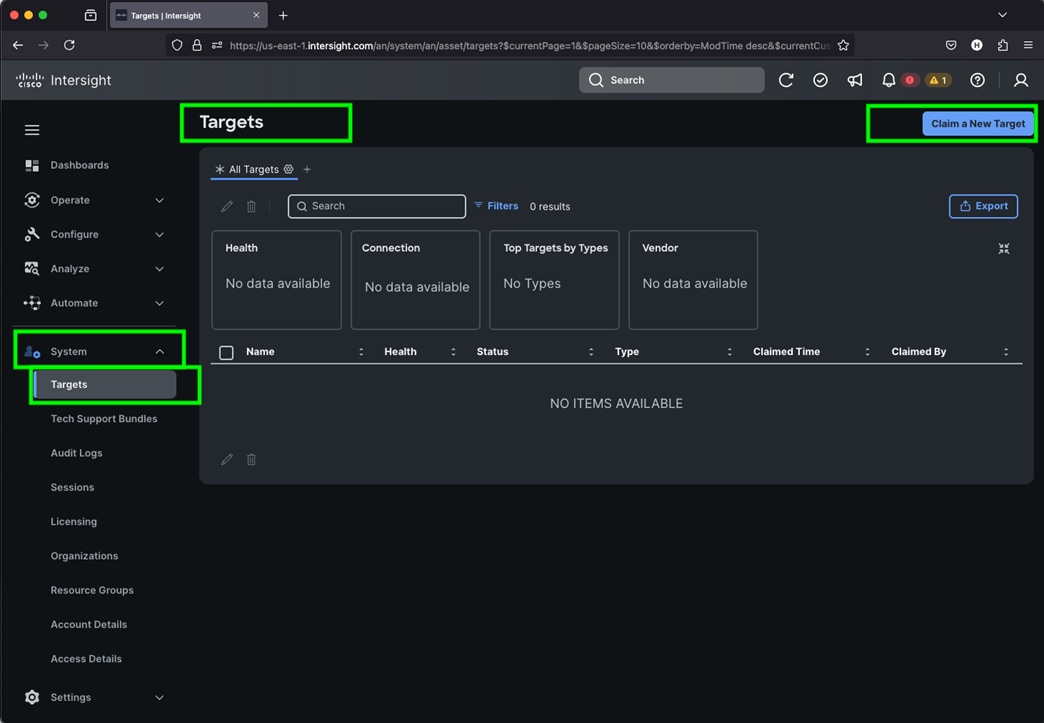
Step 3. After logging into your Cisco Intersight account, go to > System > Targets > Claim a New Target.
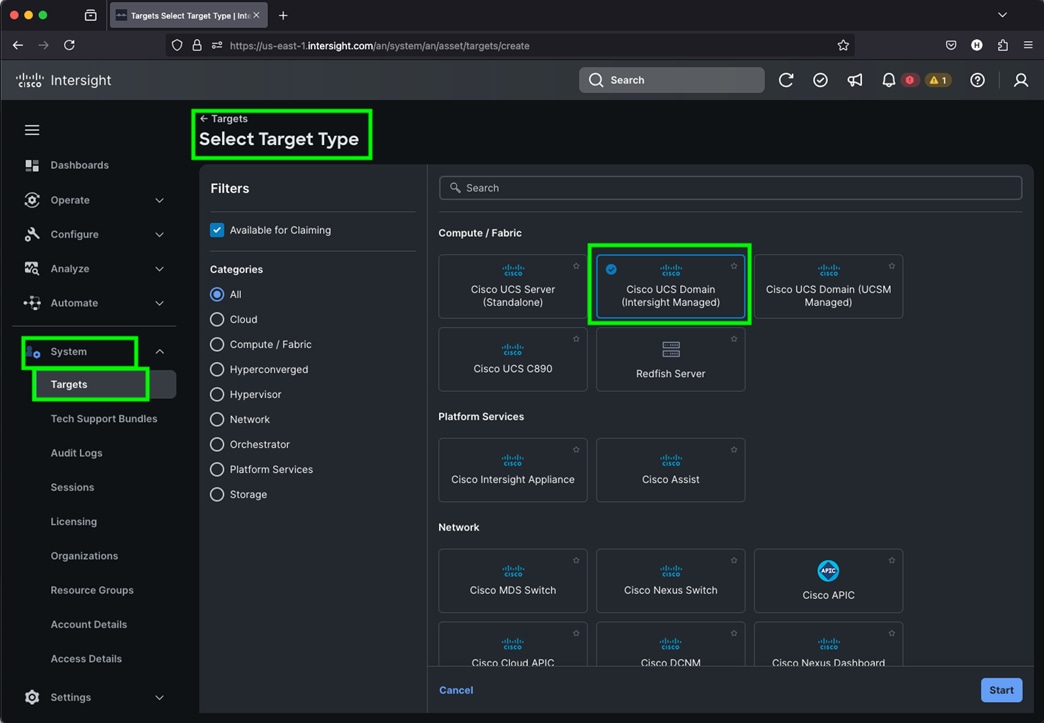
Step 4. For the Select Target Type, select “Cisco UCS Domain (Intersight Managed)” and click Start.
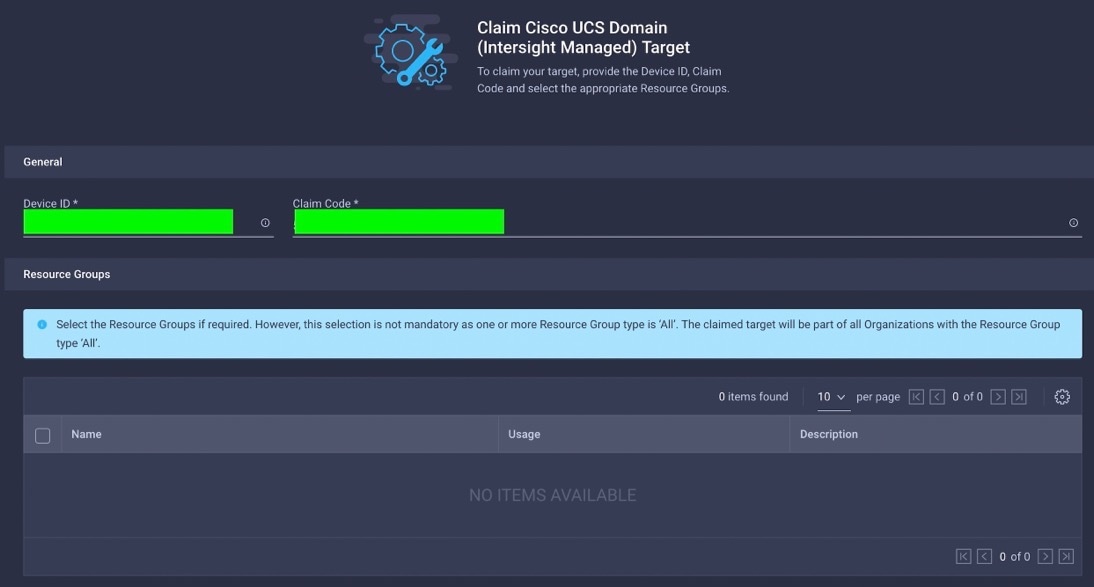
Step 5. Enter the Device ID and Claim Code which was previously captured. Click Claim to claim this domain in Cisco Intersight.
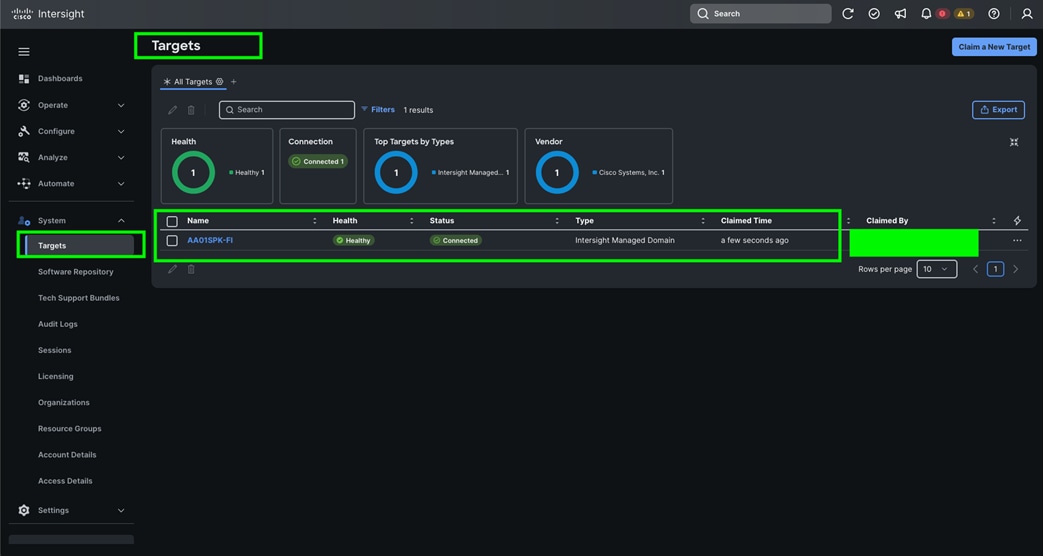
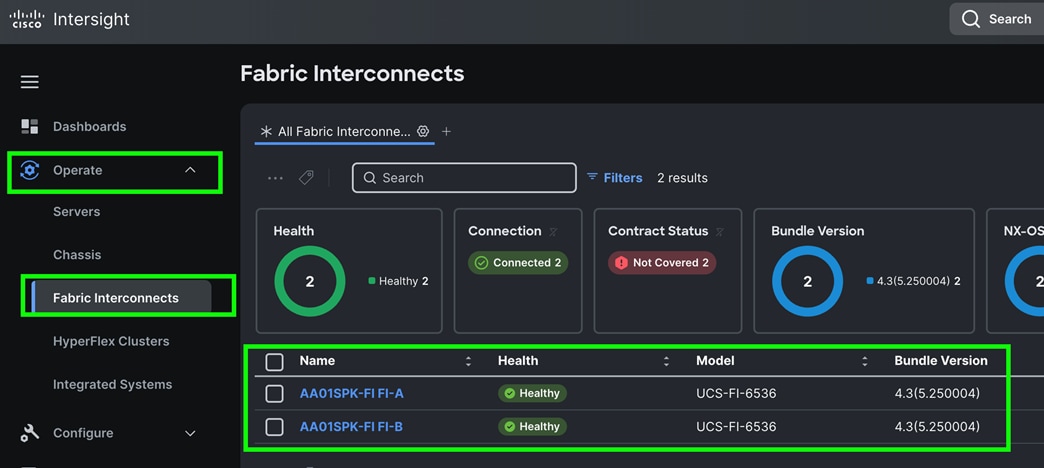
When you claim this domain, you can see both FIs under this domain and verify it’s under Intersight Managed Mode:
Cisco UCS Fabric Interconnect from the OPERATE tab shows details and Management Mode as shown below:
Cisco UCS fabric interconnect Device Console WebUI > Device Connector tab shows claimed account name as shown below:
Procedure 3. Configure Cisco Intersight Account and System Settings
Step 1. Go to System > Account Details. For more details: https://intersight.com/help/saas/system/settings
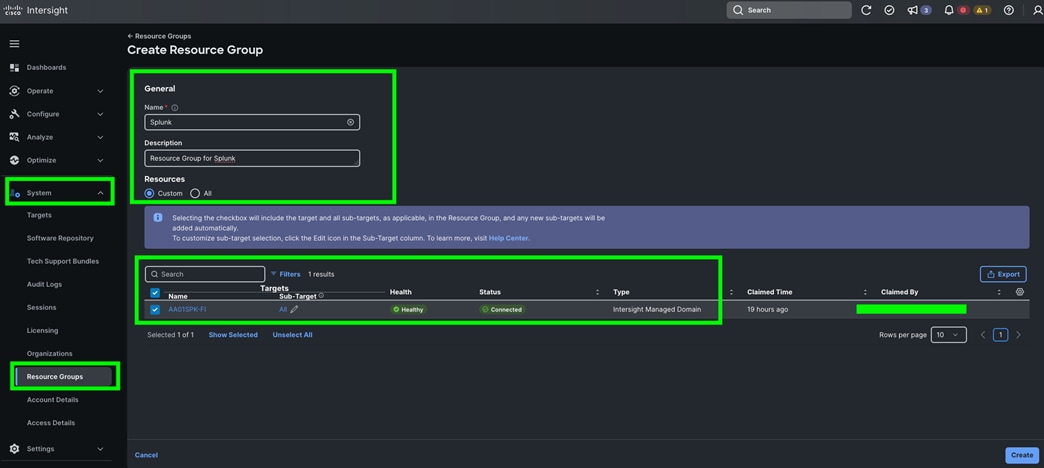
Step 2. In the System tab > Select Resource Group. Create New resource group.
Step 3. Select Targets to be part of this resource group and click Create. For this solution, we created new resource group as “Spk-Resource” and selected all the sub-targets as shown below.
Step 4. Use the “Spk-Resource” group for this solution. Go to System menu, select Organizations then click Create Organization.
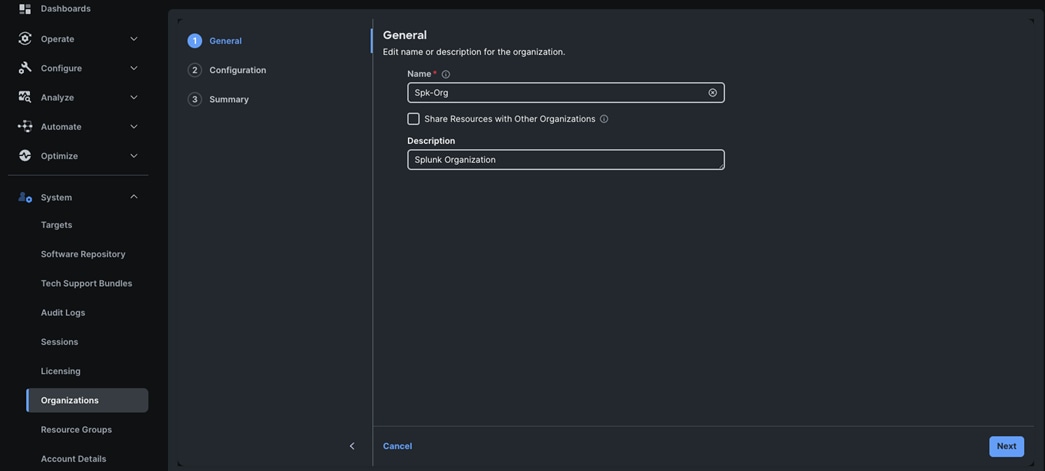
Step 5. Enter the name for the new Organization creation.
Step 6. (Optional) Check the box to share resources with other organizations. Click Next.
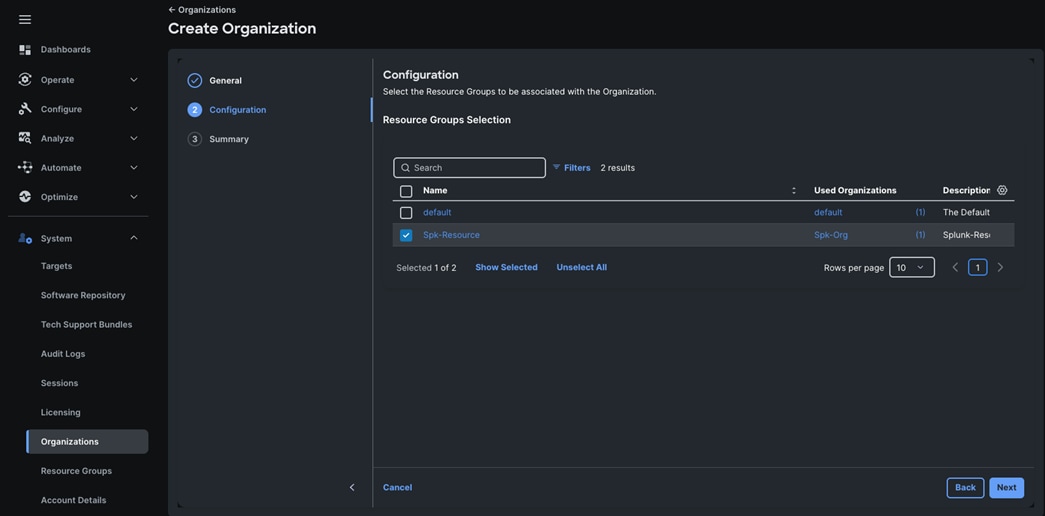
Step 7. In the configuration option, select the “Spk-Resource” configured earlier and click Next.
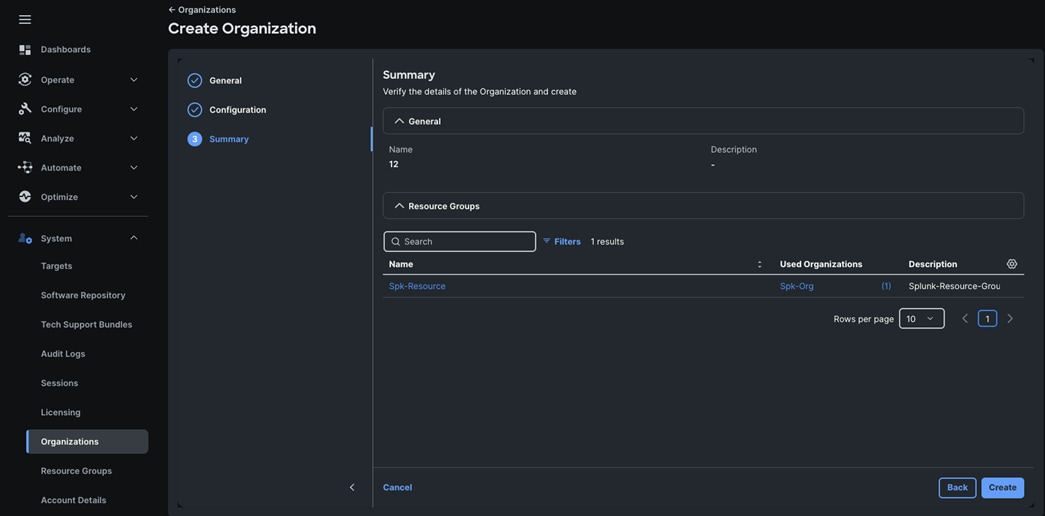
Step 8. Verify the summary page and then click Create to create organization with resource group for this deployment as shown below:
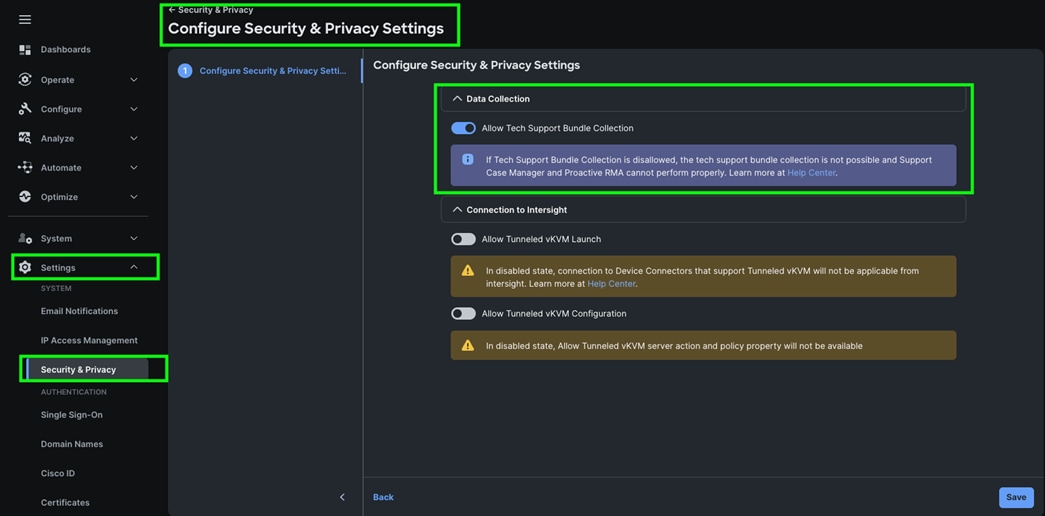
Step 9. To configure allowing tech support bundle collection, go to Settings > Security & Privacy > and enable the option and then click Save.
Note: For this solution we disabled Tunneled vKVM Launch and configuration.
Note: We configured the IP Pool, IMC Access Policy, and Power Policy for the Cisco UCS Chassis profile as explained below.
Step 1. Go to > Configure > Pools > and then select “Create Pool” on the top right corner.
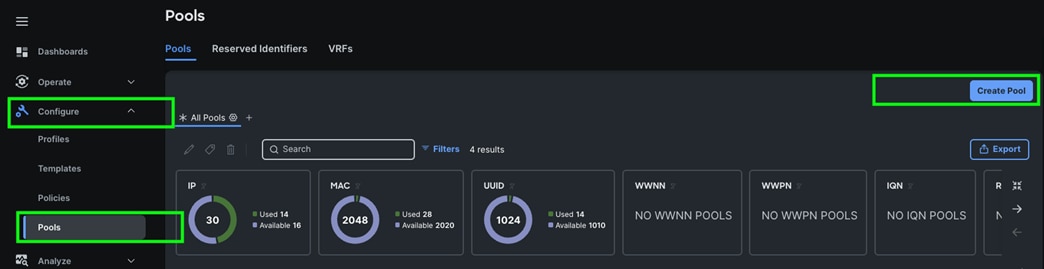
Step 2. Select option “IP” as shown below to create the IP Pool.
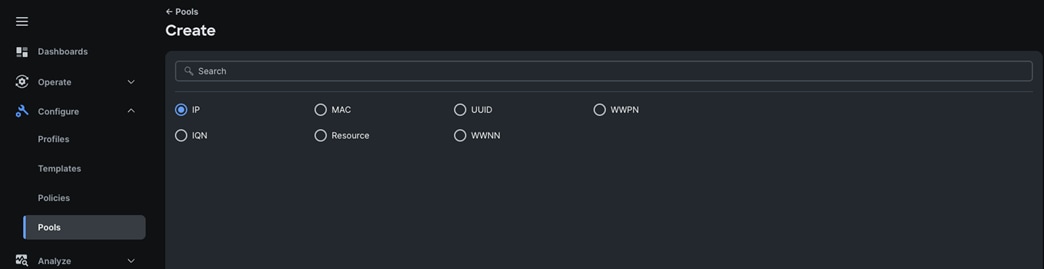
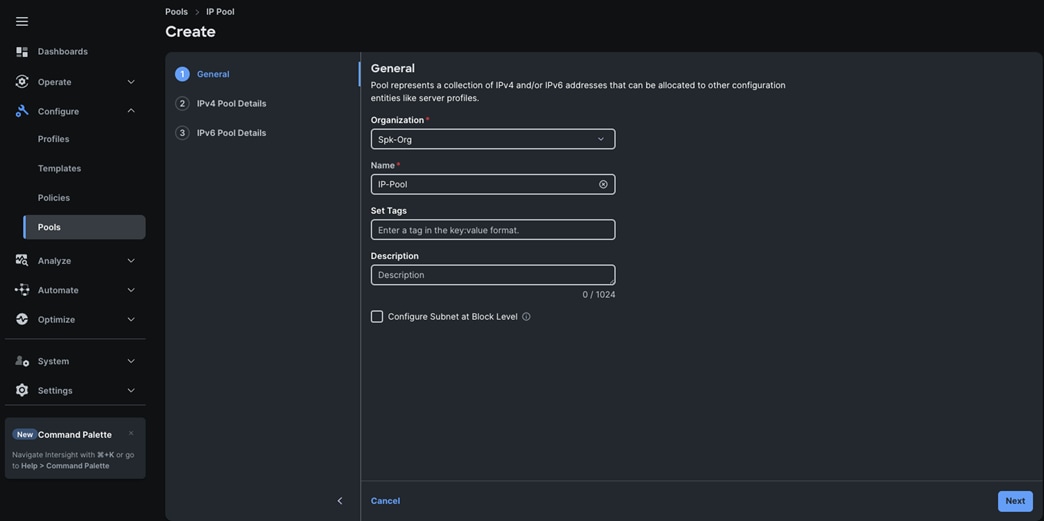
Step 3. In the IP Pool Create section, for Organization select “Spk-Org” and enter the Policy name “IP-Pool” and click Next.
Step 4. Enter Netmask, Gateway, Primary DNS, IP Blocks and Size according to your environment and click Next.
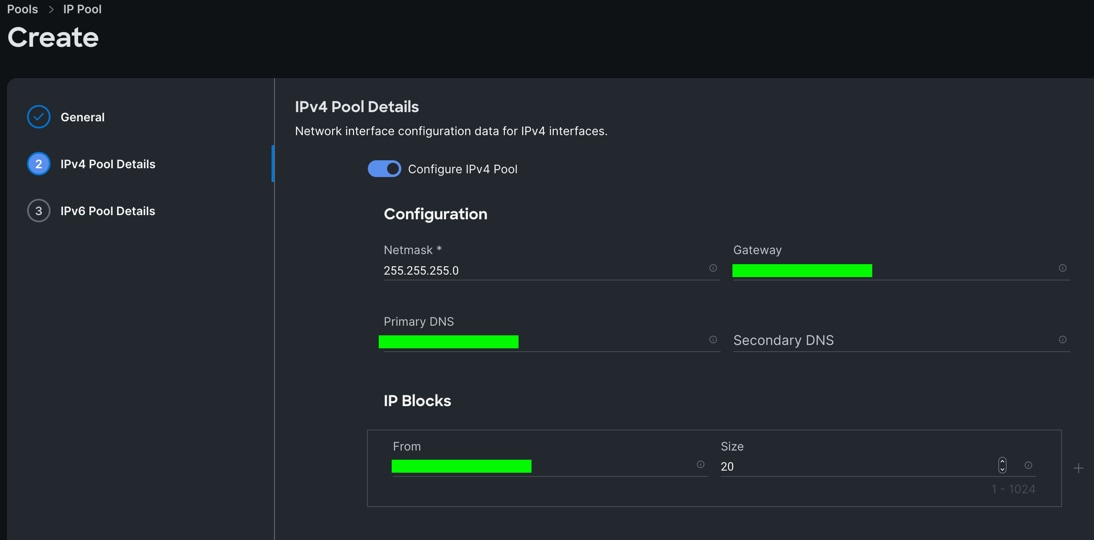
Note: For this solution, we did not configure the IPv6 Pool. Keep the Configure IPv6 Pool option disabled and click Create to create the IP Pool.
Procedure 5. Configure IMC Access Policy
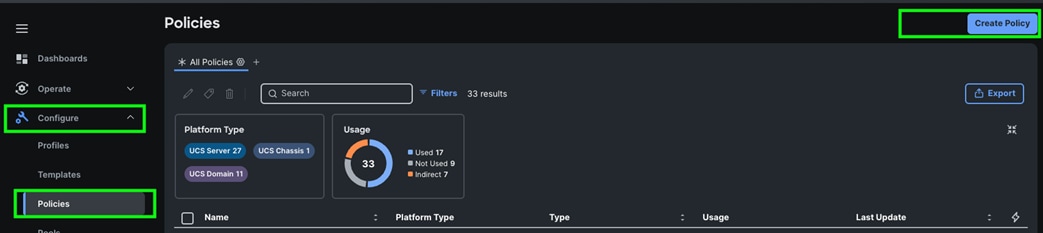
Step 1. Go to > Configure > Polices > and click Create Policy.
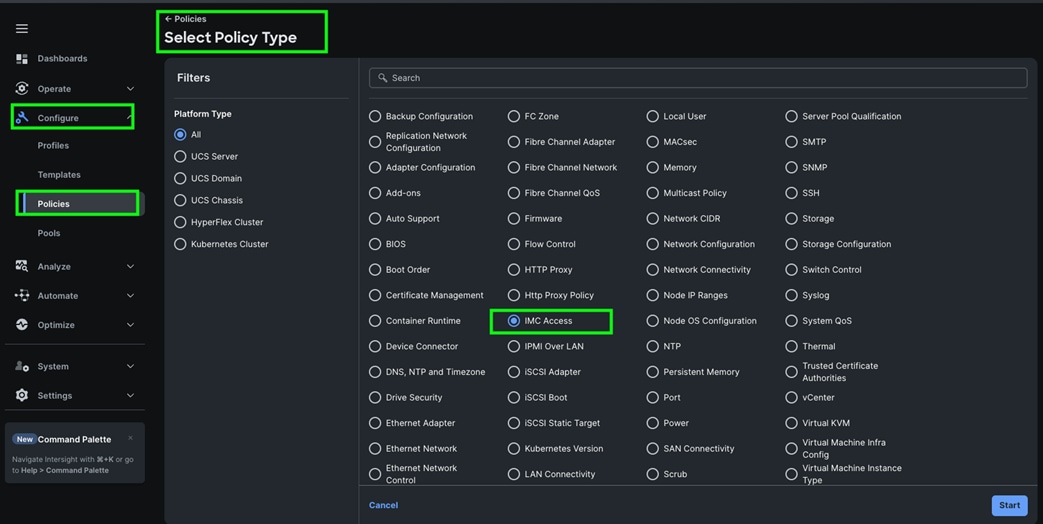
Step 2. Select the “IMC Access” policy from the list of policy.
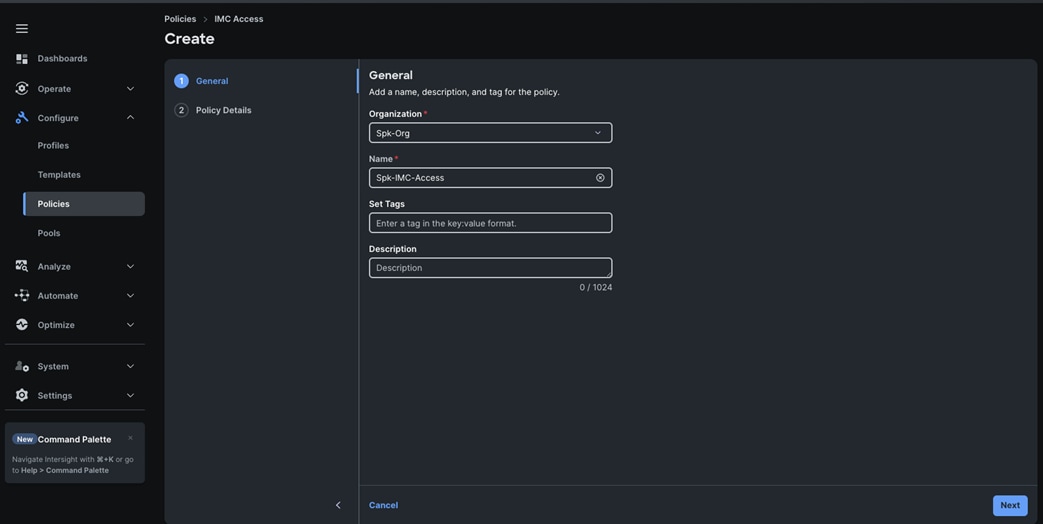
Step 3. In the IMC Access Create section, for Organization select “Spk-Org” and enter the Policy name “Spk-IMC-Access” and click Next.
Step 4. In the Policy Details section, enable In-Band Configuration, enter the VLAN ID as 1011 and select the IP Pool “IP-Pool” as shown below:
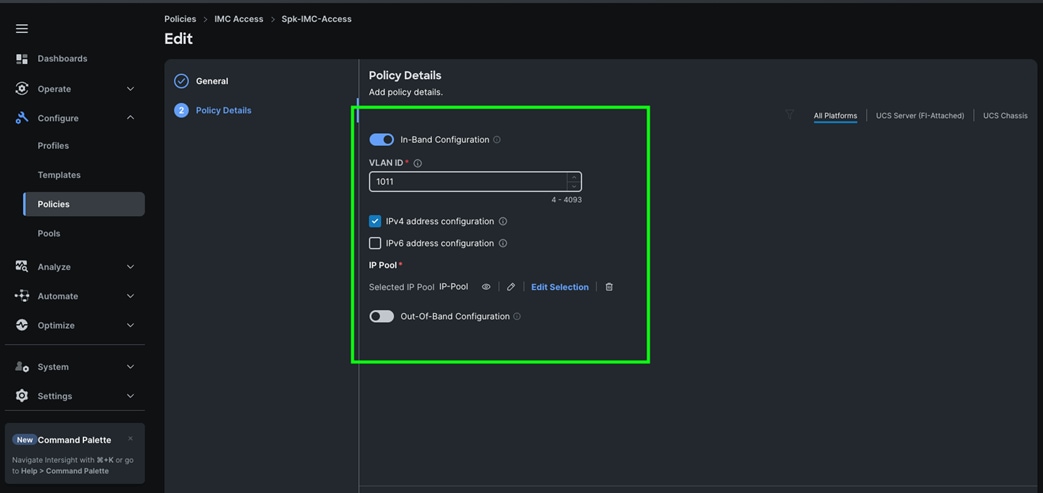
Step 5. Click Create to create this policy.
Configure Policies for Cisco UCS Domain
This section contains the following procedures:
Procedure 1. Configure Multicast Policy
Procedure 3. Configure Port Policy
Procedure 4. Configure NTP Policy
Procedure 5. Configure Network Connectivity Policy
Procedure 6. Configure System QoS Policy
Procedure 7. Configure Switch Control Policy
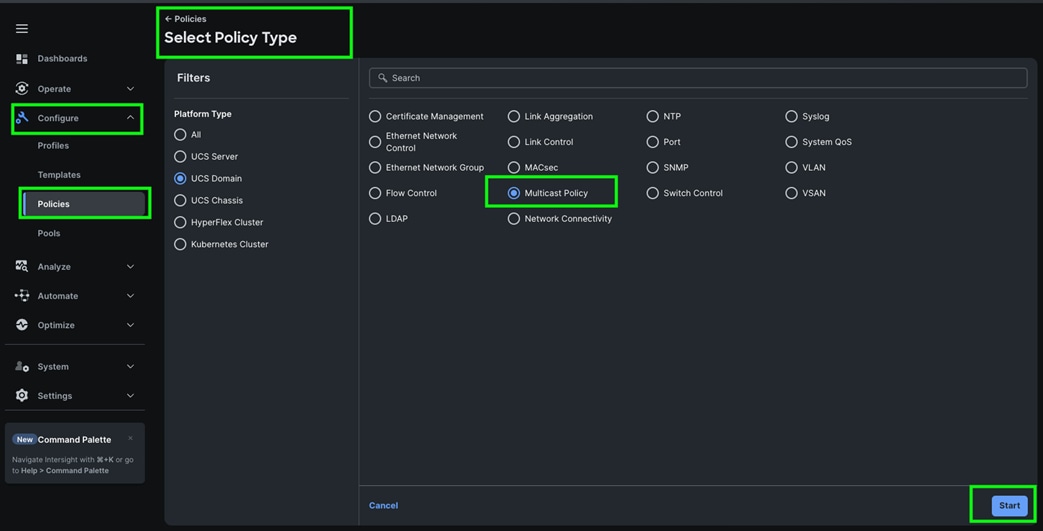
Procedure 1. Configure Multicast Policy
Step 1. To configure Multicast Policy for a Cisco UCS Domain profile, go to > Configure > Polices > and click Create Policy. For the platform type select “UCS Domain” and for Policy, select “Multicast Policy.”
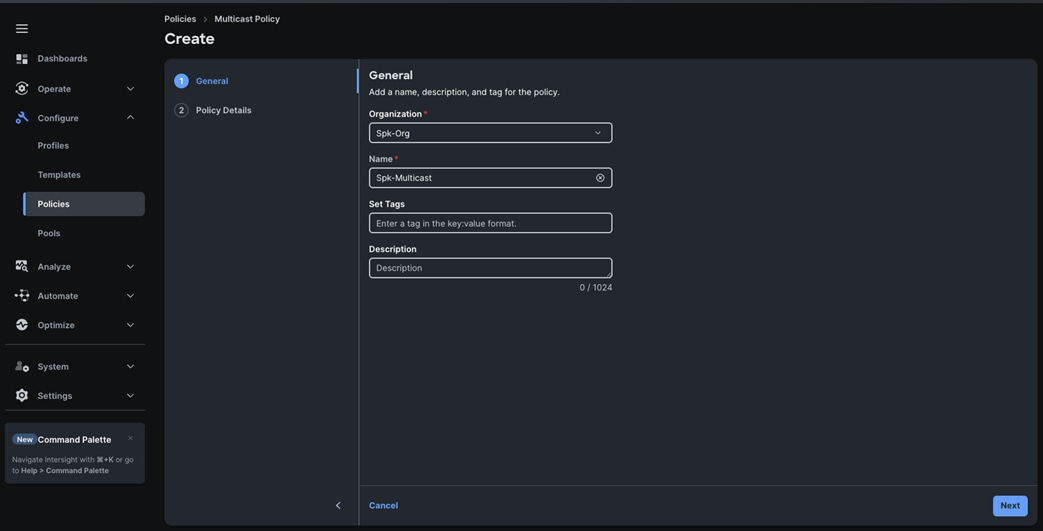
Step 2. In the Multicast Policy Create section, for the Organization select “Spk-Org” and for the Policy name “Spk-Multicast.” Click Next.
Step 3. In the Policy Details section, select Snooping State and Source IP Proxy State.
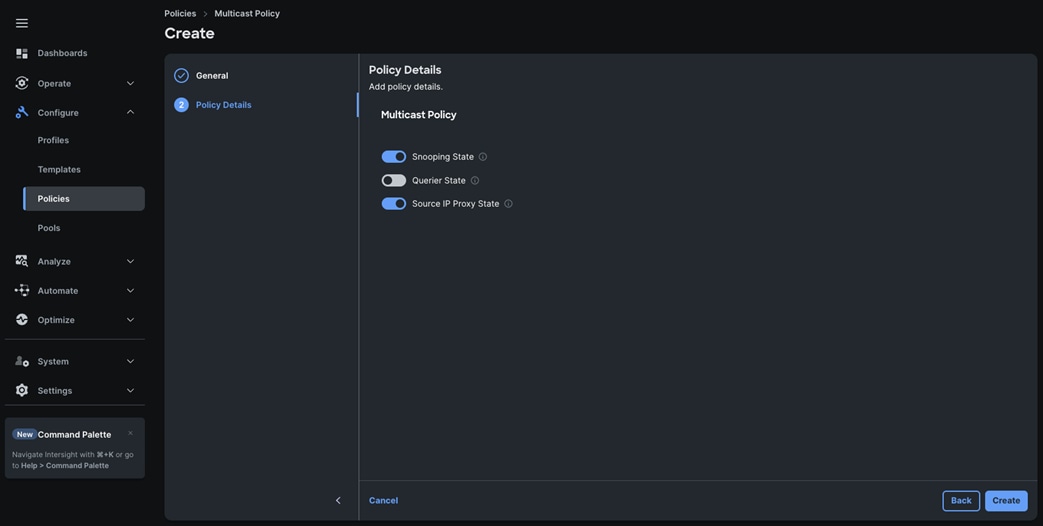
Step 4. Click Create to create this policy.
| VLAN Configuration |
||
| VLAN |
||
| Name |
ID |
Description |
| Default VLAN |
1 |
Native VLAN |
| Splunk-Mgmt |
1011 |
VLAN for Management and Data Ingestion Network Traffic |
| Splunk-Data |
3011 |
VLAN for Data Replication Network Traffic |
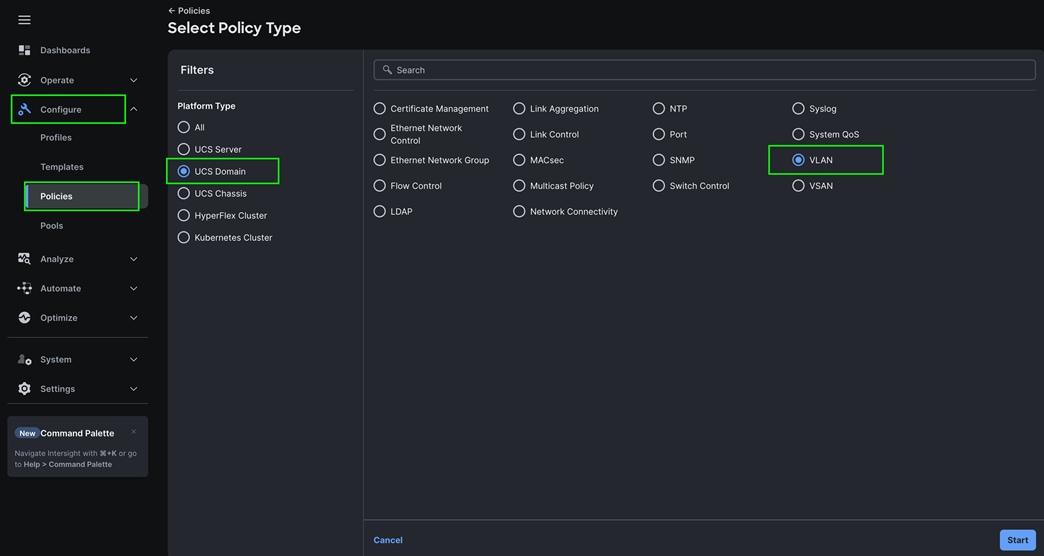
Step 1. To configure the VLAN Policy for the Cisco UCS Domain profile, go to > Configure > Polices > and click Create Policy. For the platform type select “UCS Domain” and for the Policy select “VLAN.”
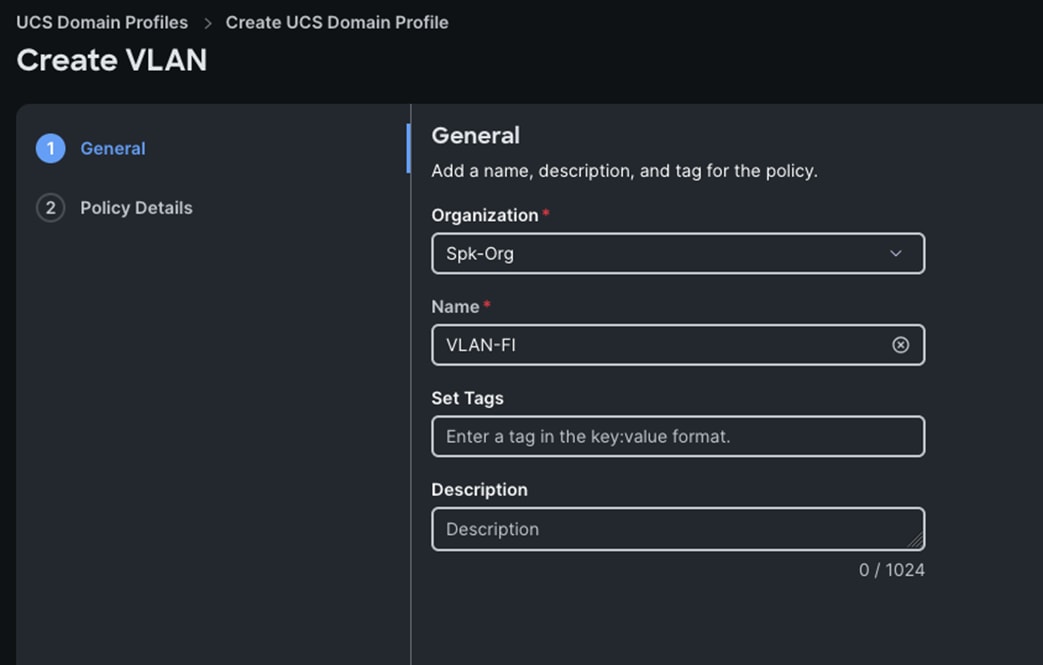
Step 2. In the VLAN Policy Create section, for the Organization select “Spk-Org” and for the Policy name select “VLAN-FI.” Click Next.
Step 3. In the Policy Details section, to configure the individual VLANs, select "Add VLANs."
Step 4. Provide a name, VLAN ID for the VLAN and select the Multicast Policy as shown below:
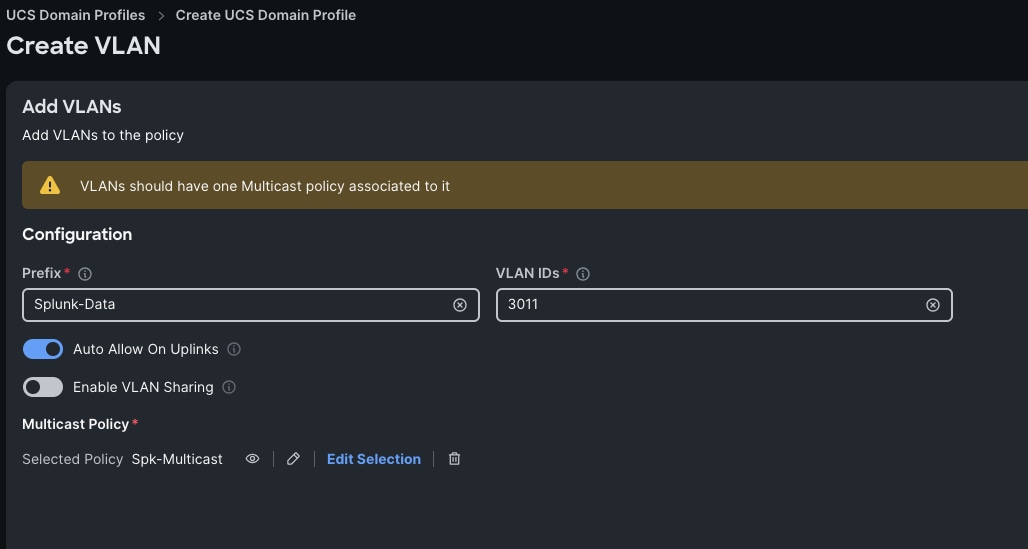
Step 5. Click Add to add this VLAN to the policy.
Step 6. Add another VLAN 1011 and provide the names as Splunk-Mgmt and select the same Multicast Policy as configured previously.
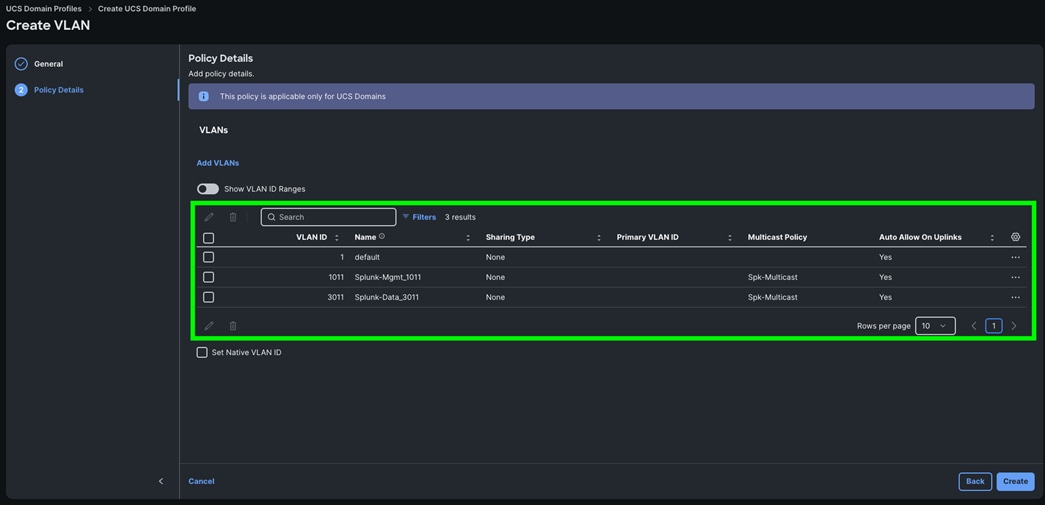
Step 7. Click Create to create this policy.
Procedure 3. Configure Port Policy
Step 1. Go to Configure > Polices > and click Create Policy.
Step 2. For the platform type select “UCS Domain” and for the policy, select “Port.”
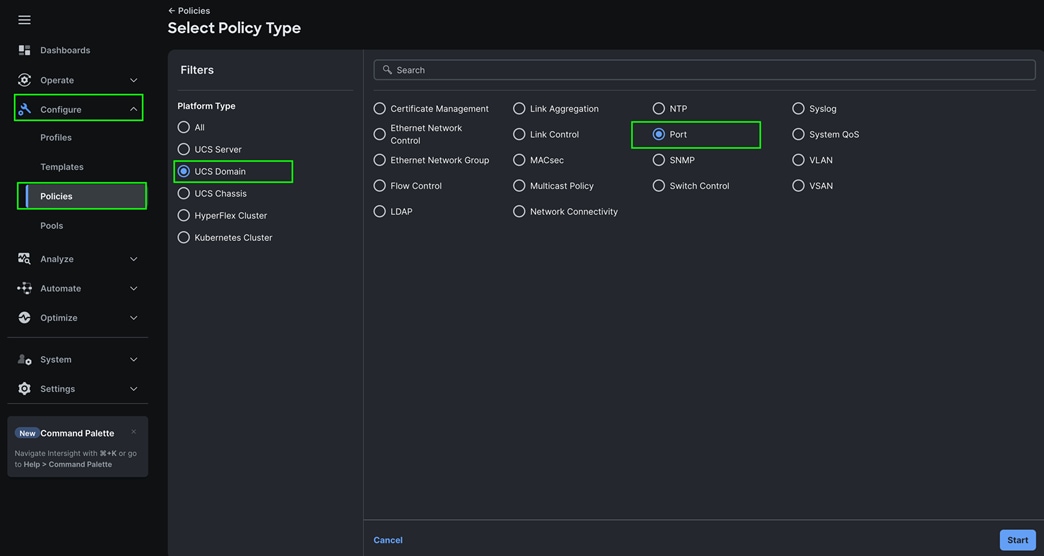
Step 3. In the Port Policy Create section, for the Organization, select “Spk-Org,” for the policy name select “FI-A-Port” and for the Switch Model select "UCS-FI-6536.” Click Next.
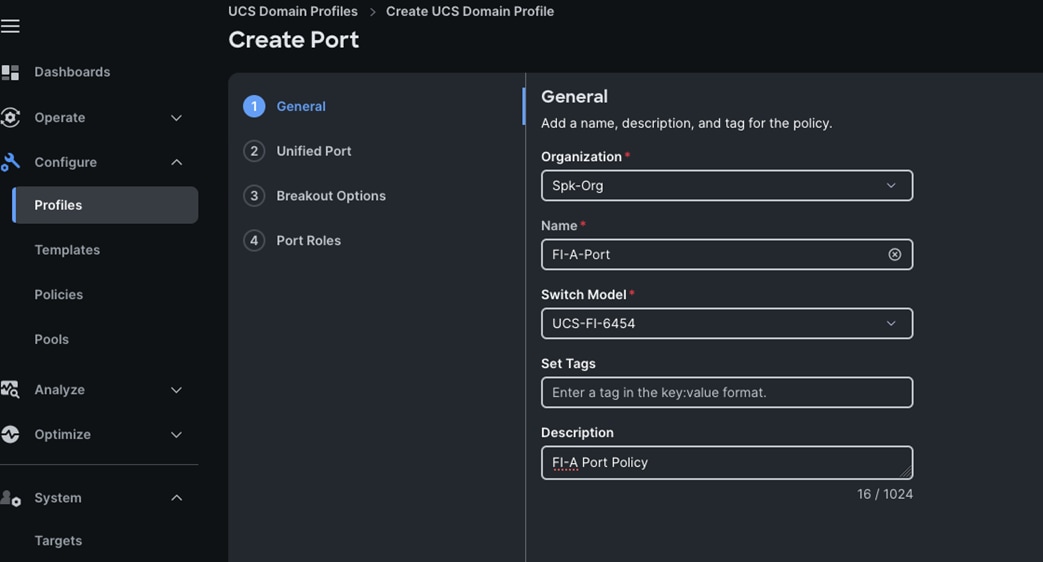
Note: We did not configure the Fibre Channel Ports for this solution. In the Unified Port section, leave it as default and click Next.
Note: We did not configure the Breakout options for this solution. Leave it as default and click Next.
Step 4. In the Port Role section, select port 1 to 14 and click Configure.
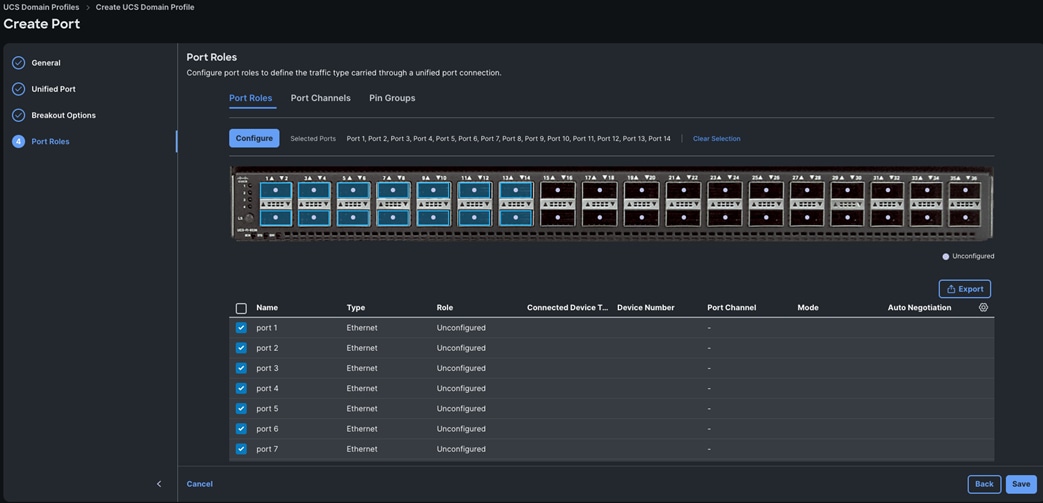
Step 5. In the Configure section, for Role select Server and keep the Auto Negotiation ON, Manual Server Numbering and Auto Fill Numbering as shown below:
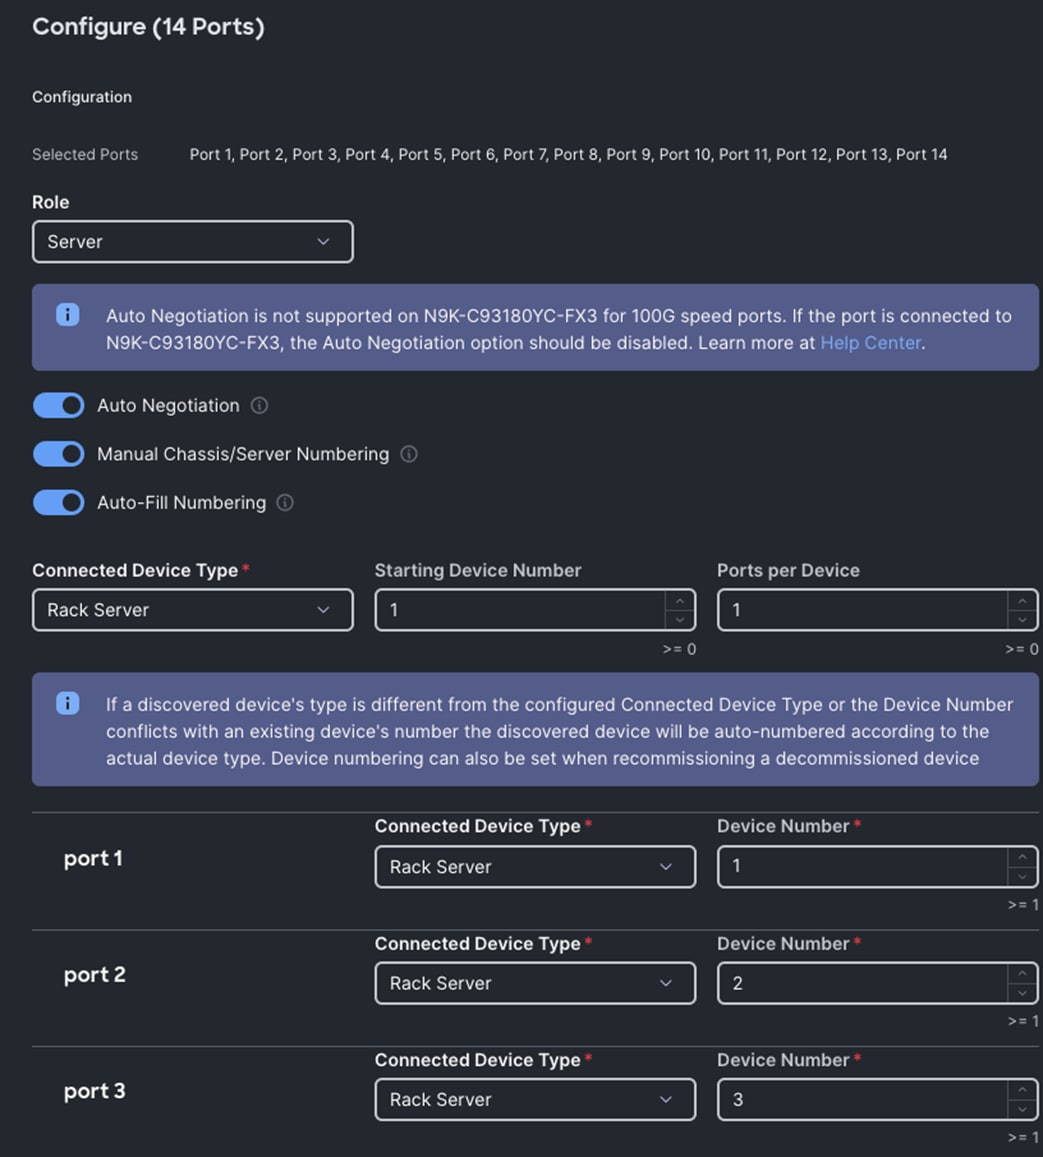
Step 6. Click SAVE to add this configuration for port roles.
Step 7. Go to the Port Channels tab and select Port 27 to 30 and click Create Port Channel between FI-A and both Cisco Nexus Switches.
Step 8. In the Create Port Channel section, for Role select Ethernet Uplinks Port Channel, and for the Port Channel ID select 51 and select Auto for the Admin Speed.
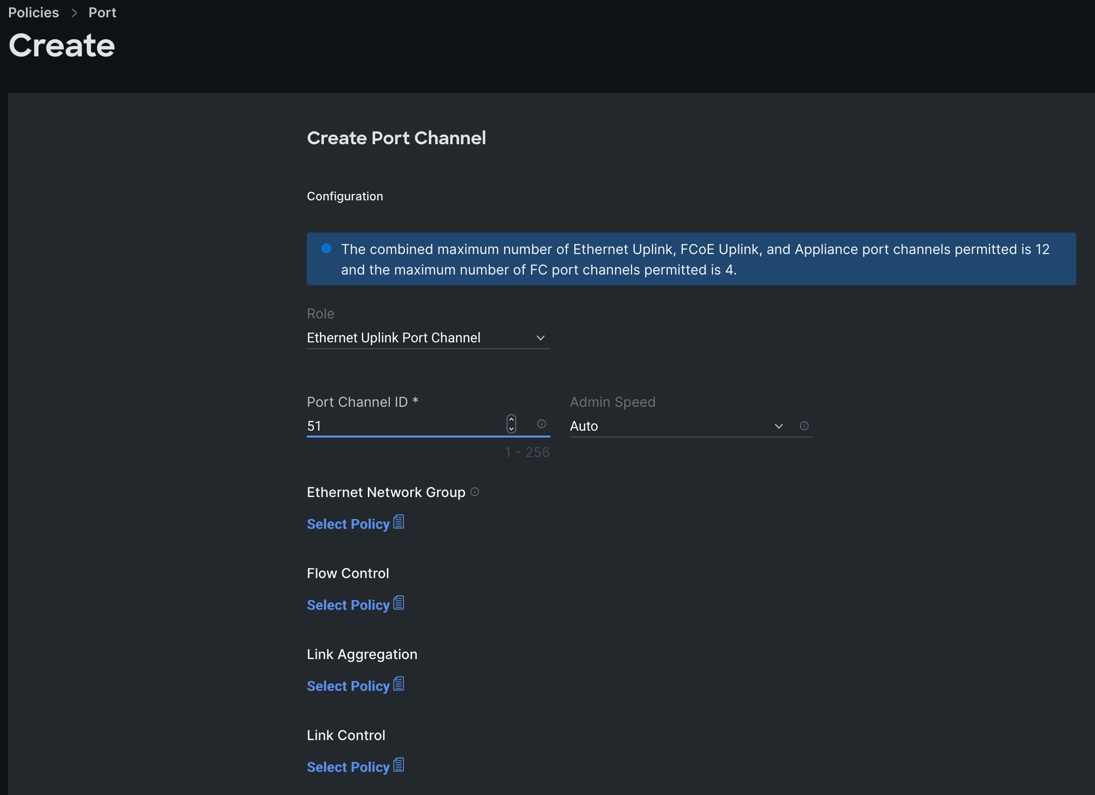
Step 9. Click SAVE to add this configuration for uplink port roles.
Step 10. Click SAVE to complete this configuration for all the server ports and uplink port roles.
Note: We configured the FI-B ports and created a Port Policy for FI-B, “FI-B-Port.”
Note: As configured for FI-A, we configured the port policy for FI-B. For FI-B, configured port 1 to 14 for server ports and ports 27 to 30 as the ethernet uplink port-channel ports.
For FI-B, we configured Port-Channel ID as 52 for Ethernet Uplink Port Channel as shown below:
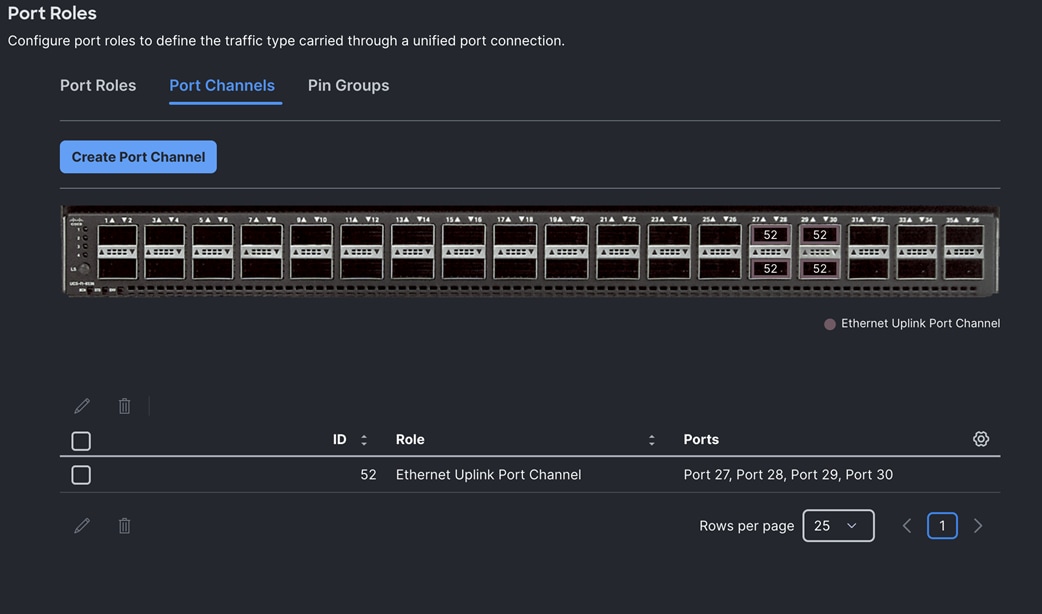
This completes the Port Policy for FI-A and FI-B for Cisco UCS Domain profile.
Procedure 4. Configure NTP Policy
Step 1. To configure the NTP Policy for the Cisco UCS Domain profile, go to > Configure > Polices > and click Create Policy. For the platform type select “UCS Domain” and for the policy select “NTP.”
Step 2. In the NTP Policy Create section, for the Organization select “Spk-Org” and for the policy name select “NTP-Policy.” Click Next.
Step 3. In the Policy Details section, select the option to enable the NTP Server and enter your NTP Server details as shown below:
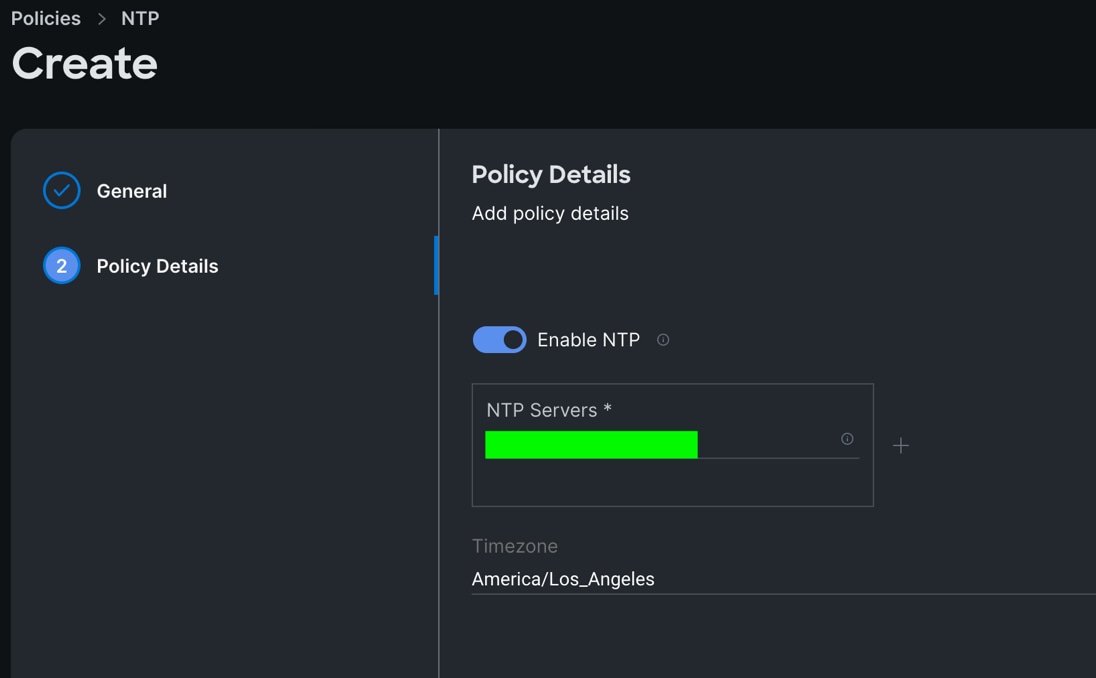
Step 4. Click Create.
Procedure 5. Configure Network Connectivity Policy
Step 1. To configure to Network Connectivity Policy for the Cisco UCS Domain profile, go to > Configure > Polices > and click Create Policy. For the platform type select “UCS Domain” and for the policy select “Network Connectivity.”
Step 2. In the Network Connectivity Policy Create section, for the Organization select “Spk-Org” and for the policy name select “Network-Connectivity-Policy.” Click Next.
Step 3. In the Policy Details section, enter the IPv4 DNS Server information according to your environment details as shown below:
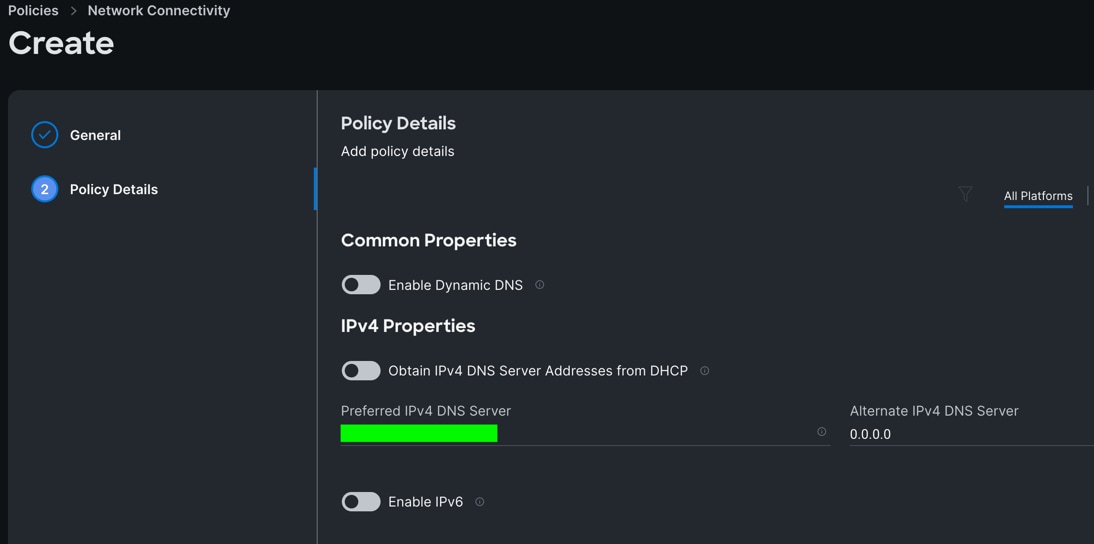
Step 4. Click Create.
Procedure 6. Configure System QoS Policy
Step 1. To configure the System QoS Policy for the Cisco UCS Domain profile, go to > Infrastructure Service > Configure > Polices > and click Create Policy. For the platform type select “UCS Domain” and for the policy select “System QoS.”
Step 2. In the System QoS Policy Create section, for the Organization select “Spk-Org” and for the policy name select “Spk-QoS.” Click Next.
Step 3. In the Policy Details section under Configure Priorities, select Best Effort and set the MTU size to 9216.
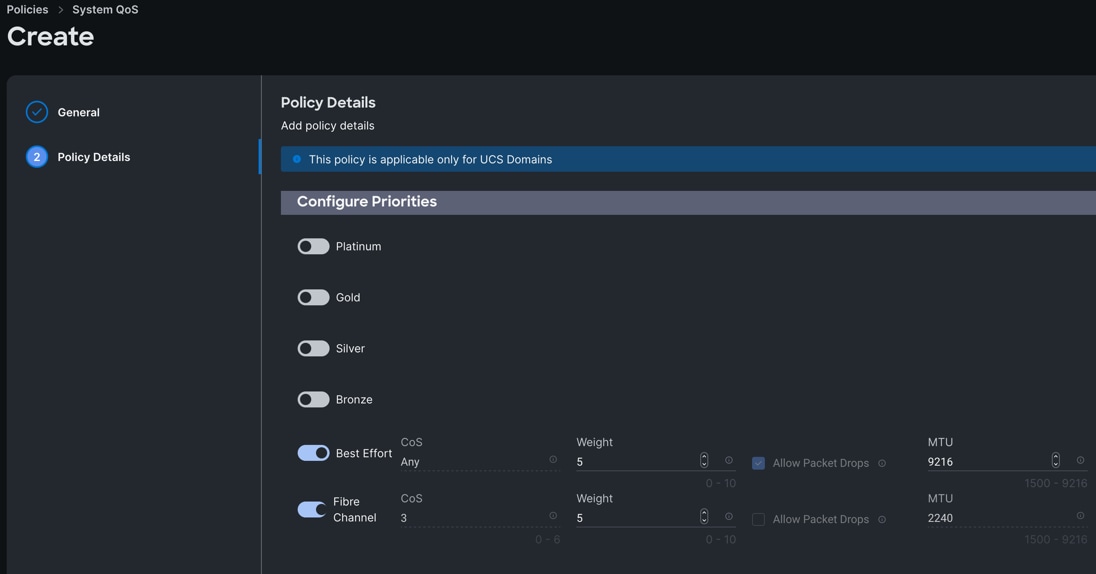
Step 4. Click Create.
Procedure 7. Configure Switch Control Policy
Step 1. To configure the Switch Control Policy for the UCS Domain profile, go to > Infrastructure Service > Configure > Polices > and click Create Policy. For the platform type select “UCS Domain” and for the policy select “Switch Control.”
Step 2. In the Switch Control Policy Create section, for the Organization select “Spk-Org” and for the policy name select “Spk-Switch-Control.” Click Next.
Step 3. In the Policy Details section, for the Switching Mode for Ethernet as well as FC, select and keep "End Host" Mode.
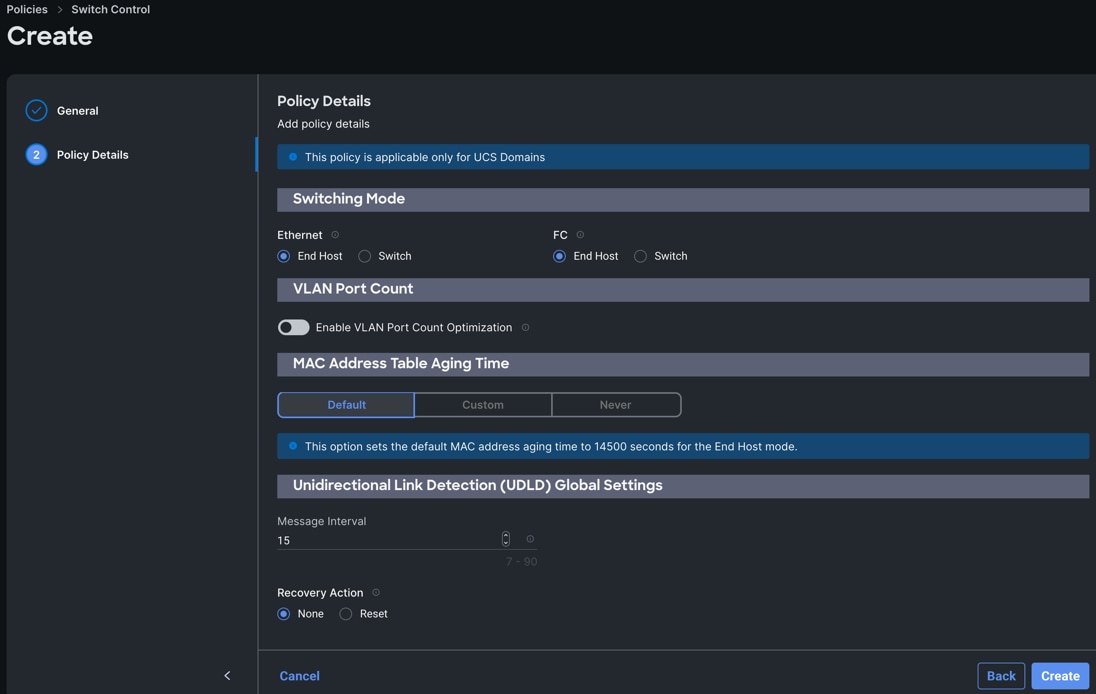
Step 4. Click Create to create this policy.
Configure Cisco UCS Domain Profile
This section contains the following procedures:
Procedure 1. Create a domain profile
With Cisco Intersight, a domain profile configures a fabric interconnect pair through reusable policies, allows for configuration of the ports and port channels, and configures the VLANs and VSANs in the network. It defines the characteristics of and configures ports on fabric interconnects. You can create a domain profile and associate it with a fabric interconnect domain. The domain-related policies can be attached to the profile either at the time of creation or later. One UCS Domain profile can be assigned to one fabric interconnect domain. For more information, go to: https://intersight.com/help/saas/features/fabric_interconnects/configure#domain_profile
Some of the characteristics of the Cisco UCS domain profile are:
● A single domain profile (Splunk-Domain) is created for the pair of Cisco UCS fabric interconnects.
● Unique port policies are defined for the two fabric interconnects.
● The VLAN configuration policy is common to the fabric interconnect pair because both fabric interconnects are configured for the same set of VLANs.
● The VSAN configuration policy is different to each of the fabric interconnects because both fabric interconnects are configured to carry separate storage traffic through separate VSANs.
● The Network Time Protocol (NTP), network connectivity, and system Quality-of-Service (QoS) policies are common to the fabric interconnect pair.
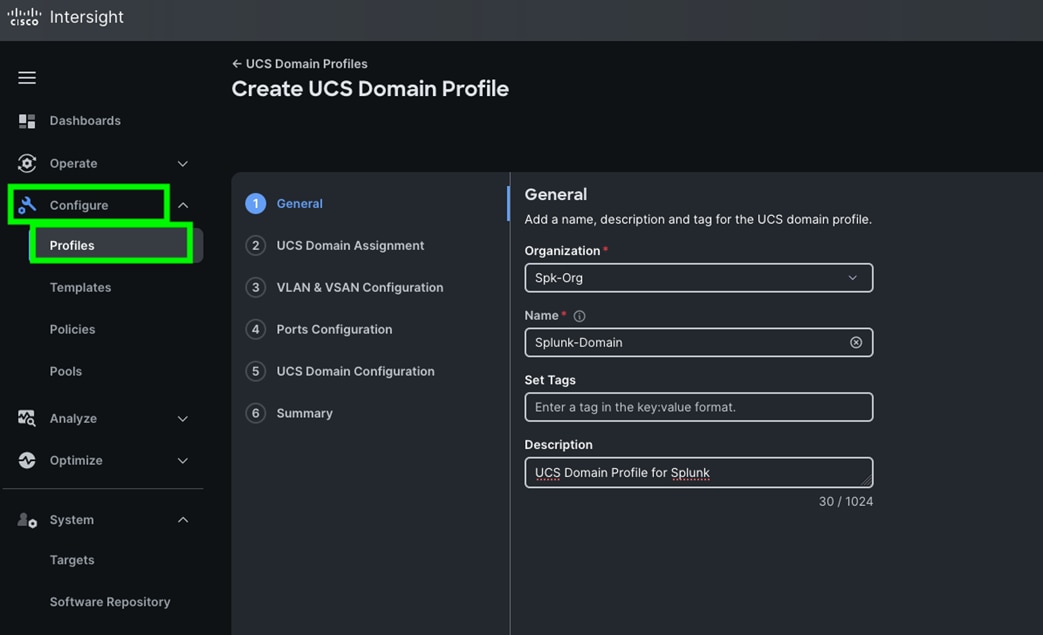
Procedure 1. Create a Domain Profile
Step 1. To create a domain profile, go to Configure > Profiles > then go to the UCS Domain Profiles tab and click Create UCS Domain Profile
Step 2. For the domain profile name, enter “Splunk-Domain” and for the Organization select what was previously configured. Click Next.
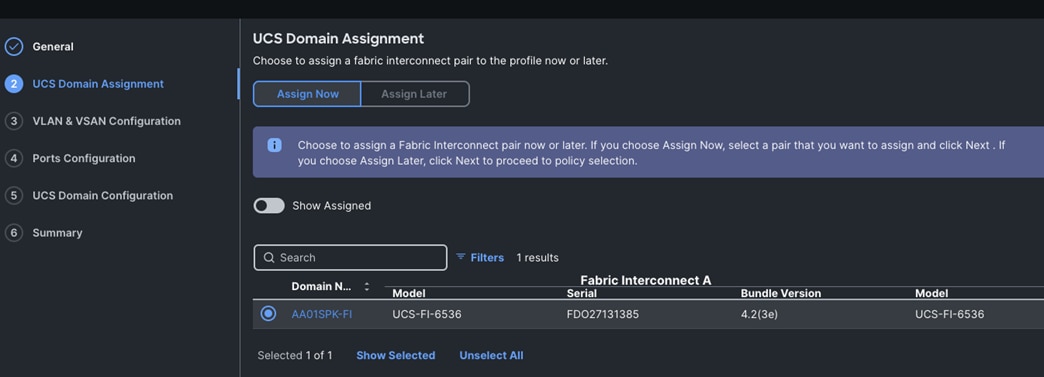
Step 3. In the UCS Domain Assignment menu, for the Domain Name select “Spk-OrgC-FI” which was added previously into this domain and click Next.
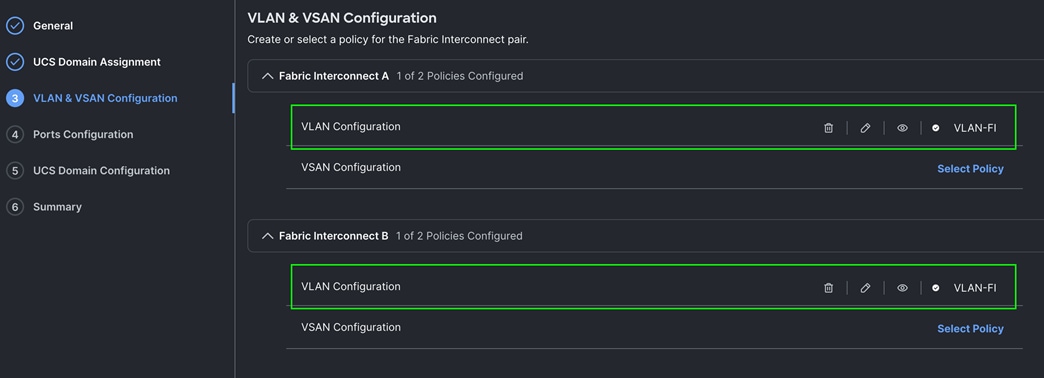
Step 4. In the VLAN Configuration screen, for the VLAN Configuration for both FIs, select VLAN-FI and click Next.
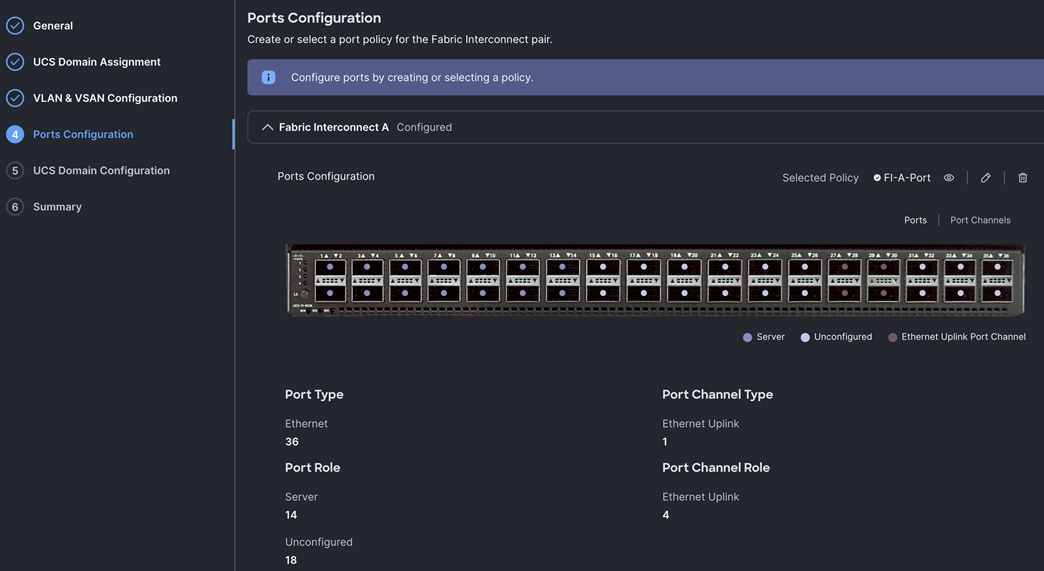
Step 5. In the Port Configuration section, for the Port Configuration Policy for FI-A select FI-A-Port.
Step 6. For the port configuration policy for FI-B select FI-B-Port.
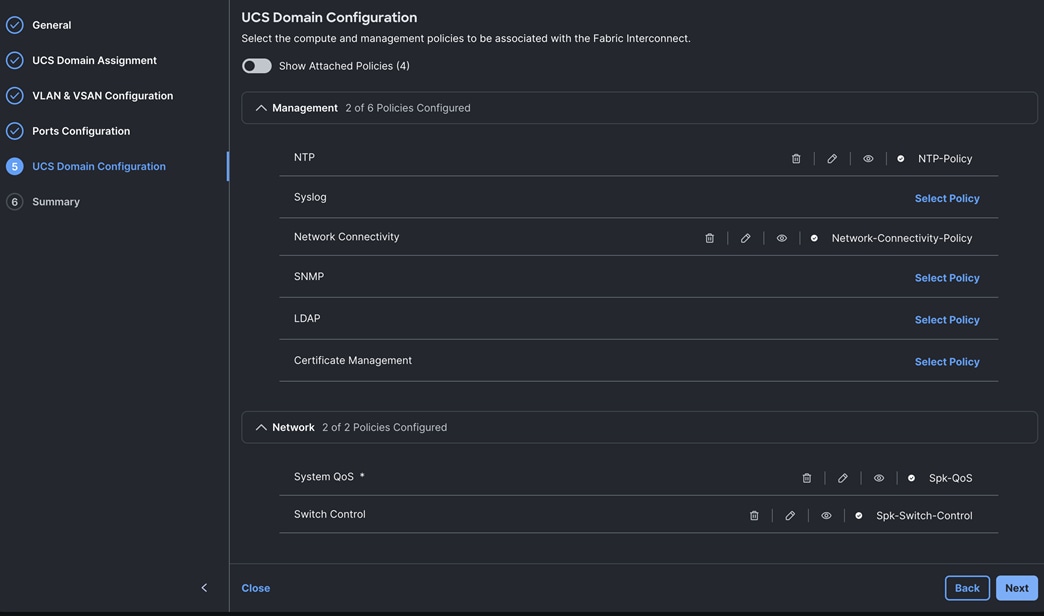
Step 7. In the UCS Domain Configuration section, select the policy for NTP, Network Connectivity, System QoS and Switch Control as shown below:
Step 8. In the Summary window, review the policies and click Deploy to create Domain Profile.
Note: After the Cisco UCS domain profile has been successfully created and deployed, the policies including the port policies are pushed to the Cisco UCS fabric interconnects. The Cisco UCS domain profile can easily be cloned to install additional Cisco UCS systems. When cloning the Cisco UCS domain profile, the new Cisco UCS domains utilize the existing policies for the consistent deployment of additional Cisco UCS systems at scale.
Step 9. The Cisco UCS C225 and C245 M8 Compute Nodes are automatically discovered when the ports are successfully configured using the domain profile as shown below. You can check the status of this discovery by clicking Request next to the Refresh page option.
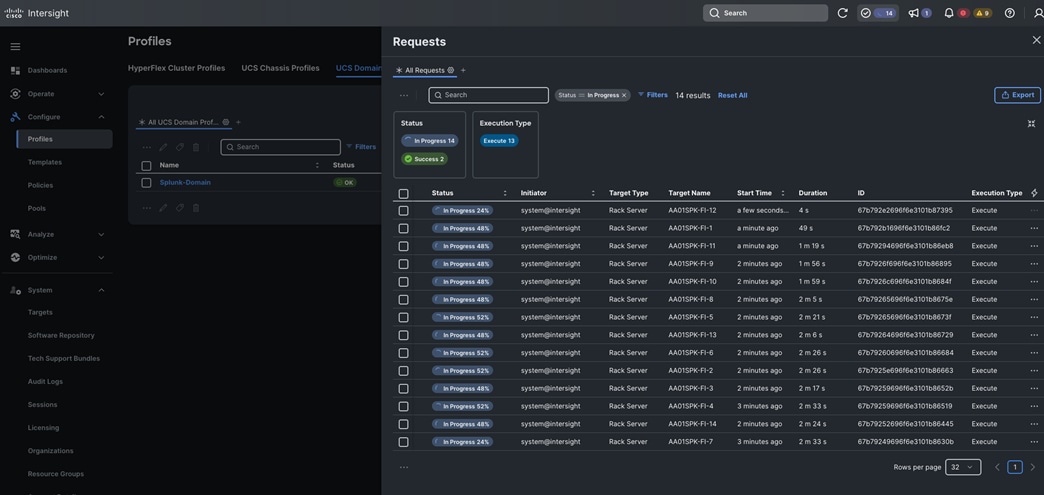
After discovering the servers successfully, you will find all the servers as shown below.
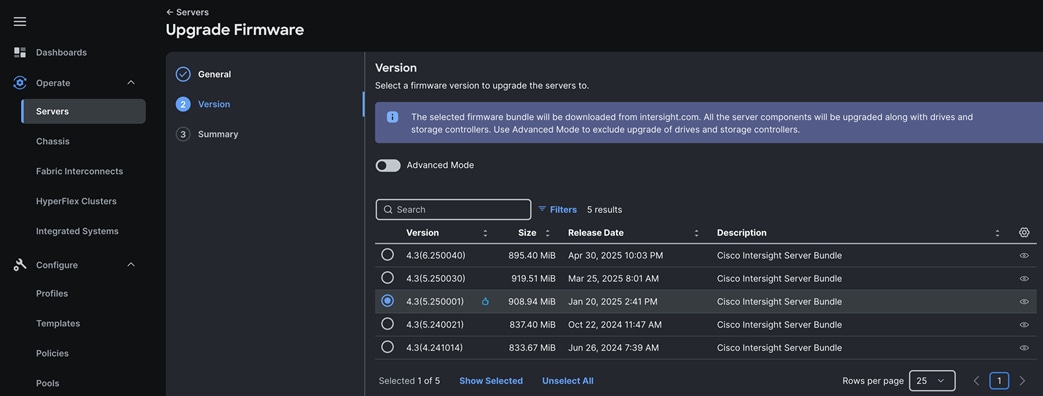
Step 10. After discovering the servers successfully, upgrade all server firmware through IMM to the supported release. To do this, check the box for All Servers and then click the ellipses and from the drop-down list, select Upgrade Firmware.
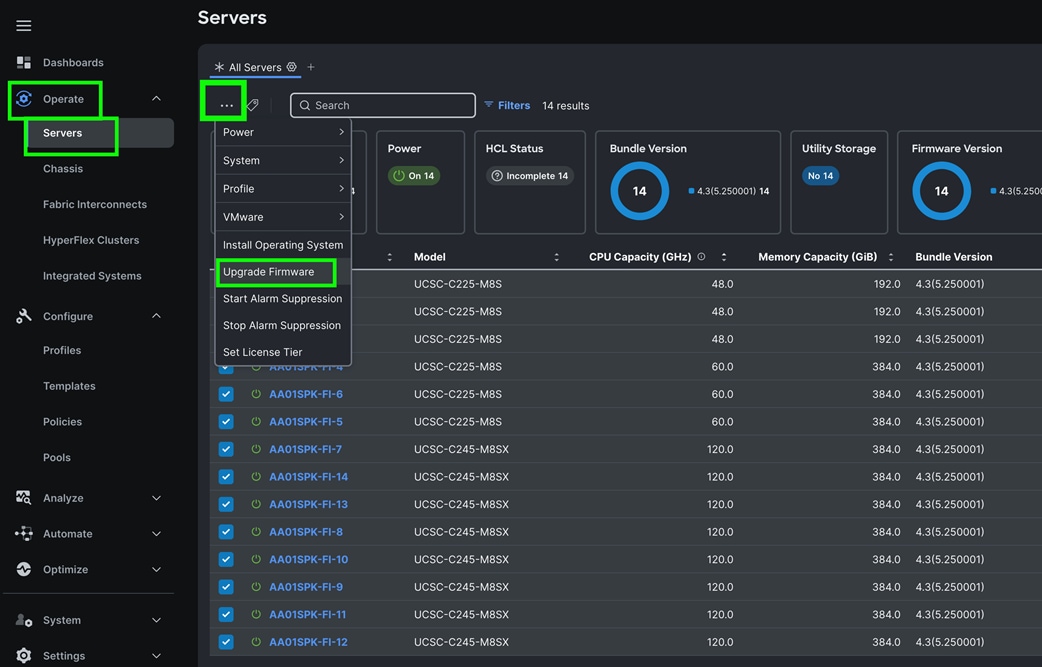
Step 11. In the Upgrade Firmware section, select all servers and click Next. In the Version section, for the supported firmware version release select “4.3 (5.250001)” and click Next, then click Upgrade to upgrade the firmware on all servers simultaneously.
Step 12. After the successful firmware upgrade, you can create a server profile template and a server profile for IMM configuration.
Configure Policies for Server Profile
This section contains the following procedures:
Procedure 1. Configure UUID Pool
Procedure 2. Configure BIOS Policy
Procedure 4. Configure Ethernet Network Control Policy
Procedure 5. Configure Ethernet Network Group Policy
Procedure 6. Configure Ethernet Adapter Policy
Procedure 7. Create Ethernet QoS Policy
Procedure 8. Configure LAN Connectivity Policy
Procedure 9. Configure Boot Order Policy
Procedure 10. Configure Storage Policy
Procedure 11. Configure Server Profiles
Procedure 12. Assign and Deploy Server Profiles
A server profile enables resource management by simplifying policy alignment and server configuration. The server profile wizard groups the server policies into the following categories to provide a quick summary view of the policies that are attached to a profile:
● Compute Configuration: BIOS, Boot Order, and Virtual Media policies.
● Management Configuration: Certificate Management, IMC Access, IPMI (Intelligent Platform Management Interface) Over LAN, Local User, Serial Over LAN, SNMP (Simple Network Management Protocol), Syslog and Virtual KVM (Keyboard, Video, and Mouse).
● Storage Configuration: SD Card, Storage.
● Network Configuration: LAN connectivity and SAN connectivity policies.
Some of the characteristics of the server profile template for this solution are as follows:
● BIOS policy is created to specify various server parameters in accordance with AMD CPU’s best practices.
● Boot order policy defines virtual media (KVM mapper DVD) and local boot through M.2 SSD.
● IMC access policy defines the management IP address pool for KVM access.
● LAN connectivity policy is used to create two virtual network interface cards (vNICs) – One vNIC for Server Node Management and Splunk Data Ingestion Network Traffic, second vNIC for Splunk Indexing Server-to-Server Network Traffic Interface.
Procedure 1. Configure UUID Pool
Step 1. To create UUID Pool for a Cisco UCS, go to > Configure > Pools > and click Create Pool. Select option UUID.
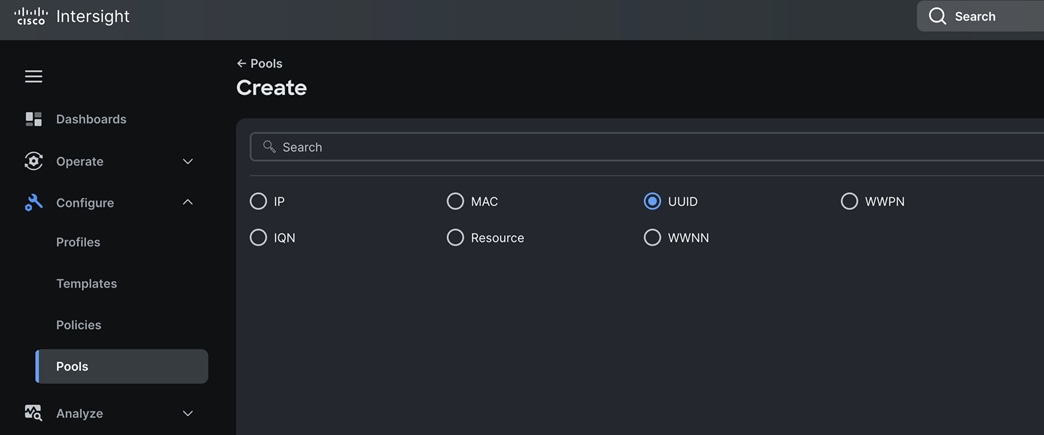
Step 2. In the UUID Pool Create section, for the Organization, select “Spk-Org” and for the Policy name Spk-UUID. Click Next.
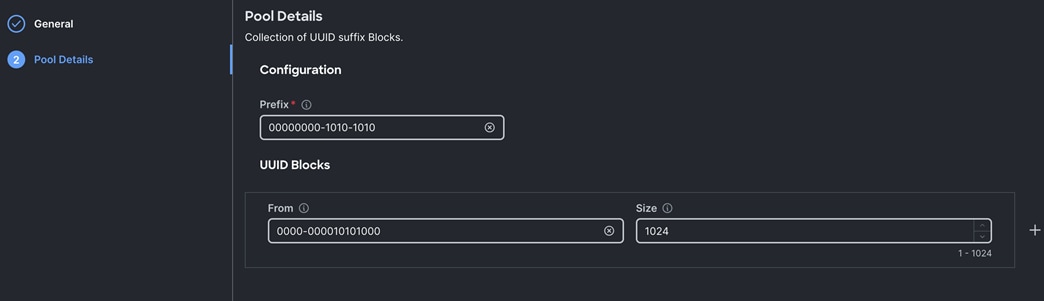
Step 3. Select Prefix, UUID block and size according to your environment and click Create as shown below:
Procedure 2. Configure BIOS Policy
Note: For more information, see Performance Tuning for Cisco UCS M8 Platforms with AMD EPYC 4th Gen and 5th Gen Processors here: https://www.cisco.com/c/en/us/products/collateral/servers-unified-computing/ucs-c-series-rack-servers/ucs-c245-m8-rack-ser-4th-gen-amd-epyc-pro-wp.html
Note: For this specific solution, we created a single BIOS policy (for both single socket C225 and two socket C245 M8 Server node) and used the setting as mentioned in Table 7.
Table 7. BIOS recommendations for Splunk Analytical Enterprise Workloads
| BIOS options |
BIOS values (platform default) |
Big Data analytics (Splunk Analytical Workload) |
| Processor |
||
| SMT mode |
Enabled |
Disabled |
| SVM mode |
Auto (Enabled) |
Auto |
| DF C-states |
Auto (Enabled) |
Auto |
| ACPI SRAT L3 Cache as NUMA Domain |
Auto (Disabled) |
Auto |
| APBDIS |
Auto (0) |
1 |
| Fixed SOC P-State SP5F 19h |
Auto (P0) |
Auto |
| 4-link xGMI max speed* |
Auto (32Gbps) |
Auto |
| Enhanced CPU performance* |
Disabled |
Disabled |
| Memory |
||
| NUMA nodes per socket |
Auto (NPS1) |
Auto |
| IOMMU |
Auto (Enabled) |
Auto |
| Memory interleaving |
Auto (Enabled) |
Auto |
| Power/Performance |
||
| Core performance boost |
Auto (Enabled) |
Auto |
| Global C-State control |
Auto (Enabled) |
Auto |
| L1 Stream HW Prefetcher |
Auto (Enabled) |
Auto |
| L2 Stream HW Prefetcher |
Auto (Enabled) |
Auto |
| Processor |
||
| Determinism slider |
Auto (Power) |
Auto |
| CPPC |
Auto (Disabled) |
Enabled |
| Power profile selection F19h |
High-performance mode |
High-performance mode |
Note: BIOS tokens with *highlighted are not applicable only for single socket optimized platform like Cisco UCS C225 M8 1U Rack Server.
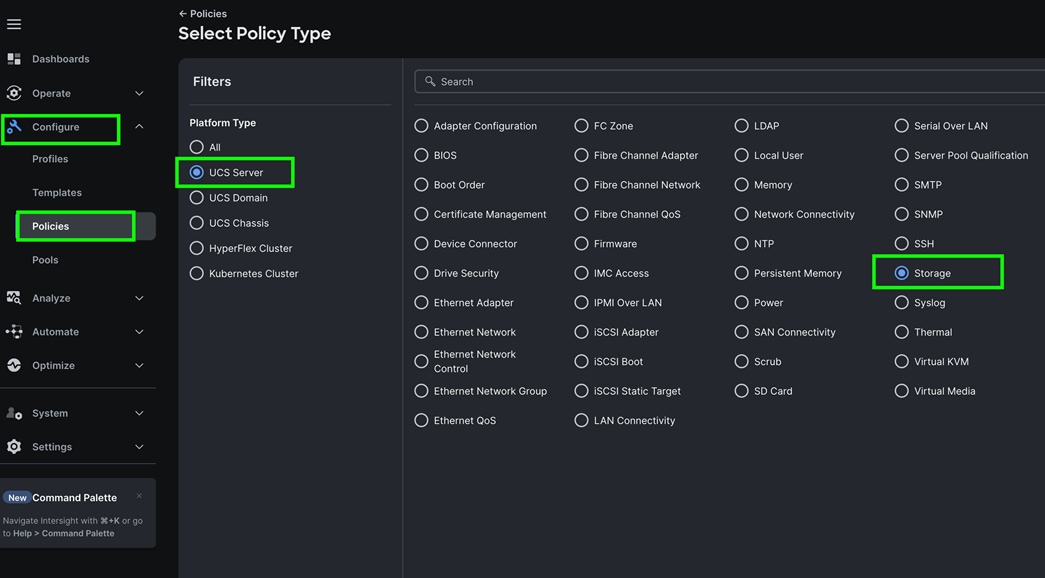
Step 1. To create BIOS Policy, go to > Configure > Policies > and select Platform type as UCS Server and select on BIOS and click Start.
Step 2. In the BIOS create general menu, for the Organization, select Spk-Org and for the Policy name Spk-BIOS-Policy. Click Next.
Step 3. Apply the mentioned parameters from the above table to configure the BIOS for C225 and C245 M8 Server running as Big-Data Analytical workloads.
Step 4. Click Create to create the BIOS policy.
Step 1. To configure a MAC Pool for a Cisco UCS Domain profile, go to > Configure > Pools > and click Create Pool. Select option MAC to create MAC Pool.
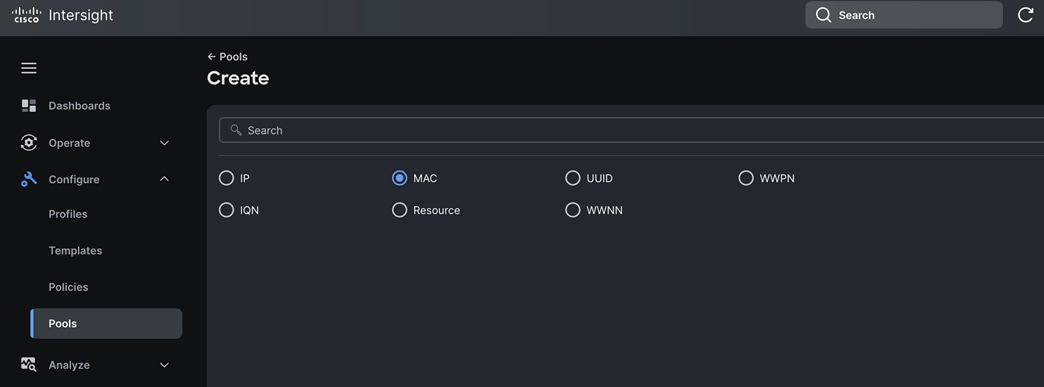
Step 2. In the MAC Pool Create section, for the Organization, select Spk-Org and for the Policy name Spk-MAC-Pool-A. Click Next.
Step 3. Enter the MAC Blocks from and Size of the pool according to your environment and click Create.
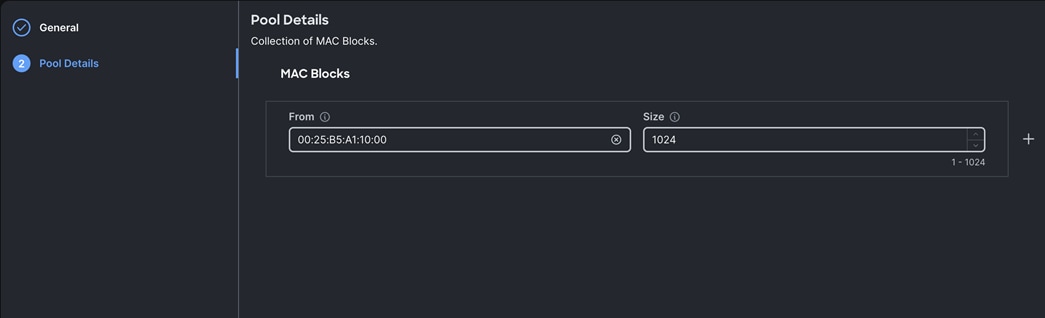
Note: For this solution, we configured two MAC Pools. Spk-MAC-Pool-A for vNICs MAC Address VLAN 1011 on all servers through FI-A Side. Spk-MAC-Pool-B for vNICs MAC Address VLAN 3011 on all servers through FI-B Side
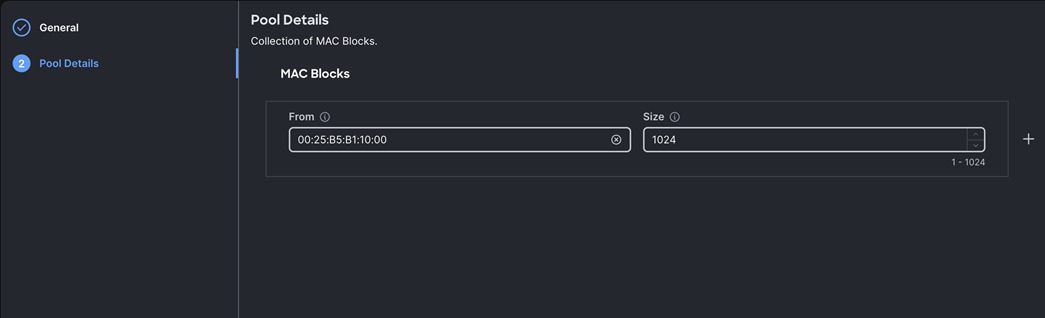
Step 4. Create a second MAC Pool to provide MAC addresses to all vNICs running on VLAN 3011.
Step 5. Go to > Configure > Pools > and click Create Pool. Select option MAC to create MAC Pool.
Step 6. In the MAC Pool Create section, for the Organization, select Spk-Org and for the Policy name “Spk-MAC-Pool-B.” Click Next.
Step 7. Enter the MAC Blocks from and Size of the pool according to your environment and click Create.
Procedure 4. Configure Ethernet Network Control Policy
Step 1. To configure the Ethernet Network Control Policy for the UCS server profile, go to > Configure > Polices > and click Create Policy.
Step 2. For the platform type select UCS Server and for the policy select Ethernet Network Control.
Step 3. In the Switch Control Policy Create section, for the Organization select Spk-Org and for the policy name enter “Eth-Network-Control.” Click Next.
Step 4. In the Policy Details section, keep the parameter as shown below:
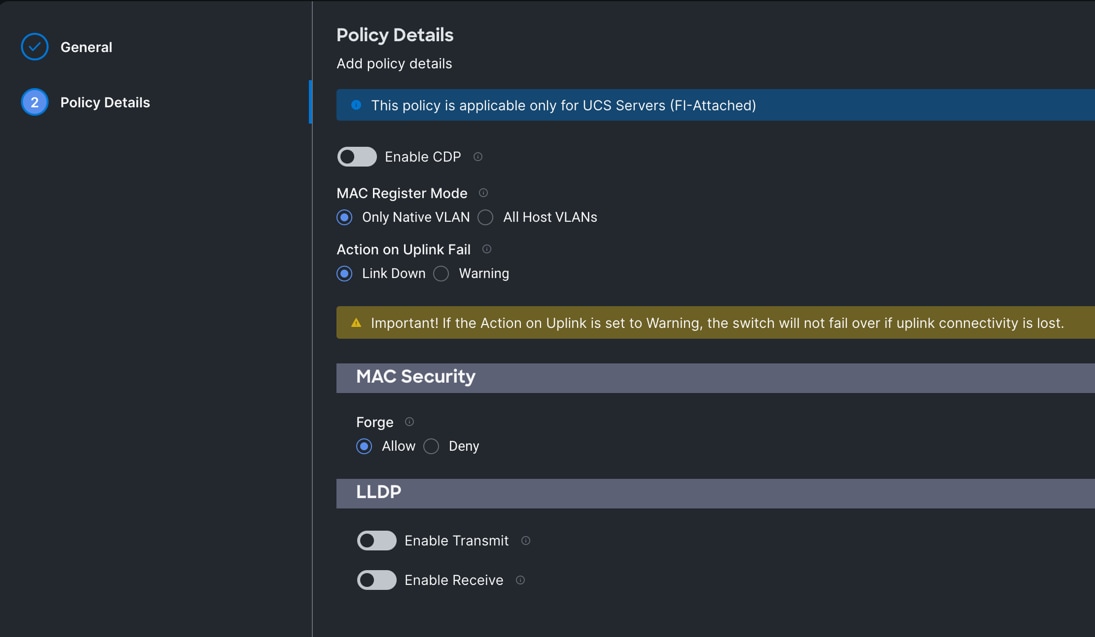
Step 5. Click Create to create this policy.
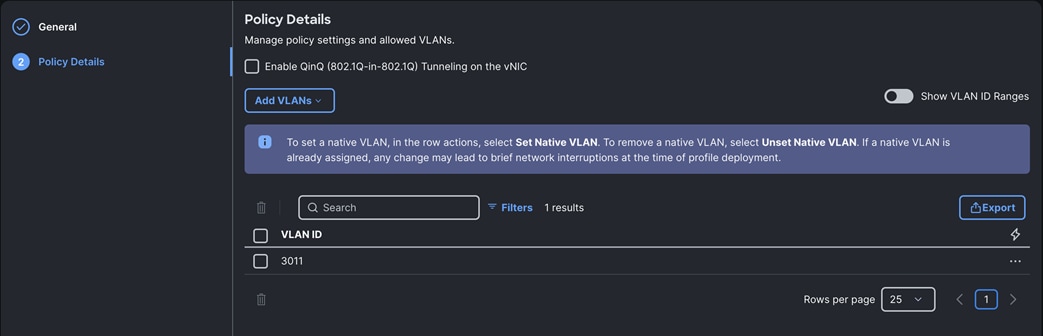
Procedure 5. Configure Ethernet Network Group Policy
Note: We configured two Ethernet Network Groups to allow two different VLAN traffic for this solution (one for VLAN 1011 and the other for VLAN 3011).
Step 1. To configure the Ethernet Network Group Policy for the UCS server profile, go to > Configure > Polices > and click Create Policy.
Step 2. For the platform type select UCS Server and for the policy select Ethernet Network Group.
Step 3. In the Switch Control Policy Create section, for the Organization select Spk-Org and for the policy name enter “Eth-Network-1011.” Click Next.
Step 4. In the Policy Details section, click Add VLANs and enter VLANs 1011 manually.
Step 5. For this VLAN, set the native VLAN as shown below:

Step 6. Click Create to create this policy for VLAN 1011.
Step 7. Create another “Eth-Network-3011” and add VLAN 3011.
Note: For this solution, we used these two Ethernet Network Group policies and applied them on different vNICs to carry individual both the VLAN traffic.
Procedure 6. Configure Ethernet Adapter Policy
Step 1. To configure the Ethernet Adapter Policy for the UCS Server profile, go to > Configure > Polices > and click Create Policy.
Step 2. For the platform type select UCS Server and for the policy select Ethernet Adapter.
Step 3. In the Ethernet Adapter Configuration section, for the Organization select Spk-Org and for the policy name enter Eth-Adapter.
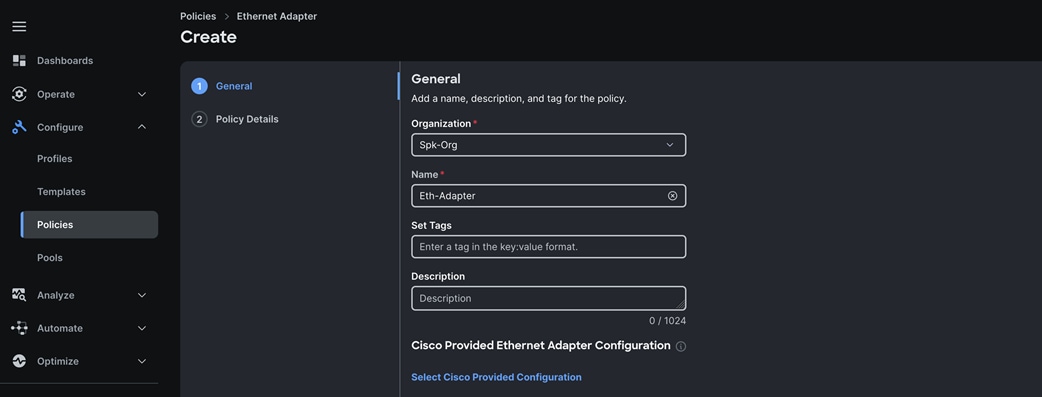
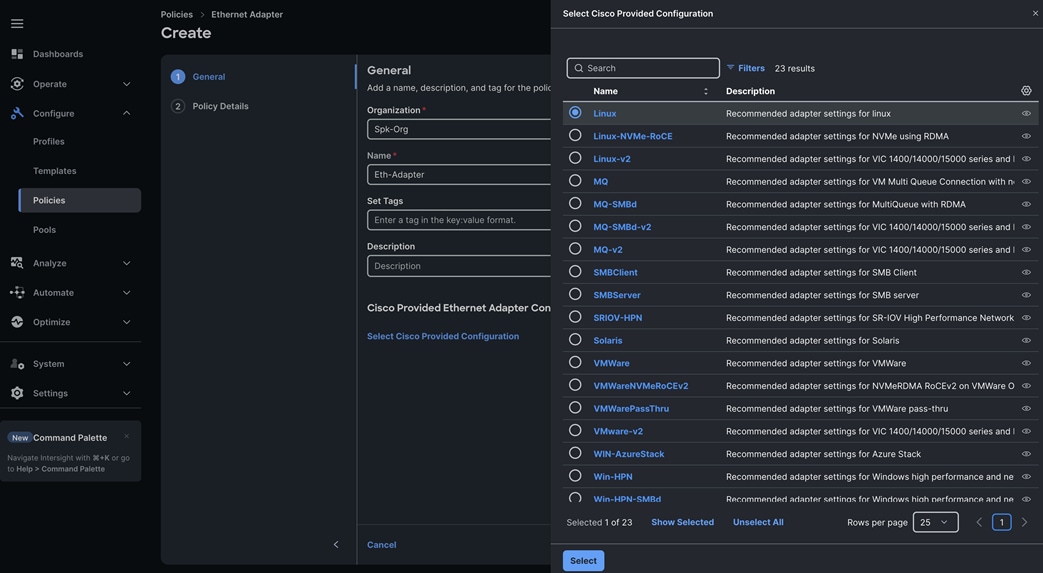
Step 4. Select the “Cisco Provided Ethernet Adapter Configuration” and click the option “Select Cisco Provided Configuration” and then click Linux as shown below:
Step 5. In the Policy Details section, for the recommended performance on the ethernet adapter, keep the “Interrupt Settings” parameter.
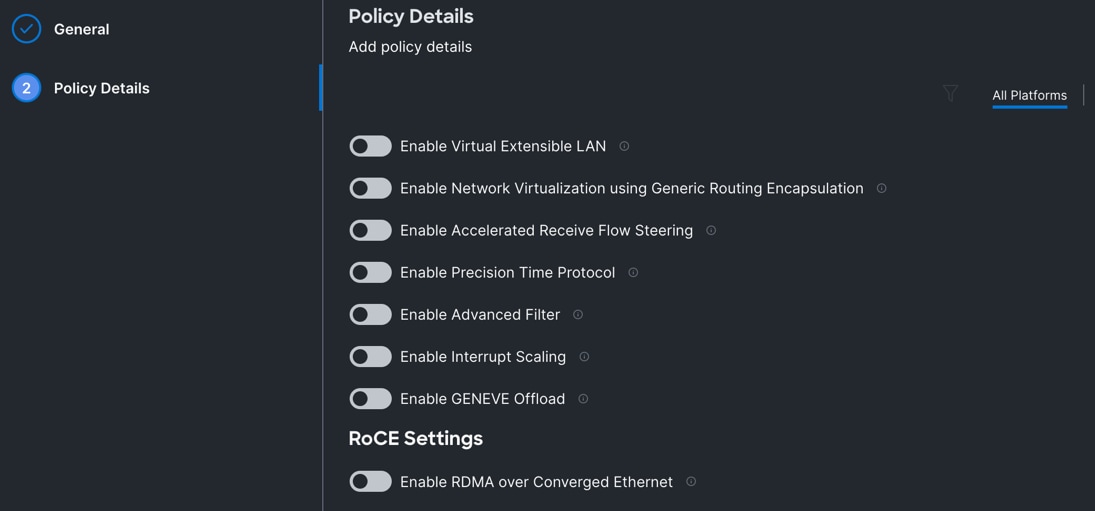
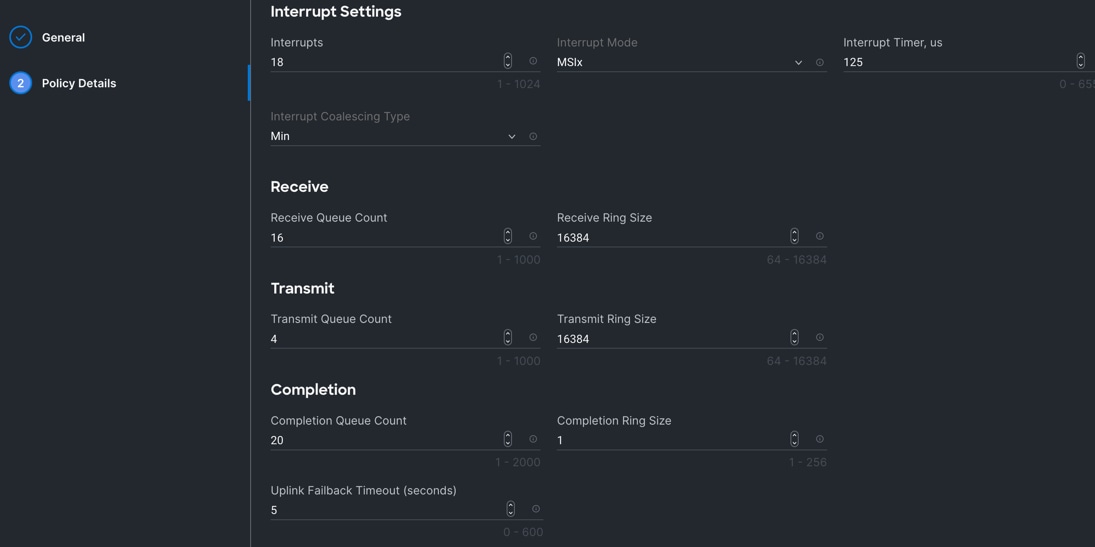
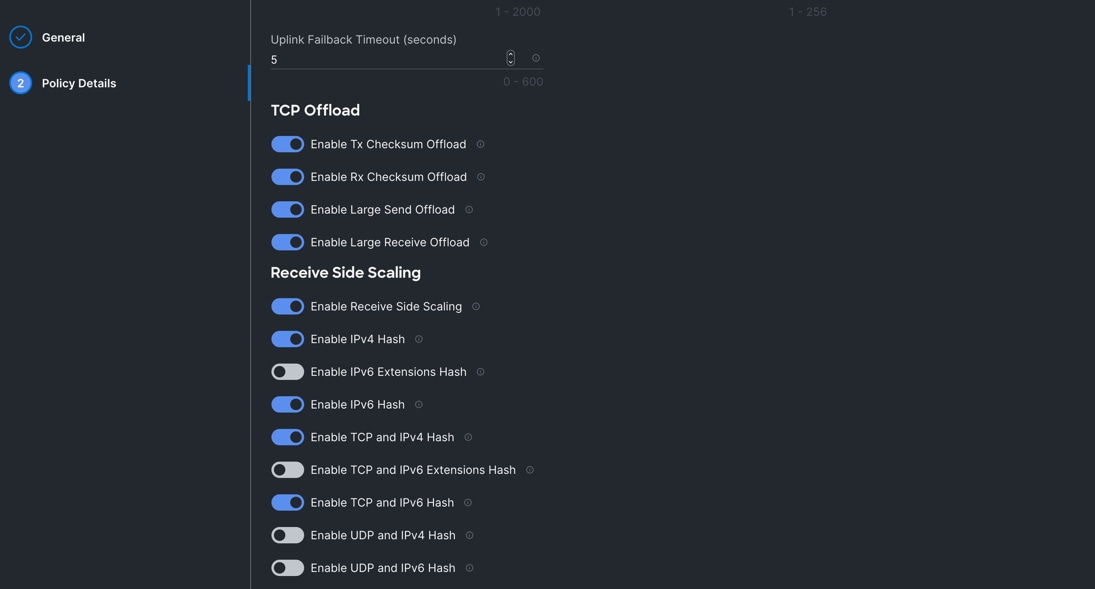
Step 6. Click Create to create this policy.
Procedure 7. Create Ethernet QoS Policy
Step 1. To configure the Ethernet QoS Policy for the UCS Server profile, go to > Configure > Polices > and click Create Policy.
Step 2. For the platform type select UCS Server and for the policy select Ethernet QoS.
Step 3. In the Create Ethernet QoS Configuration section, for the Organization select Spk-Org and for the policy name enter “Eth-QoS-1500” click Next.
Step 4. Enter QoS Settings as shown below to configure 1500 MTU for management vNIC:
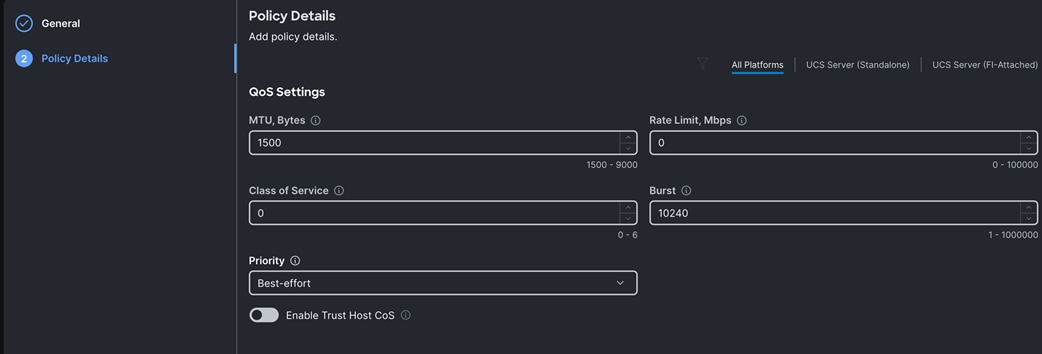
Step 5. Click Create to create this policy for vNIC0.
Step 6. Create another QoS policy for second vNIC running indexing network traffic.
Step 7. In the Create Ethernet QoS Configuration section, for the Organization select Spk-Org and for the policy name enter “Eth-QoS-9000.” Click Next.
Step 8. Enter QoS Settings as shown below to configure 9000 MTU for replication vNIC traffic.
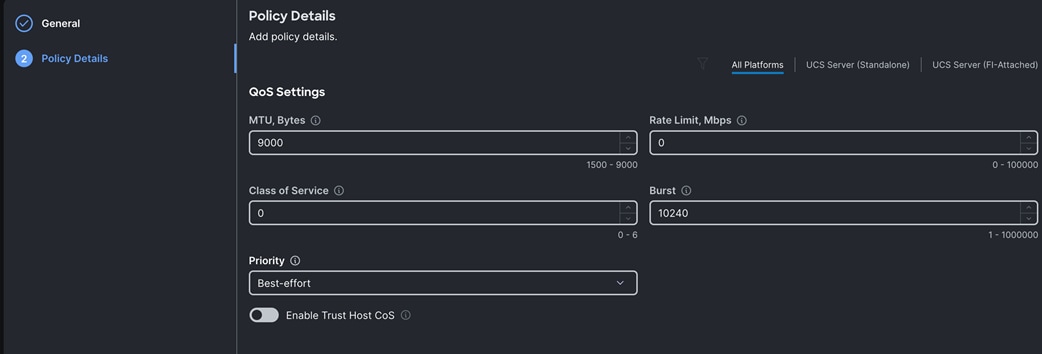
Step 9. Click Create to create this policy for vNIC1.
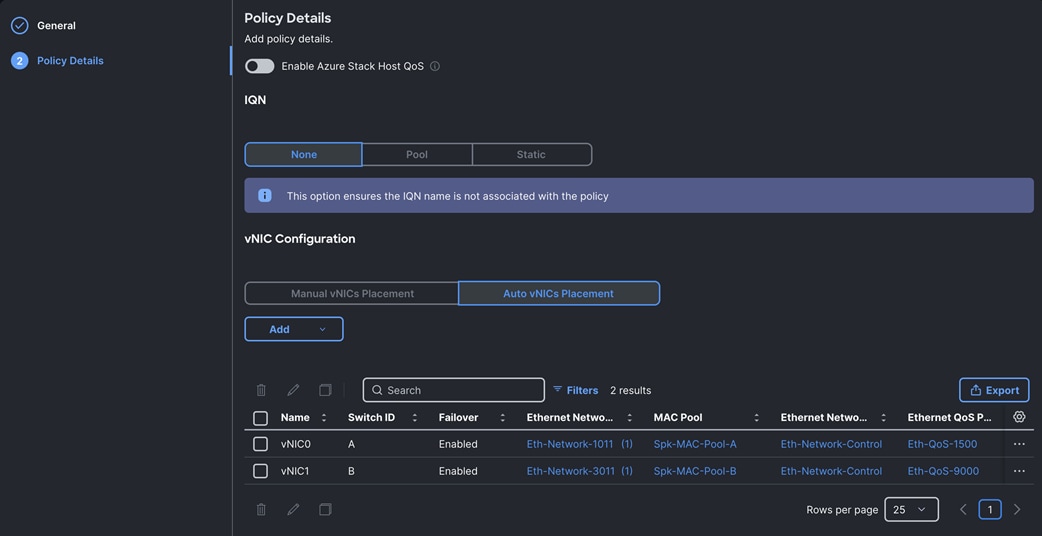
Procedure 8. Configure LAN Connectivity Policy
Two vNICs were configured per server as listed in Table 8.
| Name |
Switch ID |
Failover |
MAC Pool |
Ethernet QoS Policy |
Ethernet Network Group |
| vNIC0 |
FI – A |
Enabled |
Spk-MAC-Pool-A |
Eth-QoS-1500 |
Eth-Network-1011 |
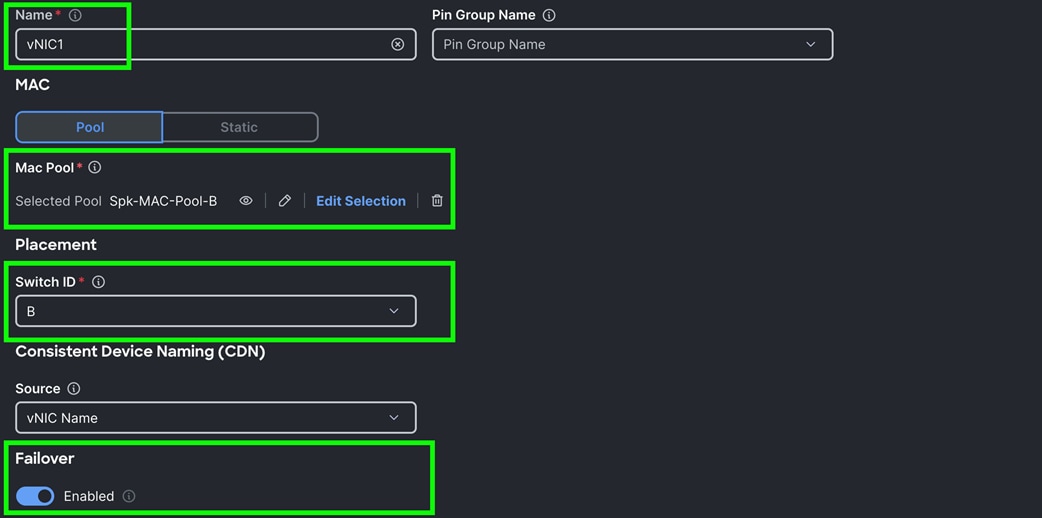
| vNIC1 |
FI – B |
Enabled |
Spk-MAC-Pool-B |
Eth-QoS-9000 |
Eth-Network-3011 |
Step 1. Go to > Configure > Polices > and click Create Policy. For the platform type select “UCS Server” and for the policy select “LAN Connectivity.”
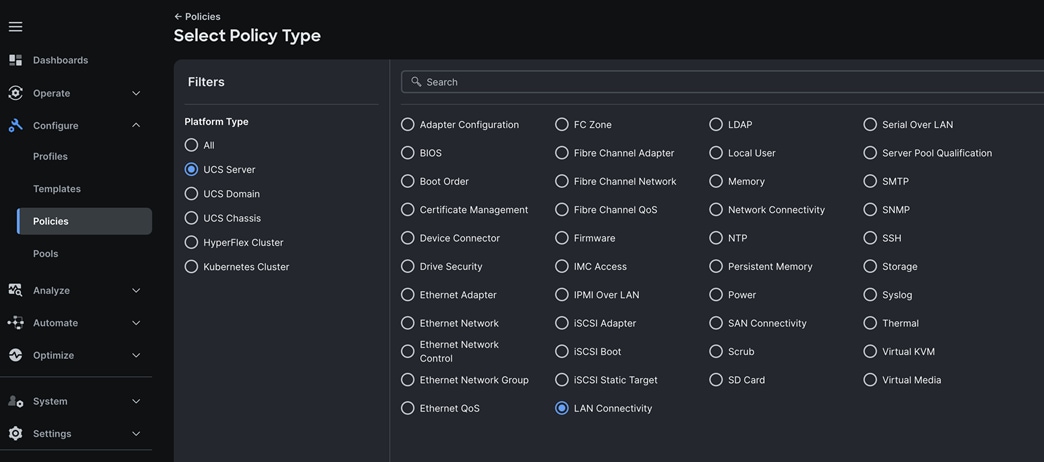
Step 2. In the LAN Connectivity Policy Create section, for the Organization select “Spk-Org” for the policy name enter “Spk-LAN-Connectivity” and for the Target Platform select UCS Server (FI-Attached). Click Next.
Step 3. In the Policy Details section, for vNIC Configuration select “Auto vNICs Placement” and then click Add vNIC.
Step 4. In the Add vNIC section, for the first vNIC enter vNIC0. In the Edit vNIC section, for the vNIC name enter "vNIC0" and for the MAC Pool select Spk-MAC-Pool-A. In the Placement option, select Switch ID as A. Also enable the Failover option as shown below. This enables the vNIC to failover to another FI.
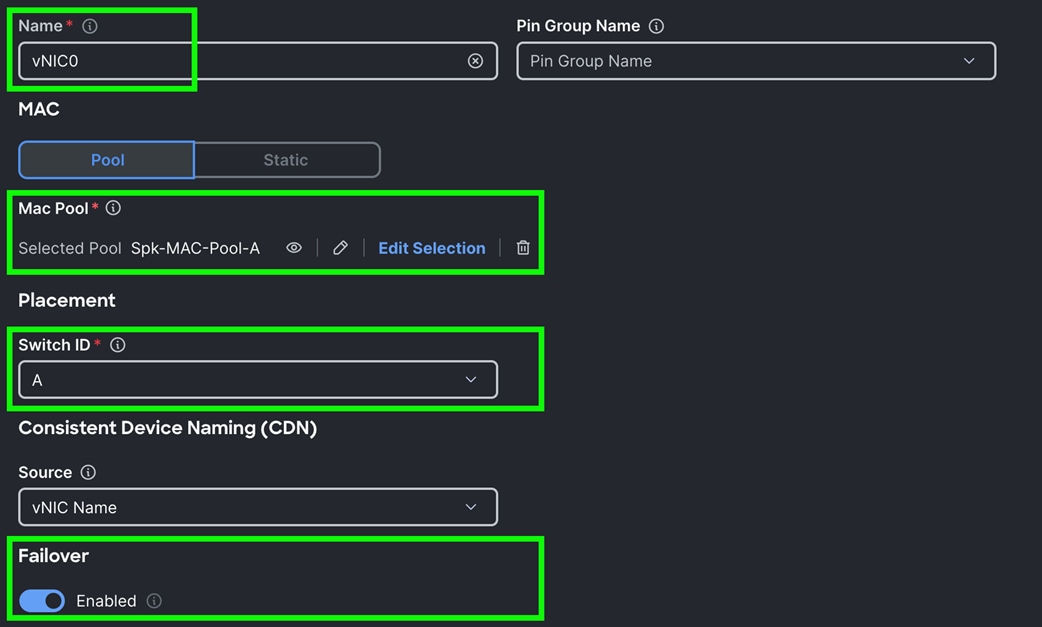
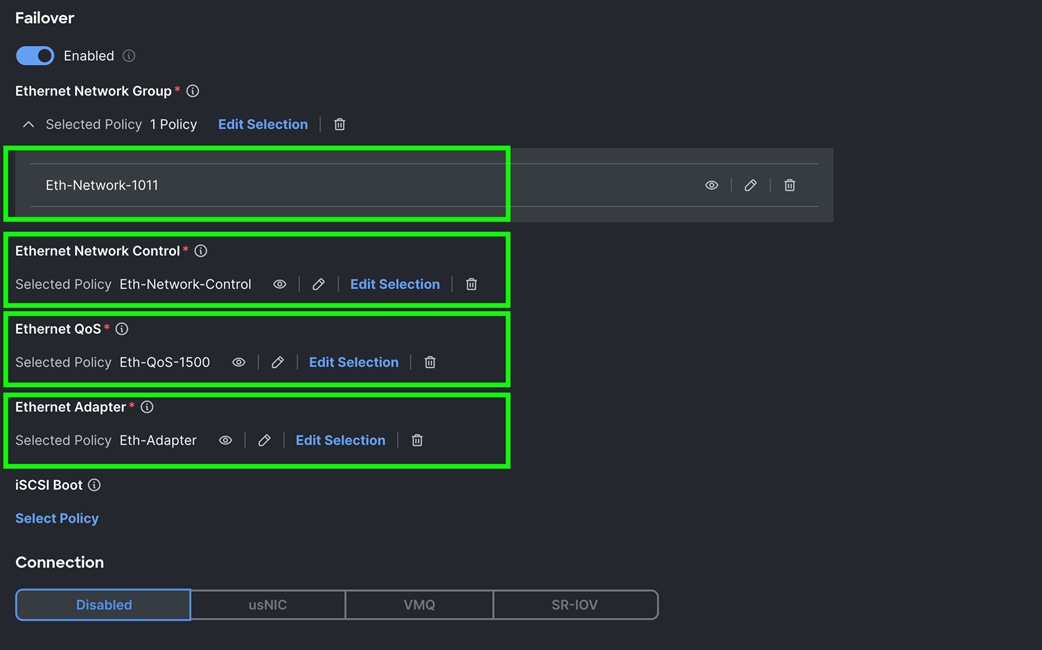
Step 5. For the Ethernet Network Group Policy, select Eth-Network-1011. For the Ethernet Network Control Policy select Eth-Network-Control. For Ethernet QoS, select Eth-QoS-1500, and for the Ethernet Adapter, select Eth-Adapter. Click Add to add vNIC0 to this policy.
Step 6. Add a second vNIC. For the name enter "vNIC1" and for the MAC Pool select Spk-MAC-Pool-B.
Step 7. In the Placement option, for Switch ID select B and enable Failover option for this vNIC configuration. This enables the vNIC to failover to another FI.
Step 8. For the Ethernet Network Group Policy, select Eth-Network-3011. For the Ethernet Network Control Policy, select Eth-Network-Control. For the Ethernet QoS, select Eth-QoS-9000, and for the Ethernet Adapter, select Eth-Adapter. Click Add to add vNIC1 to this policy.
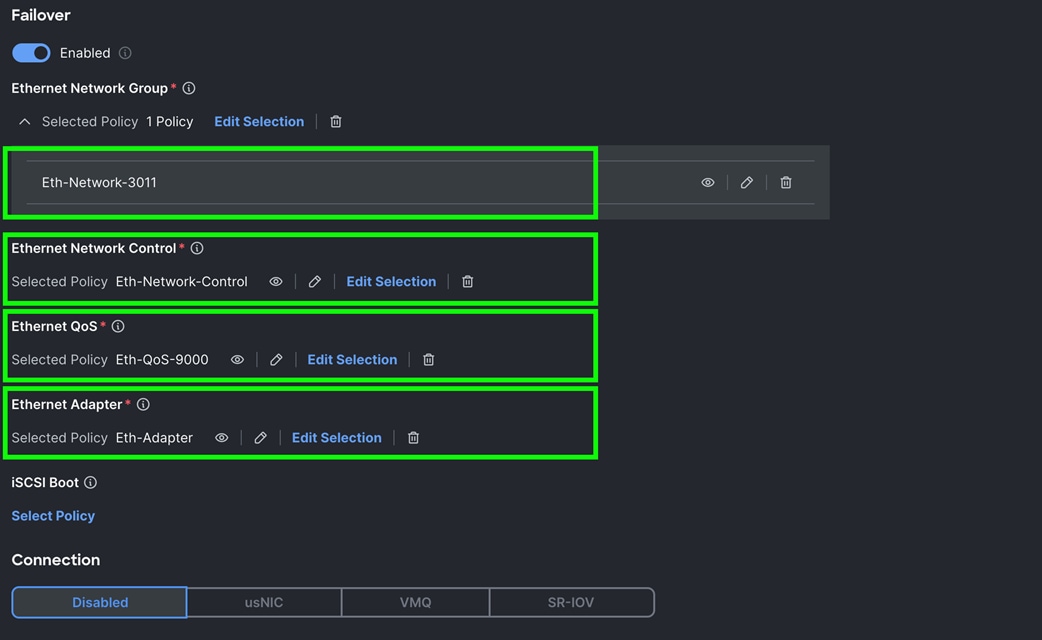
Step 9. Click Add to add vNIC1 into this policy.
Step 10. After adding these two vNICs, review and make sure the Switch ID, PCI Order, Failover Enabled, and MAC Pool are as shown below:
Step 11. Click Create to create this policy.
Procedure 9. Configure Boot Order Policy
For this solution, two local server nodes M.2 SSD were used, and the virtual drive was configured to install the OS locally on all of the server nodes.
Step 1. To configure Boot Order Policy for UCS Server profile, go to > Configure > Polices > and click Create Policy.
Step 2. For the platform type select “UCS Server” and for the policy select “Boot Order.”
Step 3. In the Boot Order Policy Create section, for the Organization select “Spk-Org” and for the name of the Policy select “M.2-Boot.” Click Next.
Step 4. In the Policy Details section, click Add Boot Device and for the boot order add “Virtual Media” (KVM-DVD) and “Local Disk” (M2-SSD) as shown below:
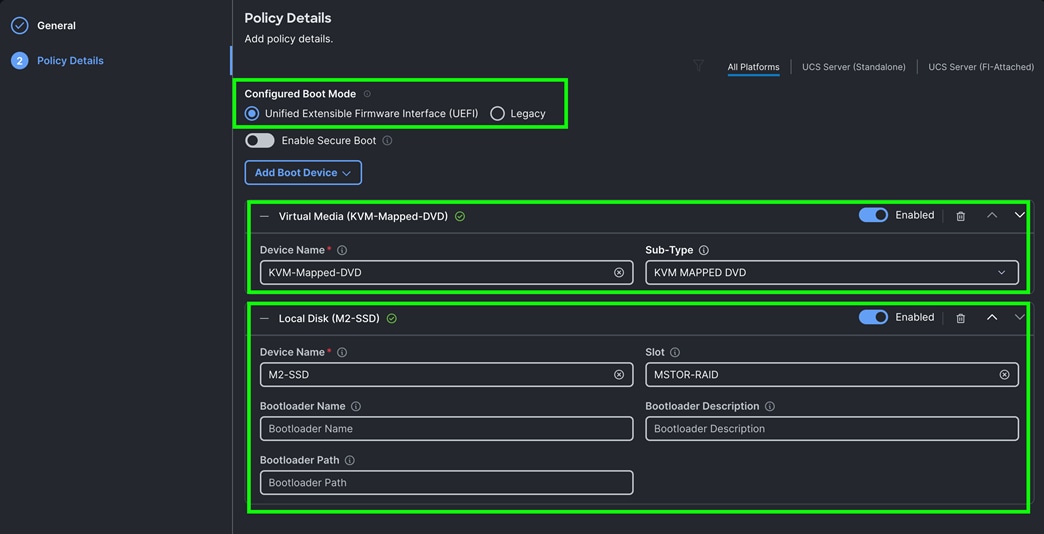
Step 5. Click Create to create this policy
Procedure 10. Configure Storage Policy
For this solution, we configured two types of local storage policy. First storage policy was configured for all the indexer server nodes and second storage policy was configured for all the search head and admin server nodes.
As documented earlier in UCS hardware inventory table, we used 16 NVMe drives for the indexer server nodes. And for the remaining search head and admin nodes, we used two local NVMe drives for local storage. We configured and created local storage and RAID configuration on each of the indexer as shown below.

All the indexer Cisco UCS C245 M8 server nodes having 2 x Cisco Tri-Mode 24G SAS RAID controller and to take advantage of this RAID controllers for better read/write performance and even drive distribution, we spread 16 NVMe drives across two groups with each group having 8 drives for storage. First set of 8 NVMe drives were placed on RAID controller 1 (drive slot 1 to 8) as highlighted in red here and then RAID10 was configured for storing Hot/Warm local storage. Second set of 8 drives were distributed on RAID controller 2 (drive slot 13 to 20) as shown in green and then RAID5 was configured for storing Cold local storage.
For all other management and search head server nodes, we used two local NVMe drives and configured RAID1 for storage policy as explained below.
Step 1. To configure Storage Policy for UCS Server profile, go to > Configure > Polices > and then select the tab for UCS Server > Storage > and click Start.
Step 2. In Create Storage policy general menu, for the Organization select “Spk-Org” and for the Name for the policy as “C245-Storage-RAID10-RAID5” and then click Next.
Step 3. Choose Default Drive State as JBOD, enabled M.2 RAID Configuration and selected appropriate slot as MSTOR-RAID-1 (MSTOR-RAID) as shown below:
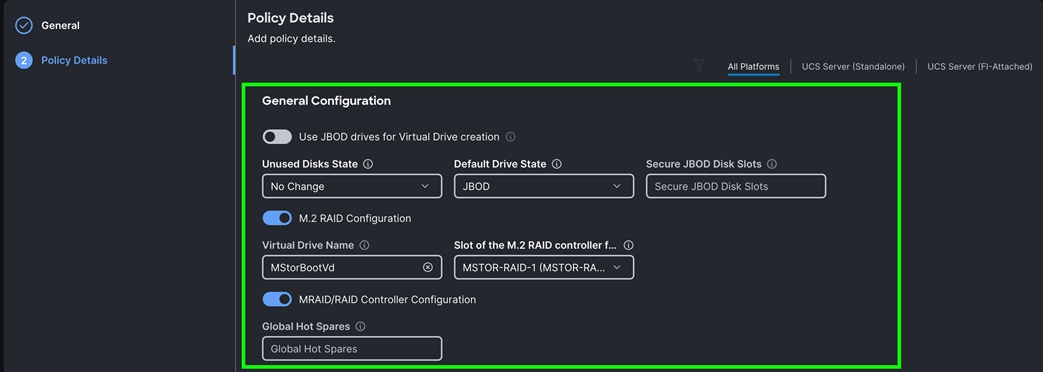
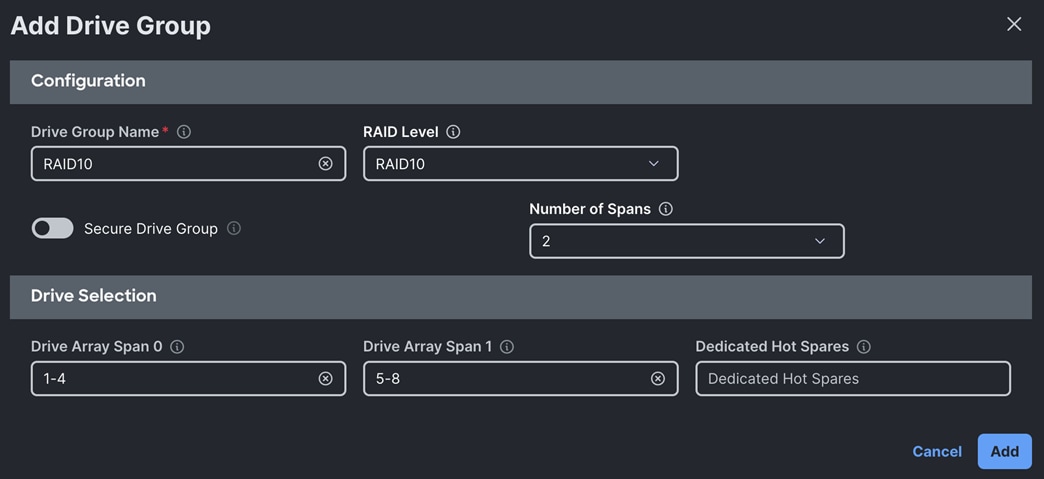
Step 4. Enable MRAID/RAID Controller configuration to create virtual drives. Click Add Drive Group.
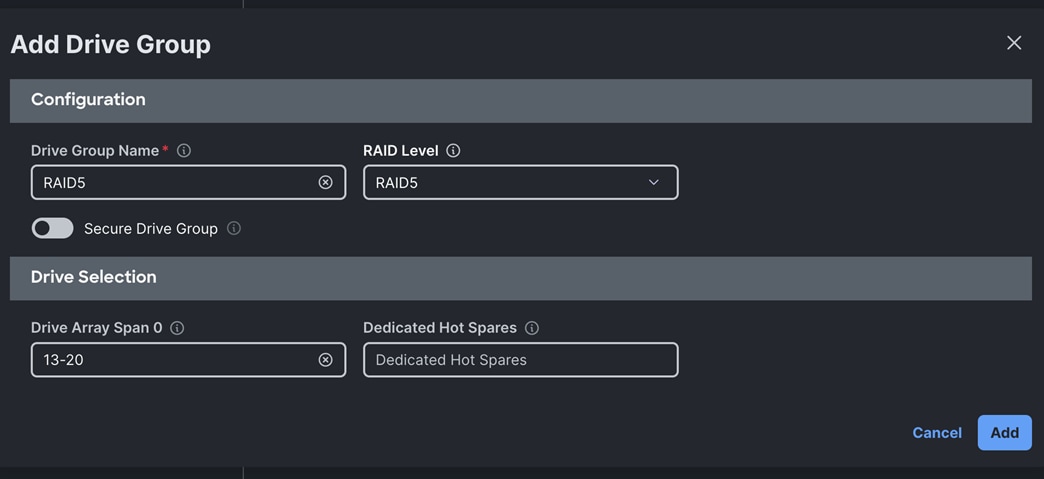
Note: We configured two Drive Group as RAID 10 and RAID5.
RAID10 drive group was configured for the drive span 1 to 8 as shown below:
RAID5 drive group was configured for the drive span 13 to 20 as shown below:
Step 5. After creating these two separate drive groups, click Add Virtual Drive to create virtual drive.
The first Virtual Drive for RAID10 was configured with using the Drive Group RAID10 as shown below:
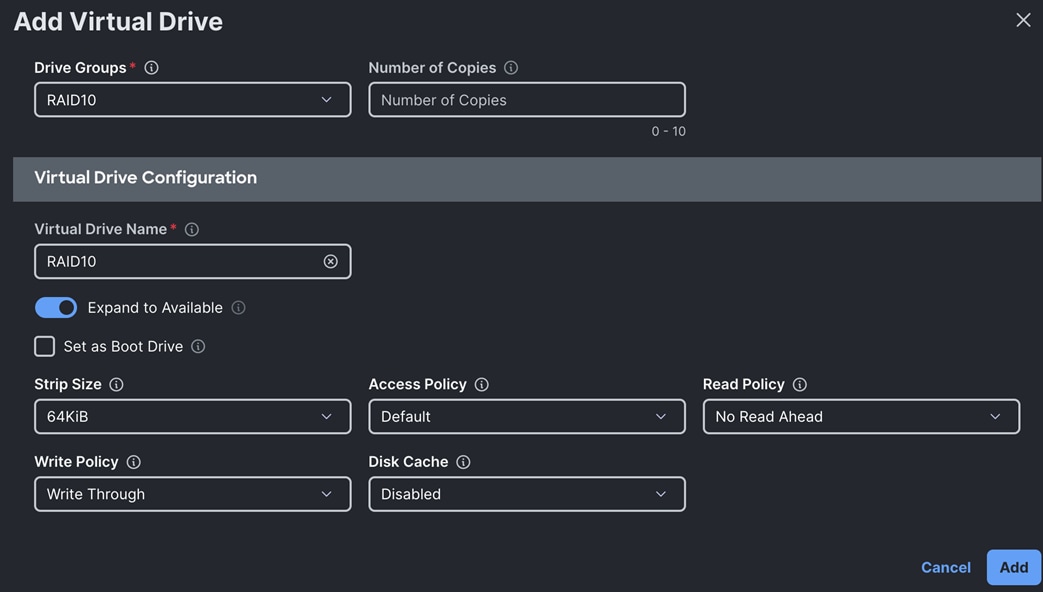
The second Virtual Drive for RAID5 was configured with using the Drive Group RAID5 as shown below:

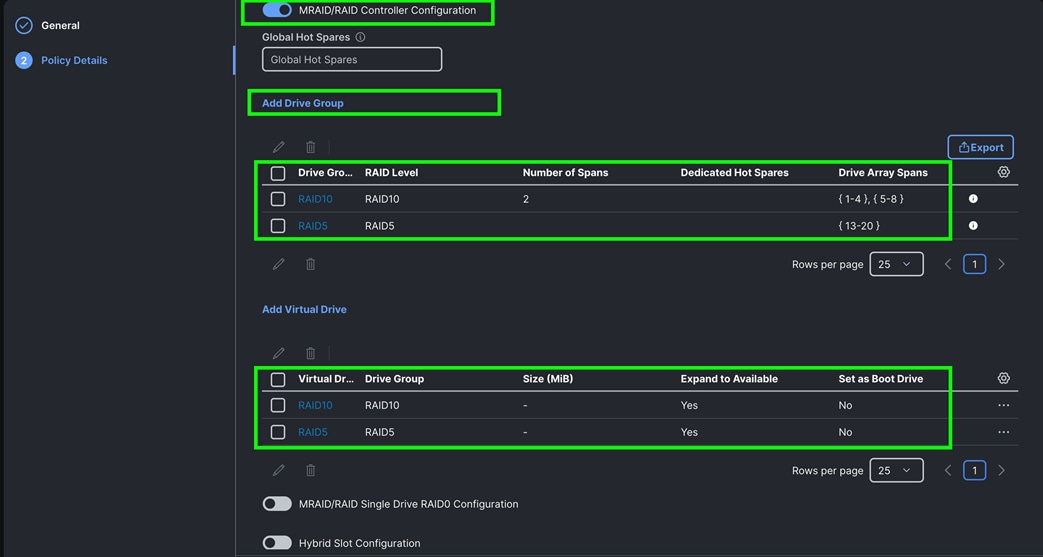
Step 6. After configuring the drive group and virtual drive, click Create.
The Virtual Drive Group and Virtual Drives for an indexer node is shown below:
Step 7. Create one virtual drive as RAID1 for admin and search head nodes.
Step 8. Go to > Configure > Polices > and then select the tab for UCS Server > Storage > and click Start.

Step 9. In Create Storage policy general menu, for the Organization select “Spk-Org” and for the Name for the policy as “C225-Storage-RAID1” and then click Next.
Step 10. For the Default Drive State choose JBOD, enabled M.2 RAID Configuration and select the appropriate slot as MSTOR-RAID-1 (MSTOR-RAID) as shown below:
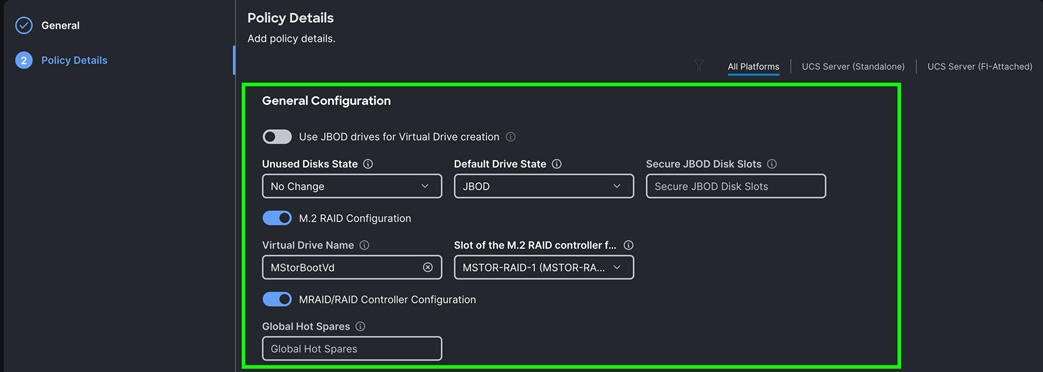
Step 11. Enable MRAID/RAID Controller configuration to create virtual drives. Click Add Drive Group.
Note: We configured one Drive Group as RAID1.
The RAID1 drive group was configured for the drive span 1 and 2 as shown below:
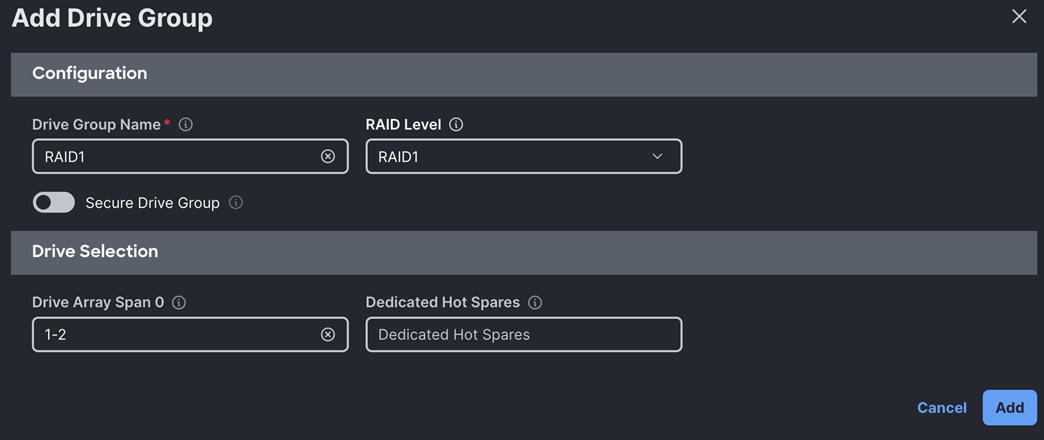
Step 12. After creating this drive group, click Add Virtual Drive to create virtual drive.
The Virtual Drive for RAID1 was configured with using the Drive Group RAID1 as shown below:
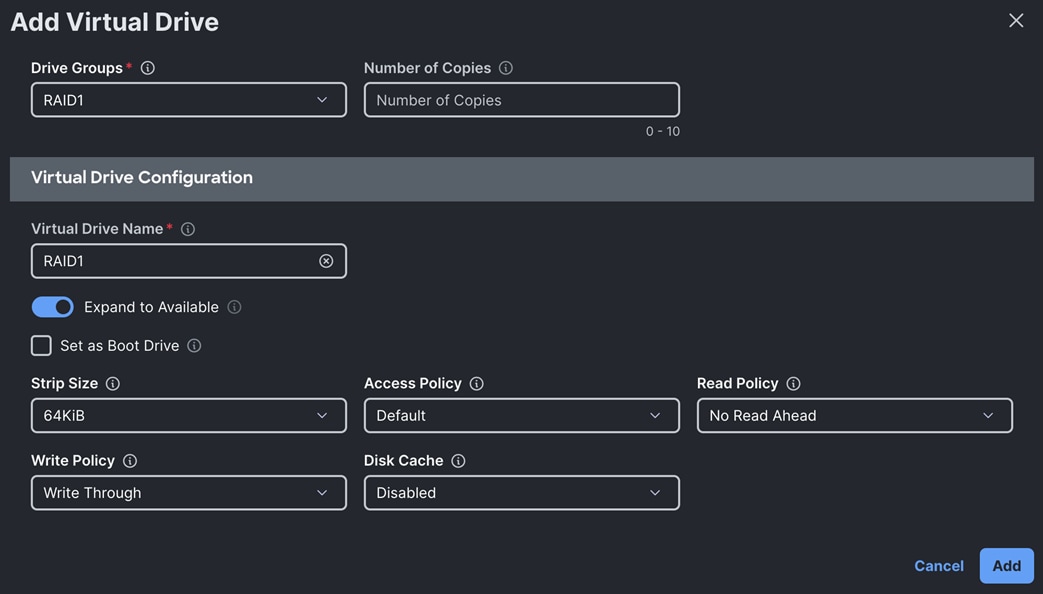
The Second Virtual Drive for RAID5 was configured with using the Drive Group RAID5 as shown below:
Step 13. After configuring above drive group and virtual drive, click Create.
The Virtual Drive Group and Virtual Drive for an admin and search head nodes is shown below:
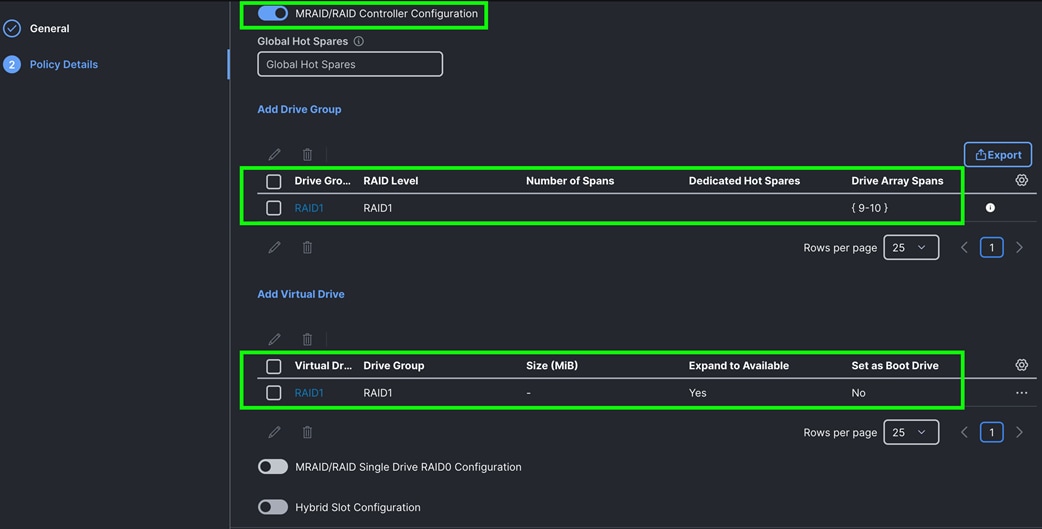
Note: Use all the configured policies for indexer, admin, and search head nodes except the storage policy. For an indexer server profile, use “C245-Storage-RAID10-RAID5” storage policy while for the admin and search head nodes, use “C225-Storage-RAID1” storage policy.
Procedure 11. Configure Server Profiles
The Cisco Intersight server profile allows server configurations to be deployed directly on the compute nodes based on polices defined in the profile. After a server profile has been successfully created, server profiles can be attached with the Cisco UCS C225 and C245 M8 Server Nodes.
Note: For this solution, we configured eight server profiles for indexer nodes (Indexer1, Indexer2, Indexer3, Indexer4, Indexer5, Indexer6, Indexer7 and Indexer8), three server profiles for admin nodes (admin1, admin2 and admin3) and three server profiles for search head nodes (Search-Head-1, Search-Head-2, and Search-Head-3) to deploy and configure the indexer, admin, and search head nodes.
Note: For this solution, we configured one server profile as “Indexer1” and attached all policies for the server profile which were configured in the previous section. We cloned the first server profile and created seven more server profiles as “Indexer2”, “Indexer3”, “Indexer4”, “Indexer5”, “Indexer6”, “Indexer7” and “Indexer8”. Alternatively, you can create a server profile template with all server profile policies and the derive server profile from the standard template.
Note: Similarly, we configured one server profile as “admin1” and attached all policies for the server profile which were configured in the previous section. We cloned the first server profile and created five more server profiles as “admin2”, “admin3”, “Search-Head-1”, “Search-Head-2” and “Search-Head-3.”
Step 1. Go to > Configure > Profile > and then select the tab for UCS Server Profile. Click Create UCS Server Profile.
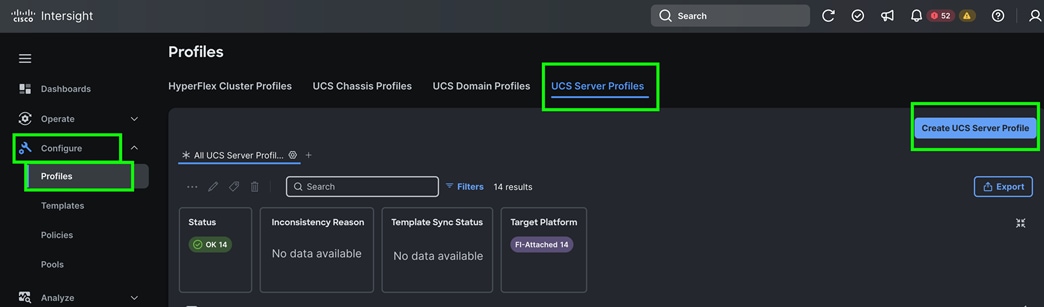
Step 2. In Create Server Profile, for the Organization select “Spk-Org” and for the Name for the Server Profile enter “Indexer1.” For the Target Platform type select UCS Server (FI-Attached).
Step 3. In the Server Assignment menu, select the option “Assign Later” to create the policy after creating and cloning all the server profiles; you will assign these server profiles later in the next section. Click Next.
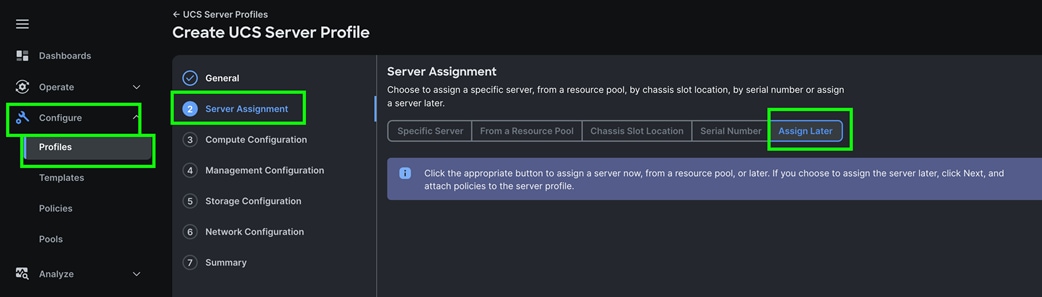
Step 4. In the Compute Configuration menu, select UUID Pool and select the “Spk-UUID” option that you previously created. For the BIOS select “C245-Default-BIOS” and for the Boot Order select “M.2-Boot” that you previously created. Click Next.
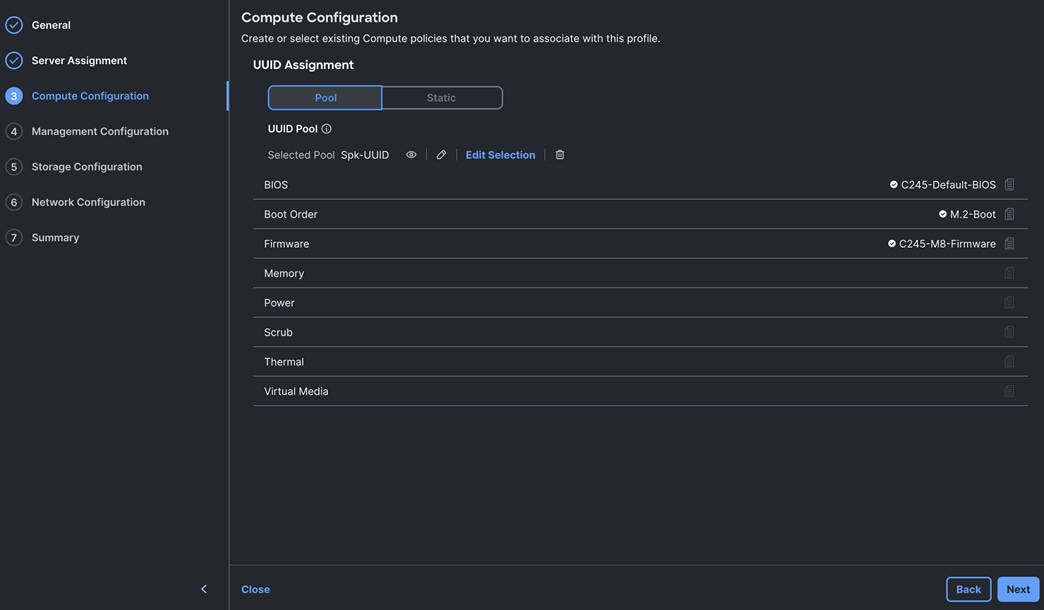
Note: For this solution, we did not configure policies for Memory, Power, Scrub, Thermal and Virtual Media.
Step 5. In the Management Configuration menu, for the IMC Access select “Spk-IMC-Access” to configure the Server KVM access and for the Virtual KVM, select “Virtual-KVM-Policy.” Click Next.
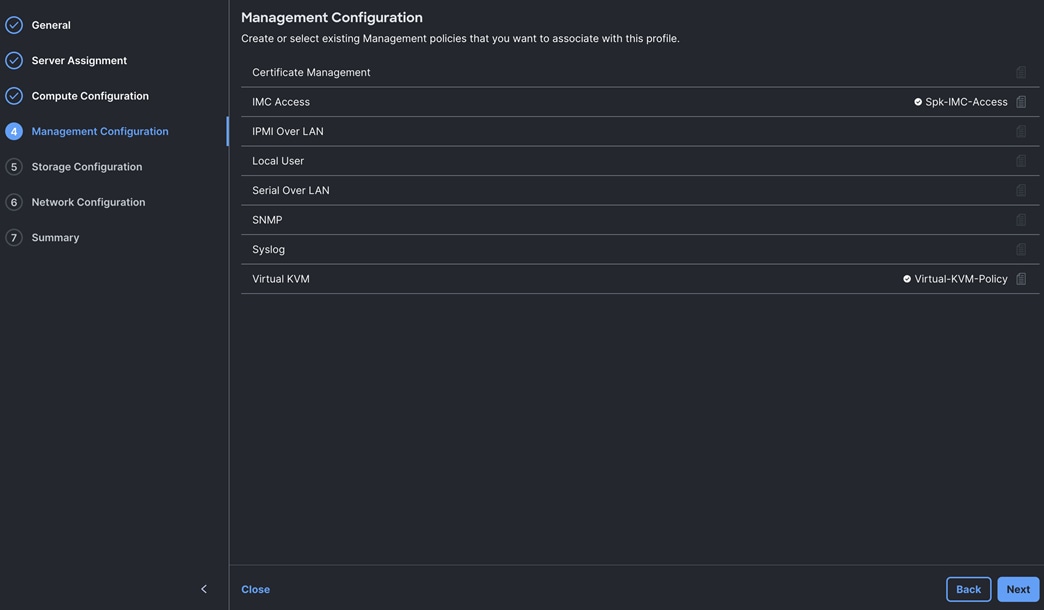
Note: We did not configure any local storage or any storage policies for this solution.
Step 6. For the Storage Configuration section, select “C245-Storage-RAID10-RAID5” policy as shown below:
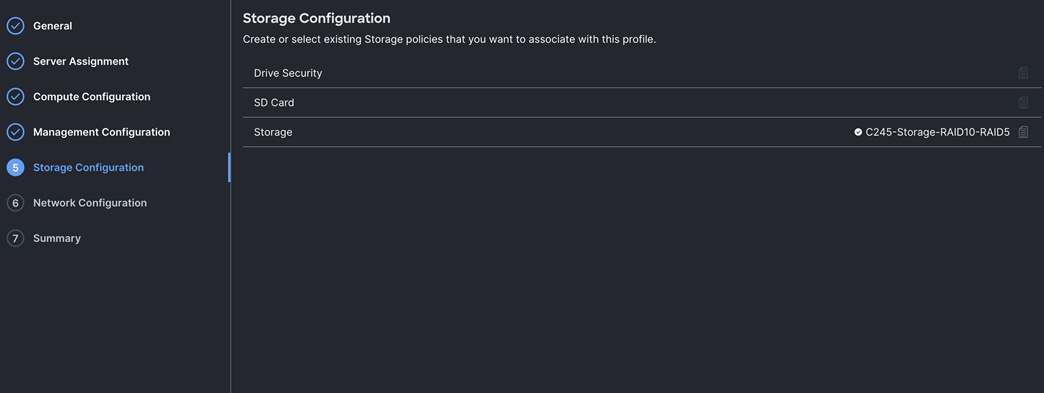
Step 7. Click Next to go to Network configuration.
Step 8. For the Network Configuration section, for the LAN connectivity select “Spk-LAN-Connectivity” policy that you previously created.
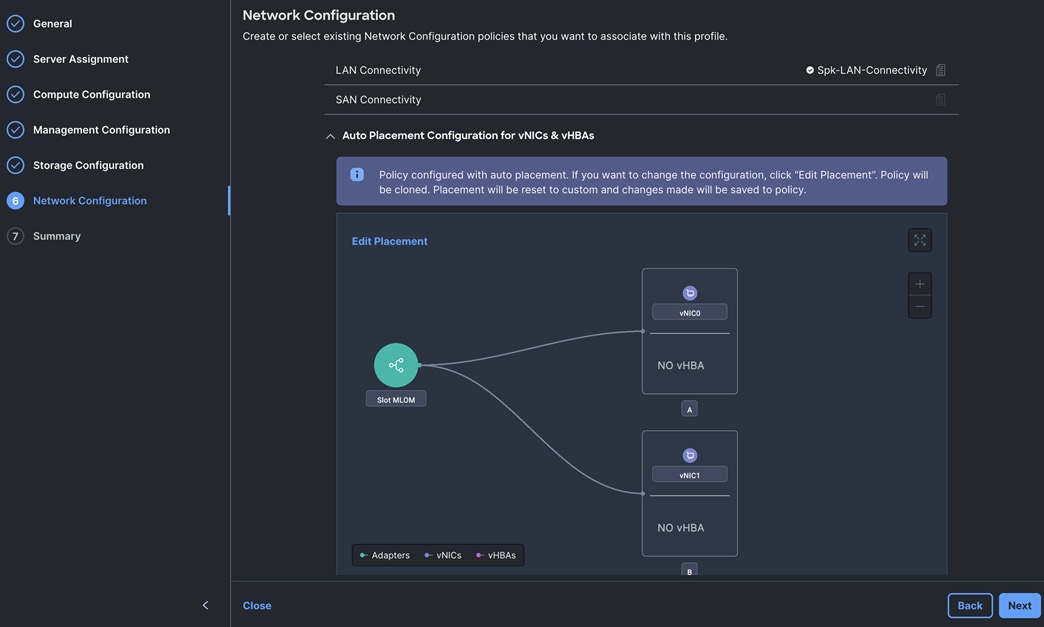
Note: By assigning this LAN connectivity in the server profile, the server profile will create and configure two vNIC on the server for both management, replication as well as indexing network traffic.
Step 9. Click Next and review the summary for the server profile and click Close to save this server profile.
Step 10. To clone and create another server profiles, go to > Configure > Profiles > UCS Server Profiles and Select server Profile “Indexer1” and click the radio button “---” and select option Clone as shown below:
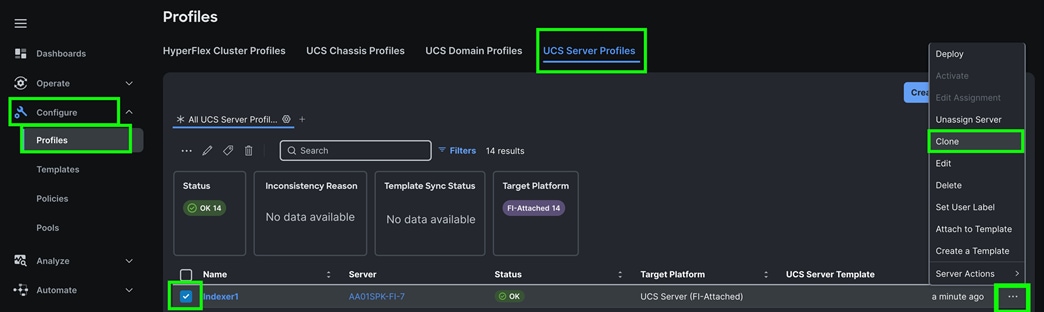
Step 11. In the Clone configuration general menu, select “Assign Later” and number of clones as “7.” Click Next.
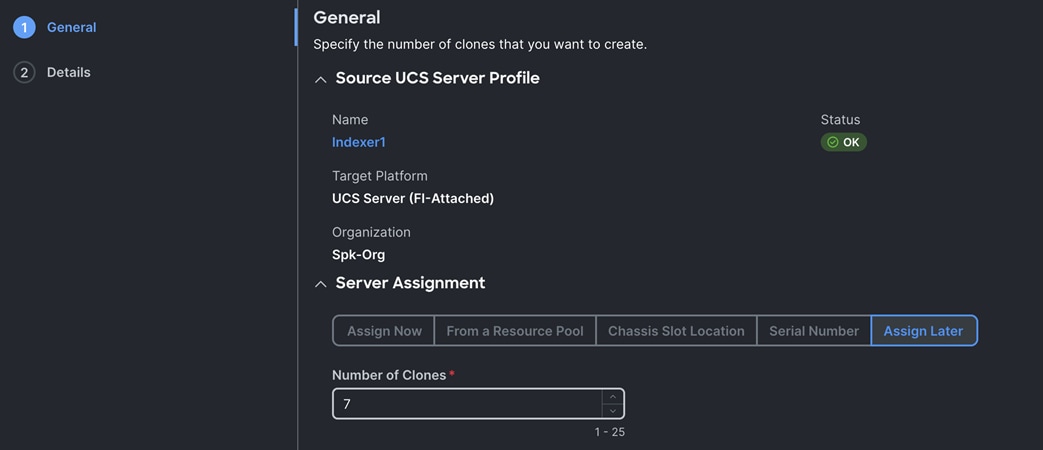
Step 12. In the Clone Details menu, enter the Clone Details as shown below.
Note: We kept Clone Name Prefix as “Indexer,” Digit Count as “1” and “Start Index for Suffix” as “2” to create remaining seven indexer server profiles.
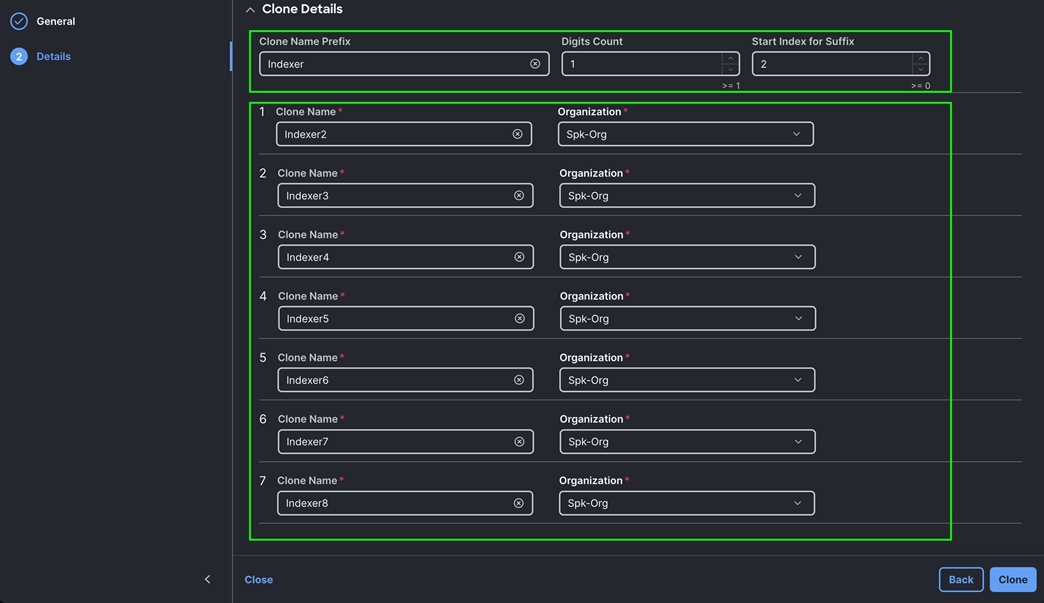
Note: Similarly, we created another server profile for admin node as “admin1” and cloned this server profile for remaining admin and search head nodes.
Step 13. Server profile “admin1” uses all the same above policies except storage policy. For the admin server profile (admin1), we used “C225-Storage-RAID1” as admin and search head nodes have only two drives and we configured virtual drive as RAID1 on this server profile.
Step 14. After creating server profile “admin1”, we cloned this server profile to create two more server profile for admin nodes (admin2 and admin3) as shown below:
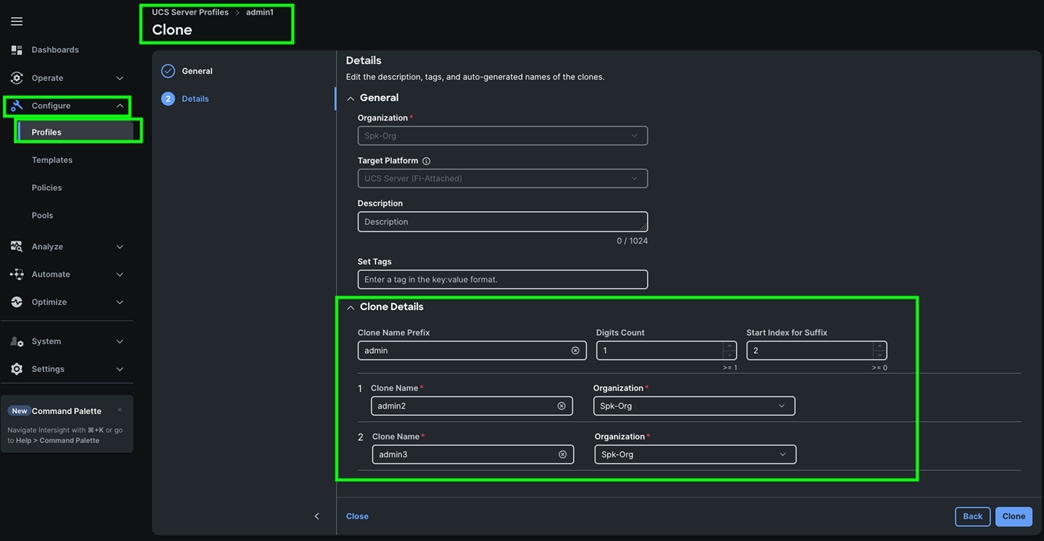
Note: We cloned this admin1 server profile and created three more server profile for search head nodes (Search-Head-1, Search-Head-2, and Search-Head-3).
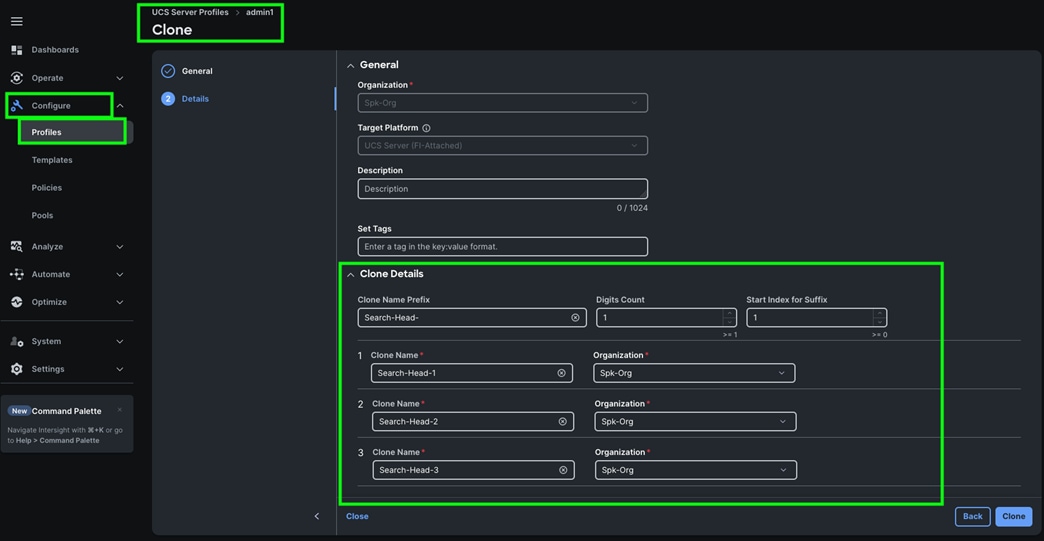
This concludes creating all of the server profiles for all 14 server nodes ( 8 indexer nodes, 3 admin nodes and 3 search head nodes).
Step 15. Review all of the server profile as shown below:
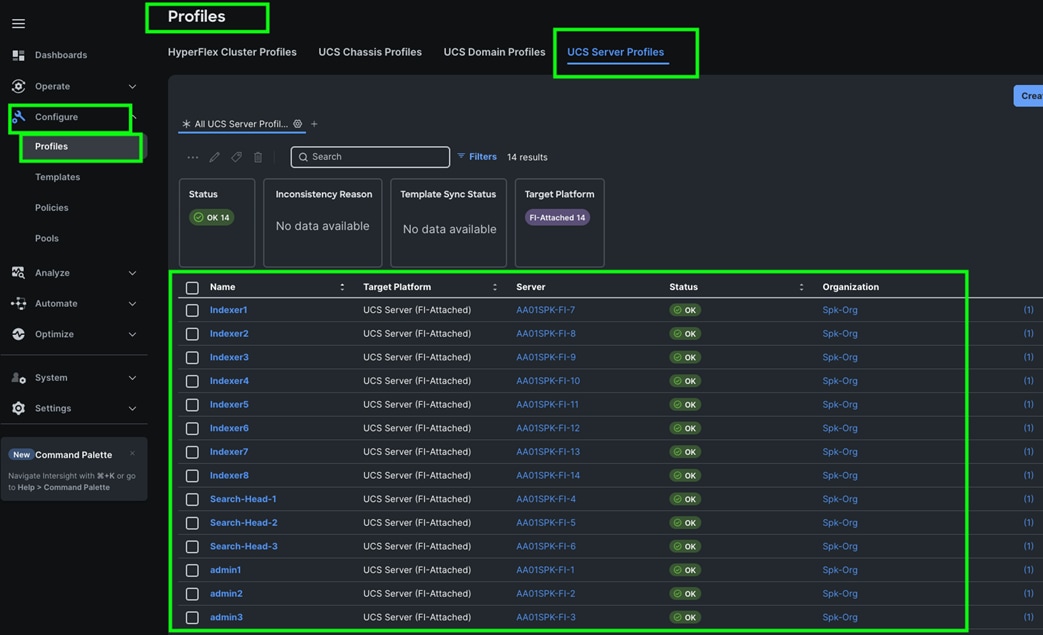
Procedure 12. Assign and Deploy Server Profiles
Step 1. Go to > Configure > UCS Server Profiles > then select the server profile “admin1” and choose Assign Server from the drop-down list.
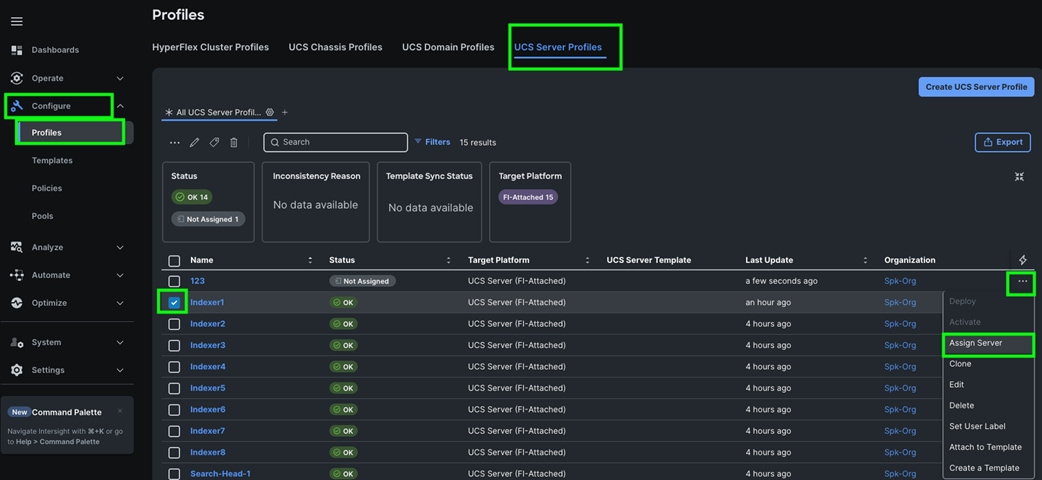
Step 2. From the Assing Server to UCS server Profile, select the specific Server where you want to apply this server profile and click Assign.
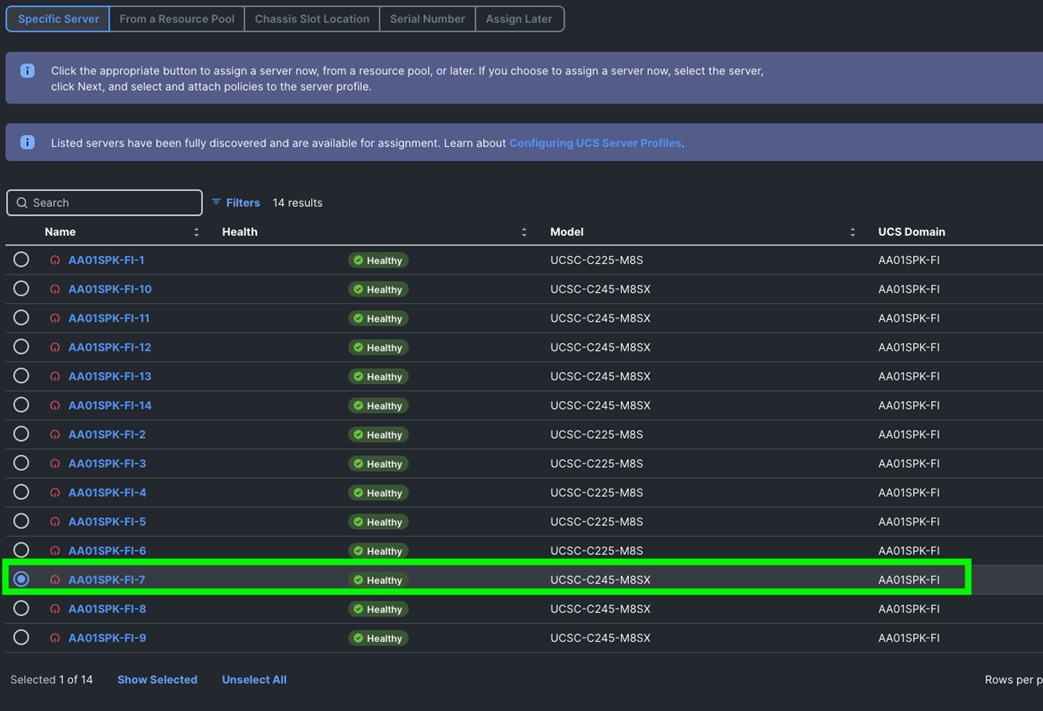
Step 3. After you assign the server profile to the appropriate server, go to > Configure > Profiles > UCS Server Profile > select the same server and click Deploy to configure server as shown below:
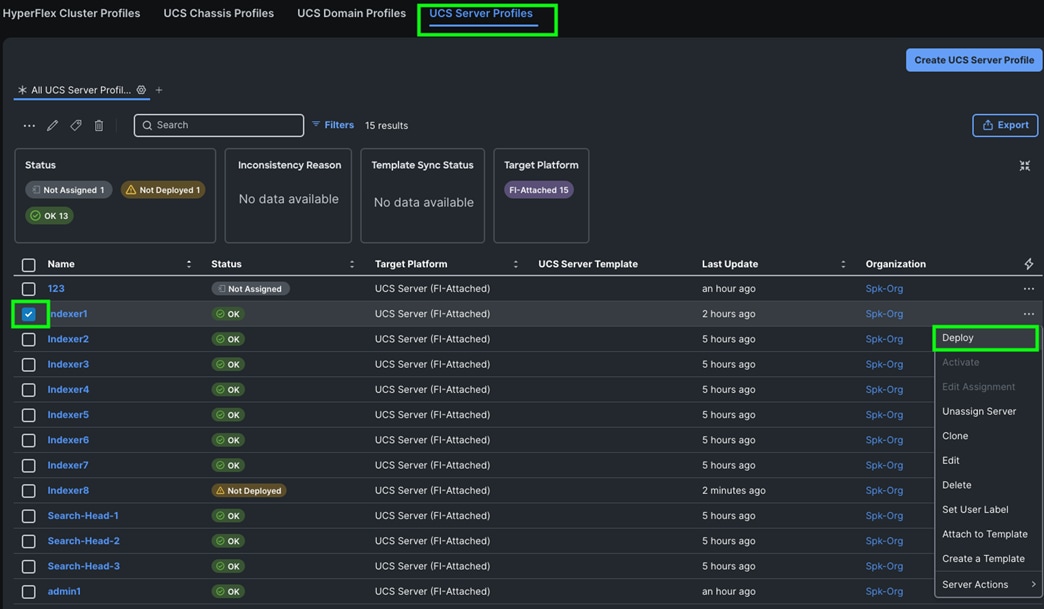
Step 4. Check the boxes and click Deploy to activate the server profile.
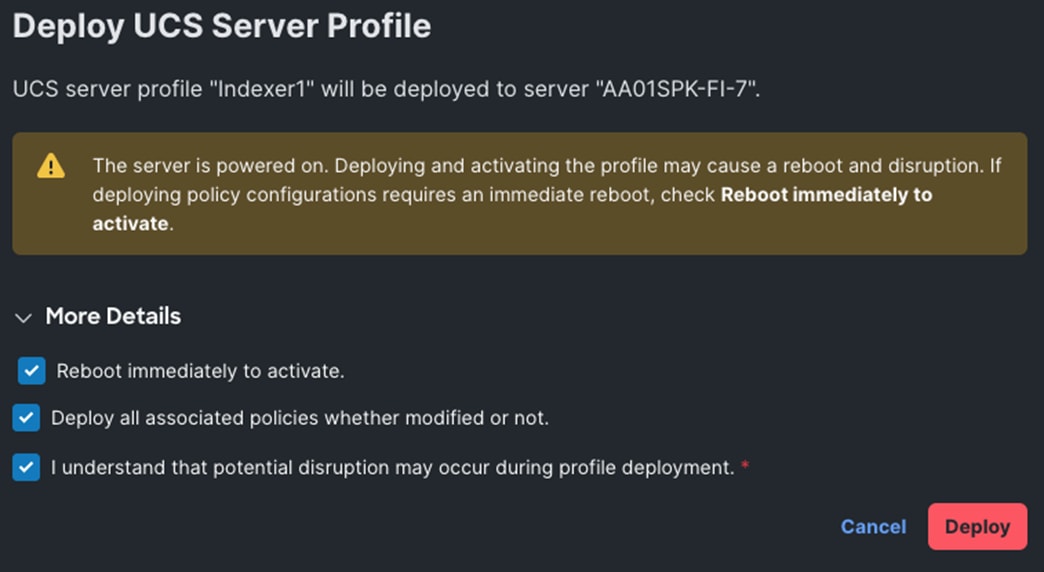
Step 5. Repeat steps 1 – 4 for each server profile and assign the appropriate server and deploy all the server profiles.
Install and Configure Red Hat Enterprise Linux 9.4
This chapter contains the following:
● Install Red Hat Enterprise Linux 9.4
Note: Cisco Intersight enables you to install vMedia-based operating systems on managed servers in a data center. With this capability, you can perform an unattended OS installation on one or more Cisco UCS C-Series Standalone servers and Cisco Intersight Managed Mode (IMM) servers (C-Series, B-Series, and X-Series) from your centralized data center through a simple process. For detailed instructions about adding images to the software repository and installing the operating system, see the following: https://intersight.com/help/saas/resources/OSinstallguide#os_install_steps
This chapter provides detailed procedures for installing Red Hat Enterprise Linux Server using Software RAID (OS based Mirroring) on Cisco UCS C225 and C245 M8 servers. There are multiple ways to install the RHEL operating system. The installation procedure described in this deployment guide uses IMM automated workflow to install the operating system on all the servers through Intersight. For more information, see: https://intersight.com/help/saas/resources/installing_an_operating_system#performing_os_installation_in_cisco_mode
Note: In this solution, Red Hat Enterprise Linux version 9.4 (DVD/ISO) was utilized for OS the installation through Intersight Software Repository as explained in the following sections.
Install Red Hat Enterprise Linux (RHEL) 9.4
This section contains the following procedures:
Procedure 1. Add OS Image Link
Procedure 2. Add Server Configuration Utility Image
Procedure 3. Install the Operating System
Procedure 4. (Optional) Manual Operating System Install
Procedure 1. Add OS Image Link
Step 1. Log into Intersight account.
Step 2. Go to Systems > Software Repository > OS Image Links tab and click the Add OS Image Link icon as shown below:
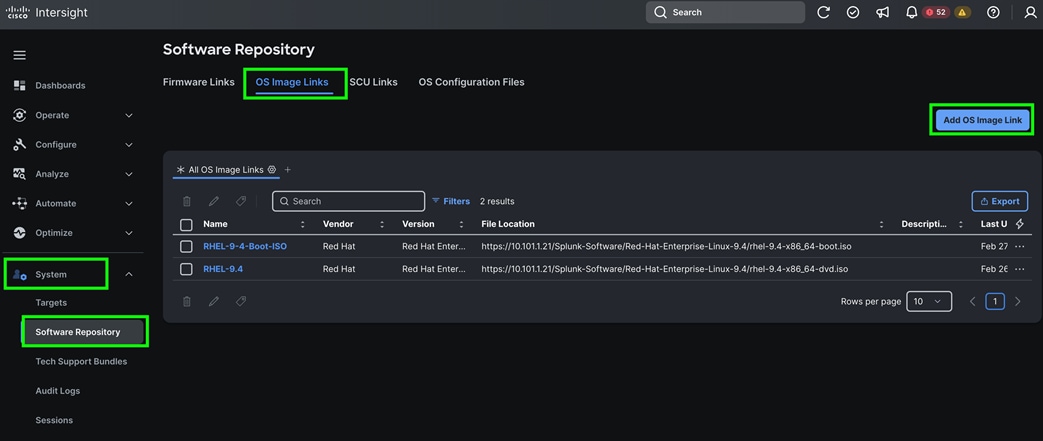
Step 3. Add the image source of the operating system along with details of the file share location and the protocol (CIFS/NFS/HTTPS) to the software repository.
Note: For this solution, we used HTTPS server and provided access of OS ISO as configured below:
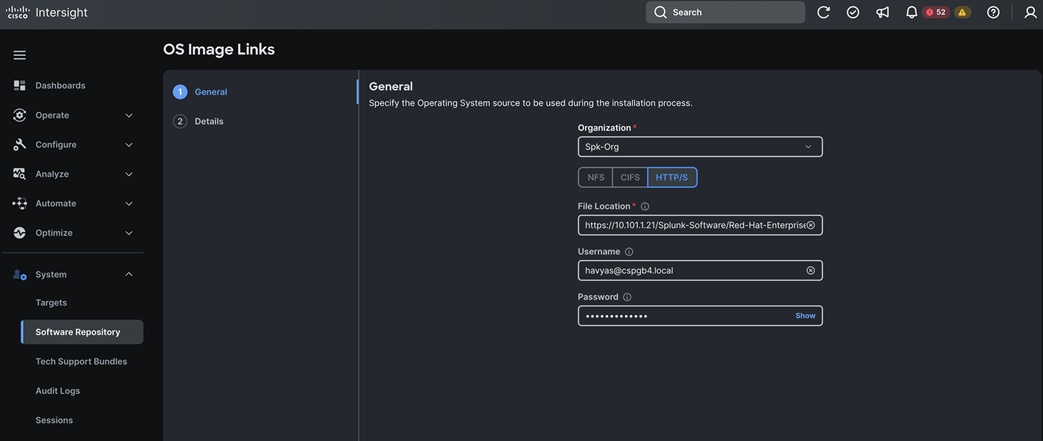
Step 4. Provide the details for Operating System image, modify as required, and save the Operating System image as shown below. Click Save.
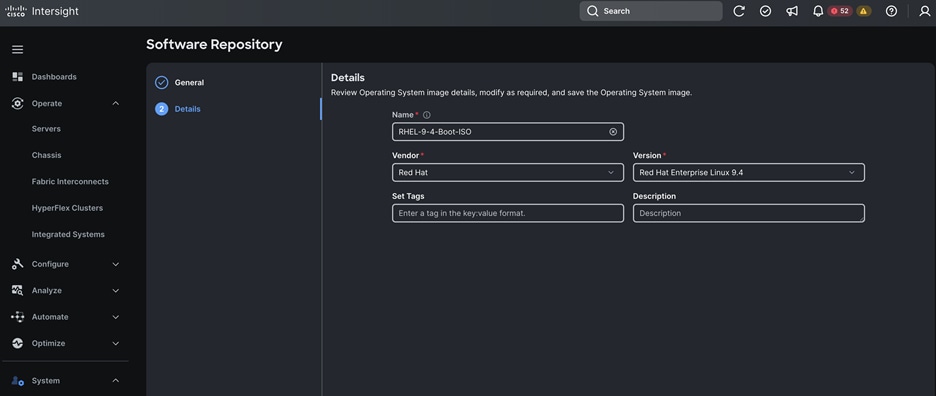
Note: The software repository can be CIFS, NFS, or HTTPS and need not be publicly available. It should be accessible by Cisco IMC. Cisco IMC establishes vMedia connection with the software repository hosted ISO images. It is then mounted as Cisco IMC-managed vMedia files and booted to the server. For more information, see: https://intersight.com/help/saas/resources/adding_OSimage#about_this_task
Procedure 2. Add Server Configuration Utility Image
Step 1. Log into Intersight Account.
Step 2. Go to Systems > Software Repository > SCU Links tab and click Add SCU Link as shown below:
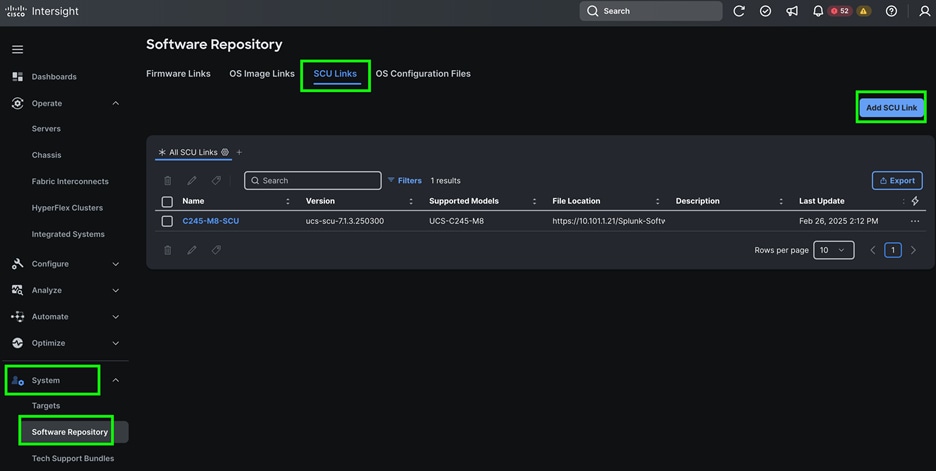
Note: For this solution, we used HTTPS server and provided access of SCU ISO as configured below:
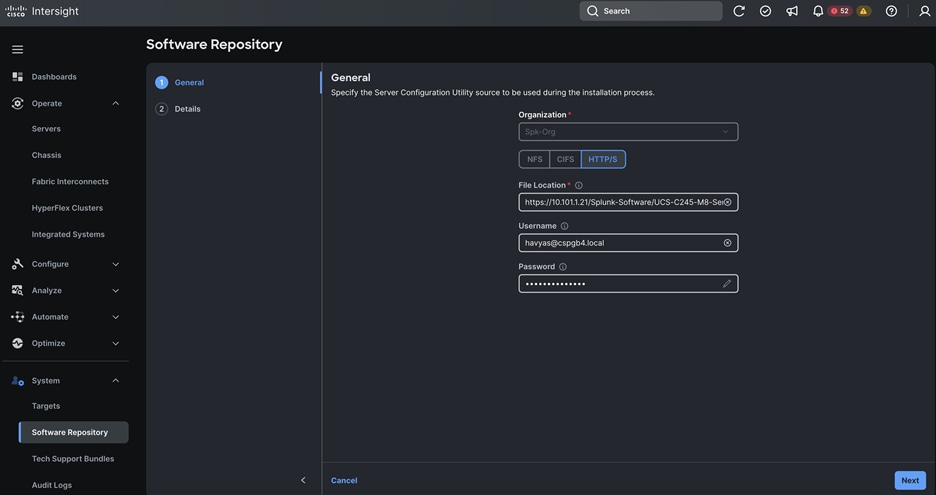
Step 3. Review the Server Configuration Utility image details, modify as required, and save the Server Configuration Utility image.
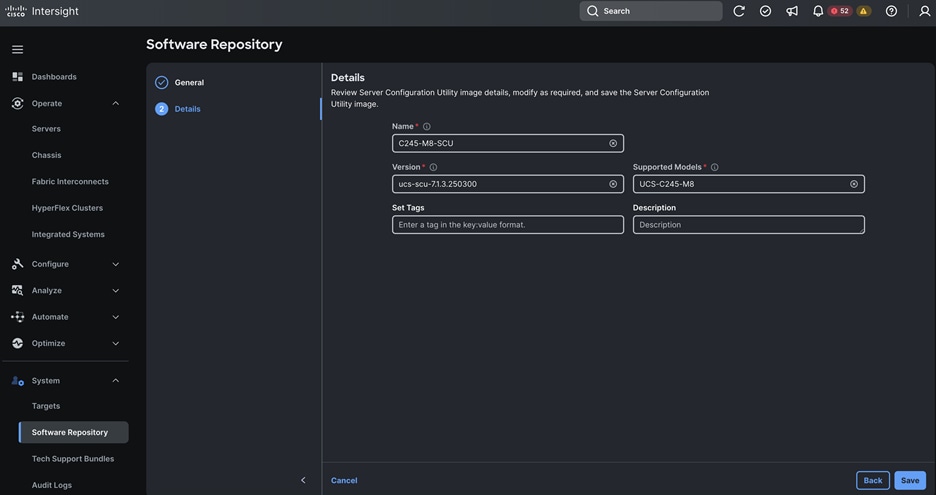
Procedure 3. Install the Operating System
Step 1. Log into Intersight Account.
Step 2. Go to Operate > Servers > and then select all the servers.
Step 3. Click the ellipses and select Install Operating System as shown below:
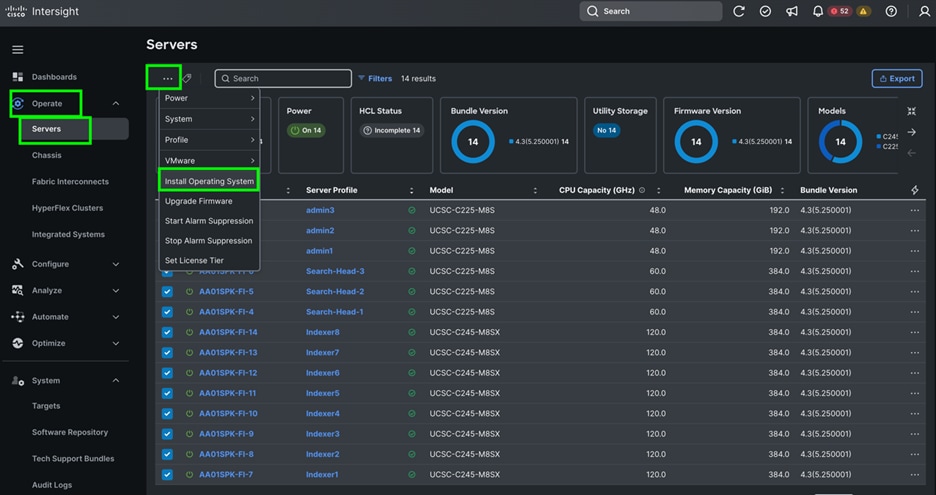
Step 4. From the Install Operating System menu, make sure all the servers are selected and click Next.
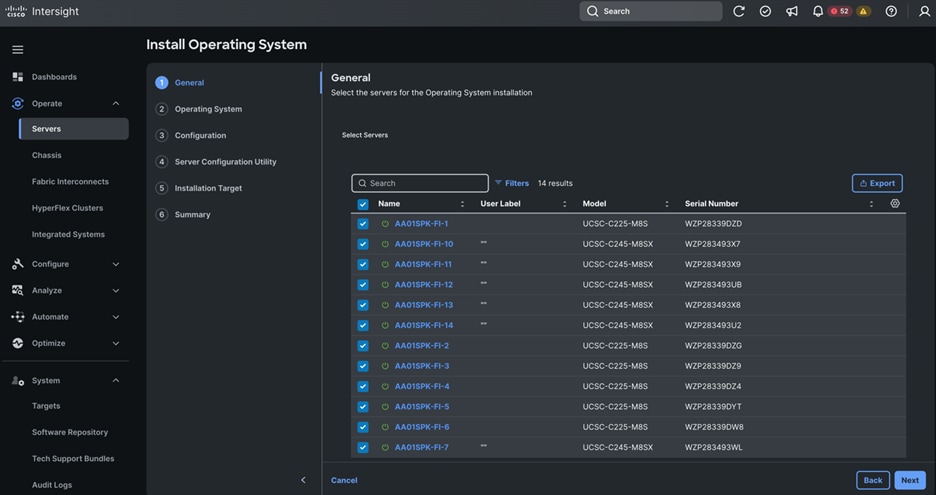
Step 5. Select the OS Image Link previously configured.
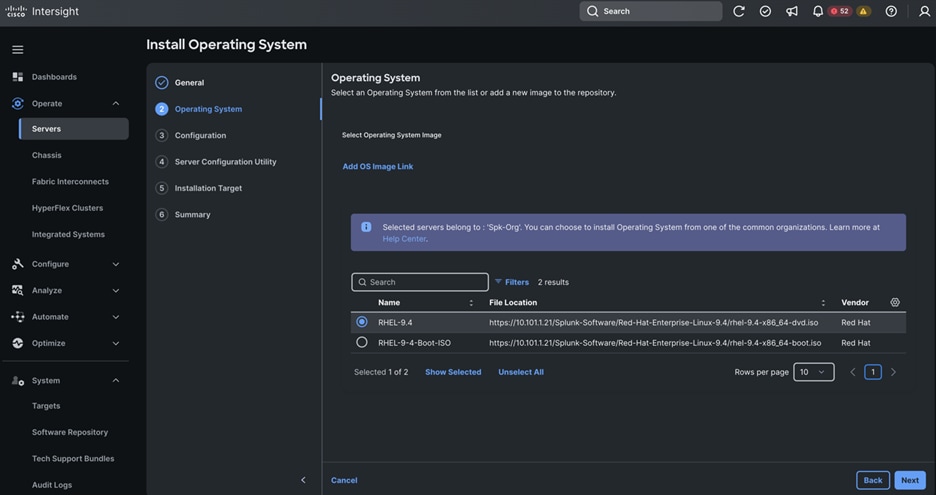
Step 6. From the Configuration menu, select the configuration sources. We used the default Cisco option and default RHEL9ConfigFile as shown below:
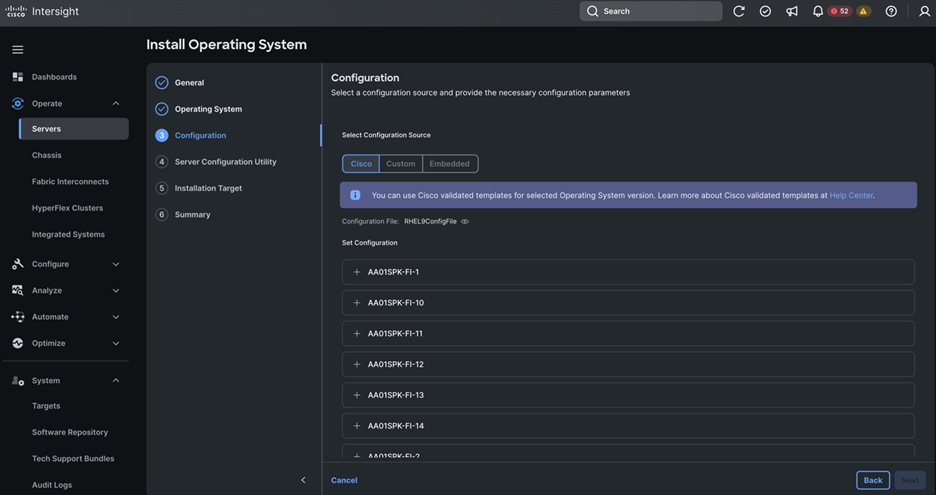
Note: You can either use custom or Cisco validated templates for selected Operating System version. For more information about Cisco validated templates, go to: https://us-east-1.intersight.com/help/saas/resources/installing_an_operating_system#performing_os_installation_in_cisco_mode
Step 7. From the Configuration menu, provide the details for each of the RHEL hosts with the appropriate IP Address, Netmask, Gateway, Preferred Name Server, Hostname, and password then click Next.
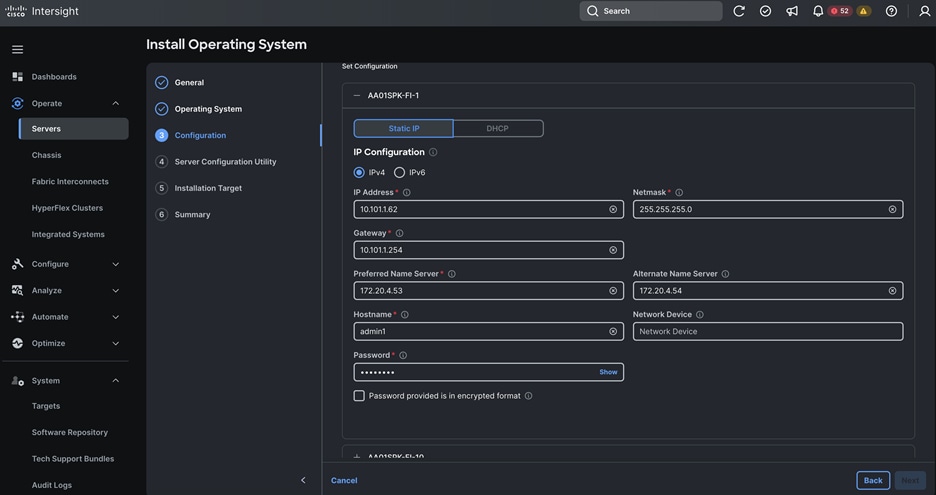
Step 8. From the Server Configuration Utility menu, select the SCU Link previously configured as shown below:
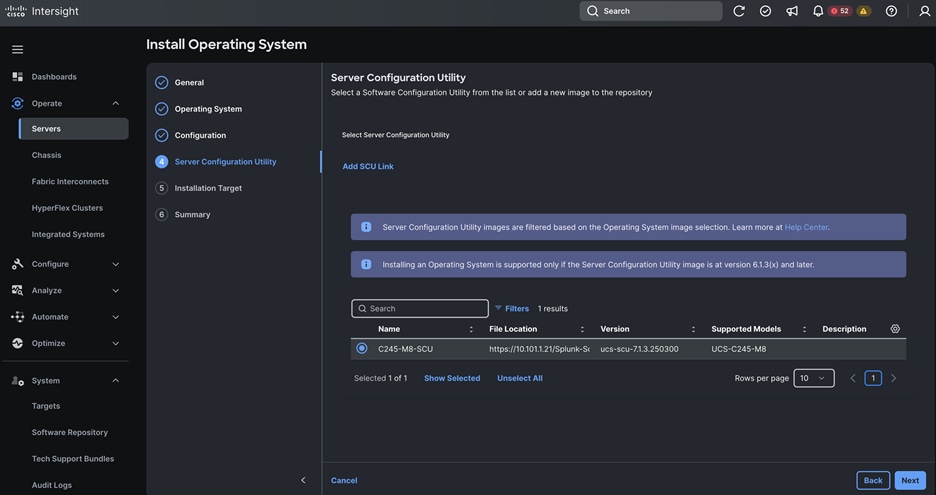
Step 9. From the Installation Target menu, select M.2 for the Installation target. When you select the M.2 option, all the servers will automatically detect the Boot Drive previously configured into the UCS Boot drive setup.
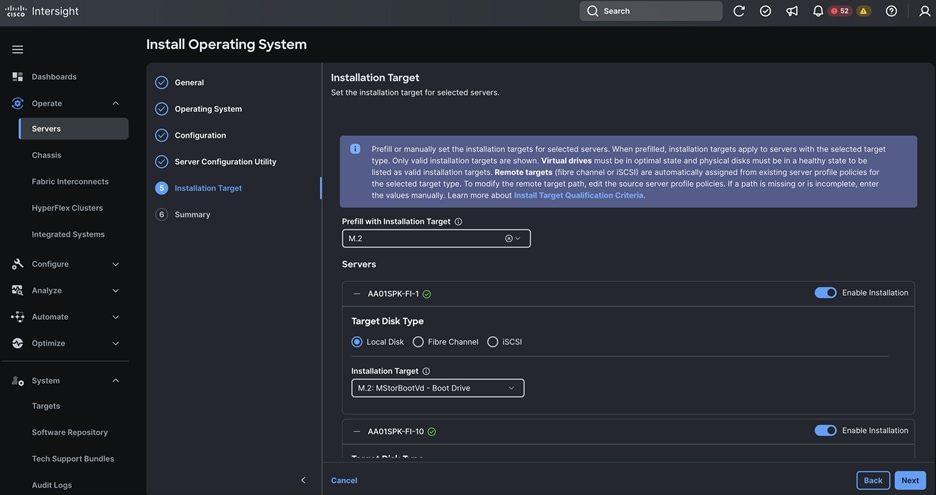
Step 10. Click Next and from the Summary menu, verify the details of your selections, make changes where required, and click Install to install the Operating System.
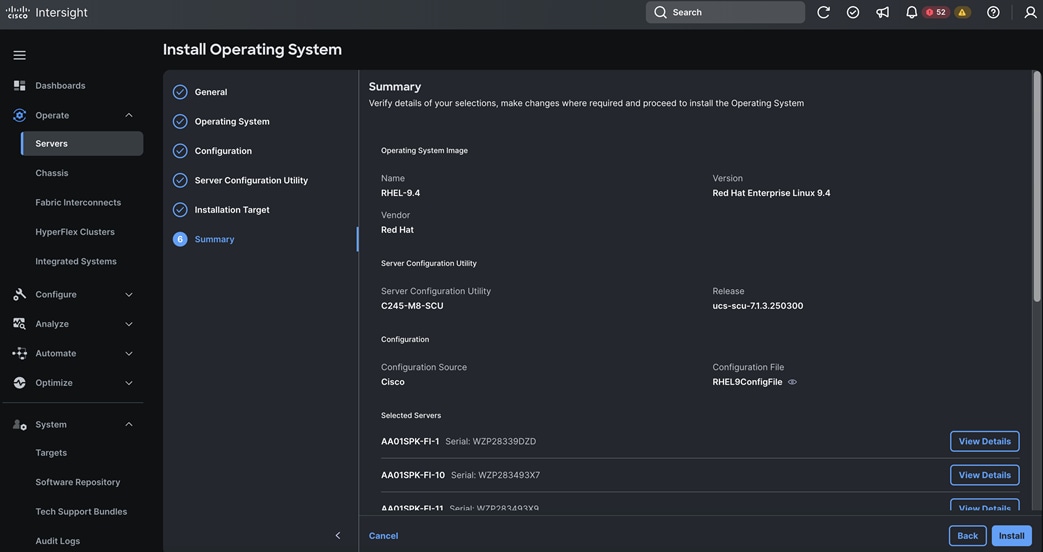
Step 11. To check the status of the task, click Request then click the individual task to see the execution flow as shown below:
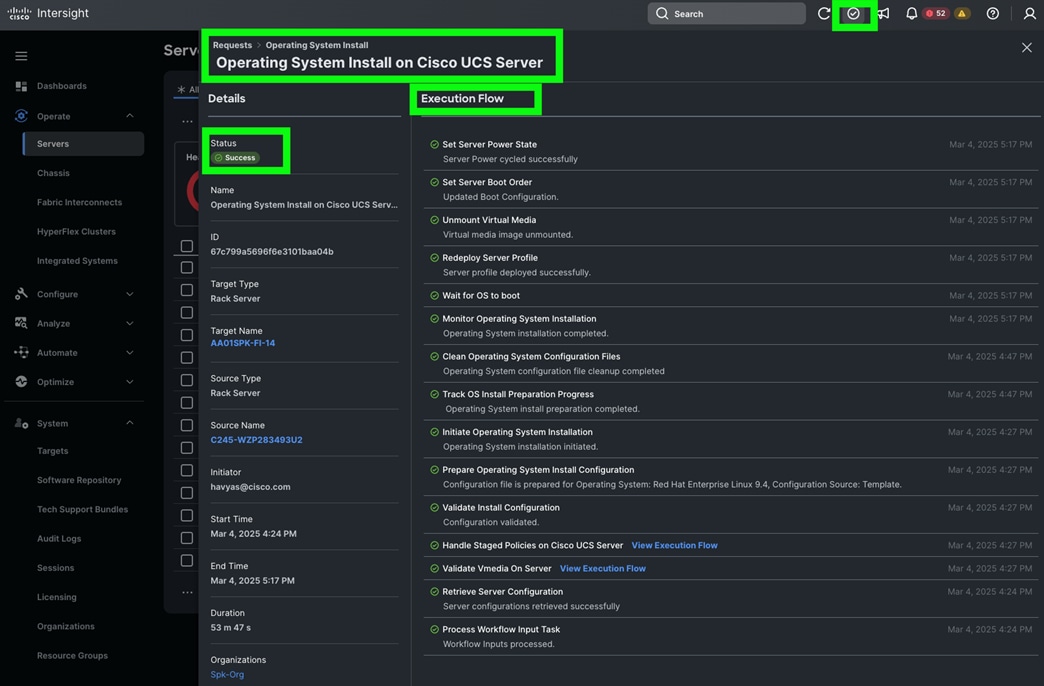
Step 12. After the OS installation finishes, reboot the server, and complete the appropriate registration steps.
Procedure 4. (Optional) Manual Operating System Install
Note: This optional Manual installation of the OS can be performed through the virtual KVM console.
Step 1. Download the Red Hat Enterprise Linux 9.4 OS image and save the IOS file to local disk.
Step 2. Launch the vKVM console on your server by going to Cisco Intersight > Operate > Servers > click one of the server node and then from the Actions drop-down list select Launch vKVM.
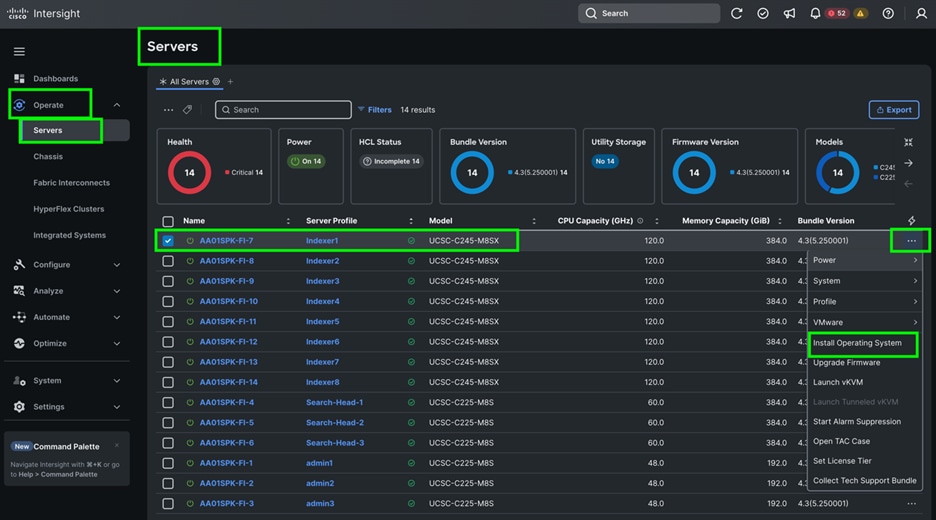
Step 3. Click Accept security and open KVM. Click Virtual Media > vKVM-Mapped vDVD. Click Browse and map the RHEL ISO image, click Open and then click Map Drive. After mapping the iso file, click Power > Power Cycle System to reboot the server.
Step 4. During the server boot order, it detects the virtual media connected as RHEL ISO DVD media and it will launch the RHEL OS installer.
Step 5. Select language and for the Installation destination assign the local virtual drive. Apply the hostname and click Configure Network to configure any or all the network interfaces. Alternatively, you can configure only the “Public Network” in this step. You can configure additional interfaces as part of post OS install steps.
Note: For an additional RPM package, we recommend selecting the “Customize Now” option and the relevant packages according to your environment.
Step 6. After the OS installation finishes, reboot the server, and complete the appropriate registration steps.
Step 7. Repeat steps 1 – 6 on all server nodes and install RHEL 9.4 on all of the server nodes.
This section contains the following procedures:
Procedure 1. Configure /etc/hosts
Procedure 2. Set up Passwordless Login
Procedure 3. Create a Red Hat Enterprise Linux 9.4 Local Repository
Procedure 4. Create the Red Hat Repository Database
Procedure 7. Set up All Nodes to use the RHEL Repository
Procedure 8. Disable the Linux Firewall
Procedure 10. Upgrade Cisco UCS VIC Driver for Cisco UCS VIC
Procedure 11. Configure Chrony
Procedure 15. Disable Swapping
Procedure 16. Disable IPv6 Defaults
Procedure 17. Disable Transparent Huge Pages
Procedure 18. Configure File System for all Linux Server Nodes
Procedure 19. Set up ClusterShell
Choose one of the admin node of the cluster for management, such as installation, Ansible, creating a local Red Hat repo, and others.
Note: In this document, we configured “admin1” for this purpose.
Procedure 1. Configure /etc/hosts
Step 1. Log into the admin node (admin1) and setup /etc/hosts.
Note: For the purpose of simplicity, the /etc/hosts file is configured with hostnames in all the nodes. However, in large scale production grade deployment, DNS server setup is highly recommended.
Step 2. Populate the host file with IP addresses and corresponding hostnames on the admin node (admin1) and other nodes as follows:
# ssh 10.101.1.62
[root@admin1 ~]# cat /etc/hosts
127.0.0.1 localhost localhost.localdomain localhost4 localhost4.localdomain4
::1 localhost localhost.localdomain localhost6 localhost6.localdomain6
### Indexer Hosts ###
10.101.1.51 indx1 indx1.ciscoucs.com
10.101.1.52 indx2 indx2.ciscoucs.com
10.101.1.53 indx3 indx3.ciscoucs.com
10.101.1.54 indx4 indx4.ciscoucs.com
10.101.1.55 indx5 indx5.ciscoucs.com
10.101.1.56 indx6 indx6.ciscoucs.com
10.101.1.57 indx7 indx7.ciscoucs.com
10.101.1.58 indx8 indx8.ciscoucs.com
192.168.1.51 indx1-rep indx1-rep.ciscoucs.com
192.168.1.52 indx2-rep indx2-rep.ciscoucs.com
192.168.1.53 indx3-rep indx3-rep.ciscoucs.com
192.168.1.54 indx4-rep indx4-rep.ciscoucs.com
192.168.1.55 indx5-rep indx5-rep.ciscoucs.com
192.168.1.56 indx6-rep indx6-rep.ciscoucs.com
192.168.1.57 indx7-rep indx7-rep.ciscoucs.com
192.168.1.58 indx8-rep indx8-rep.ciscoucs.com
### Search Head Hosts ###
10.101.1.59 sh1 sh1.ciscoucs.com
10.101.1.60 sh2 sh2.ciscoucs.com
10.101.1.61 sh3 sh3.ciscoucs.com
192.168.1.59 sh1-rep sh1-rep.ciscoucs.com
192.168.1.60 sh2-rep sh2-rep.ciscoucs.com
192.168.1.61 sh3-rep sh3-rep.ciscoucs.com
### Admin Hosts ###
10.101.1.62 admin1 admin1.ciscoucs.com
10.101.1.63 admin2 admin2.ciscoucs.com
10.101.1.64 admin3 admin3.ciscoucs.com
192.168.1.62 admin1-rep admin1-rep.ciscoucs.com
192.168.1.63 admin2-rep admin2-rep.ciscoucs.com
192.168.1.64 admin3-rep admin3-rep.ciscoucs.com
Procedure 2. Set up Passwordless Login
To manage all the nodes in a cluster from the admin node, passwordless login needs to be setup. It assists in automating common tasks with Ansible, and shell-scripts without having to use passwords.
Enable the passwordless login across all the nodes when Red Hat Linux is installed across all the nodes in the cluster.
Step 1. Log into the Admin Node:
# ssh 10.101.1.62
Step 2. Run the ssh-keygen command to create both public and private keys on the admin node:
# ssh-keygen -N '' -f ~/.ssh/id_rsa
Step 3. Run the following command from the admin node to copy the public key id_rsa.pub to all the nodes of the cluster. ssh-copy-id appends the keys to the remote-hosts .ssh/authorized_keys:
for host in admin1 admin2 admin3 indx1 indx2 indx3 indx4 indx5 indx6 indx7 indx8 sh1 sh2 sh3; do echo -n "$host -> "; ssh-copy-id -i ~/.ssh/id_rsa.pub $host; done;
Step 4. Enter yes for Are you sure you want to continue connecting (yes/no)?
Step 5. Enter the password of the remote host.
Step 6. Enable RHEL subscription and install EPEL:
# sudo subscription-manager register –username <password> --password <password> --auto-attach
# sudo subscription-manager repos --enable codeready-builder-for-rhel-9-$(arch)-rpms
# sudo dnf install https://dl.fedoraproject.org/pub/epel/epel-release-latest-9.noarch.rpm -y
Note: The admin node’s /etc/hosts should be copied over to all 13 other servers by using Ansible after it is installed.
Procedure 3. Create a Red Hat Enterprise Linux 9.4 Local Repository
To create a repository using RHEL DVD or ISO on the admin node, create a directory with all the required RPMs, run the createrepo command and then publish the resulting repository.
Note: Based on this repository file, yum requires httpd to be running on admin1 for other nodes to access the repository.
Note: This step is required to install software on admin node (admin1) using the repo (such as httpd, create-repo, and so on.)
Step 1. Log into admin1:
# ssh 10.101.1.62
Step 2. Copy RHEL 9.4 iso from remote repository:
# scp rhel-baseos-9.4-x86_64-dvd.iso admin1:/root/
Step 3. Create a directory that would contain the repository:
# mkdir -p /var/www/html/rhelrepo
Step 4. Create mount point to mount RHEL ISO:
# mkdir -p /mnt/rheliso
# mount -t iso9660 -o loop /root/rhel-baseos-9.4-x86_64-dvd.iso /mnt/rheliso/
Step 5. Copy the contents of the RHEL 9.4 ISO to /var/www/html/rhelrepo:
# cp -r /mnt/rheliso/* /var/www/html/rhelrepo
Step 6. Create a .repo file to enable the use of the yum command on admin1:
# vi /var/www/html/rhelrepo/rheliso.repo
[rhel9.4]
name= Red Hat Enterprise Linux 9.4
baseurl=http://10.101.1.62/rhelrepo/BaseOS/
gpgcheck=0
enabled=1
Step 7. Copy the rheliso.repo file from /var/www/html/rhelrepo to /etc/yum.repos.d” on admin1:
# cp /var/www/html/rhelrepo/rheliso.repo /etc/yum.repos.d/
Note: Based on this repo file, yum required httpd to be running on admin1 for other nodes to access the repository.
Step 8. To make use of repository files on admin1 without httpd, edit the baseurl of repo file /etc/yum.repos.d/rheliso.repo to point repository location in the file system:
# vi /etc/yum.repos.d/rheliso.repo
[rhel9.4]
name=Red Hat Enterprise Linux 9.4
baseurl=file:///var/www/html/rhelrepo/BaseOS/
gpgcheck=0
enabled=1
Procedure 4. Create the Red Hat Repository Database
Step 1. Install the createrepo package on admin node (admin1). Use it to regenerate the repository database(s) for the local copy of the RHEL DVD contents:
# dnf install -y createrepo
Step 2. Run createrepo on the RHEL repository to create the repo database on admin node:
# cd /var/www/html/rhelrepo/BaseOS/
# createrepo
Step 1. Install ansible-core:
# dnf install -y ansible-core ansible
[root@admin1 ~]# ansible --version
ansible [core 2.14.17]
config file = /etc/ansible/ansible.cfg
configured module search path = ['/root/.ansible/plugins/modules', '/usr/share/ansible/plugins/modules']
ansible python module location = /usr/lib/python3.9/site-packages/ansible
ansible collection location = /root/.ansible/collections:/usr/share/ansible/collections
executable location = /usr/bin/ansible
python version = 3.9.18 (main, Jan 24 2024, 00:00:00) [GCC 11.4.1 20231218 (Red Hat 11.4.1-3)] (/usr/bin/python3)
jinja version = 3.1.2
libyaml = True
Step 2. Prepare the host inventory file for Ansible as shown below. Various host groups have been created based on any specific installation requirements of certain hosts:
[root@admin1 ~]# cat /etc/ansible/hosts
[admin]
admin1
[adminnodes]
admin1
admin2
admin3
[indxnodes]
indx1
indx2
indx3
indx4
indx5
indx6
indx7
indx8
[shnodes]
sh1
sh2
sh3
[nodes]
admin1
admin2
admin3
indx1
indx2
indx3
indx4
indx5
indx6
indx7
indx8
sh1
sh2
sh3
Step 3. Verify host group by running the following commands:
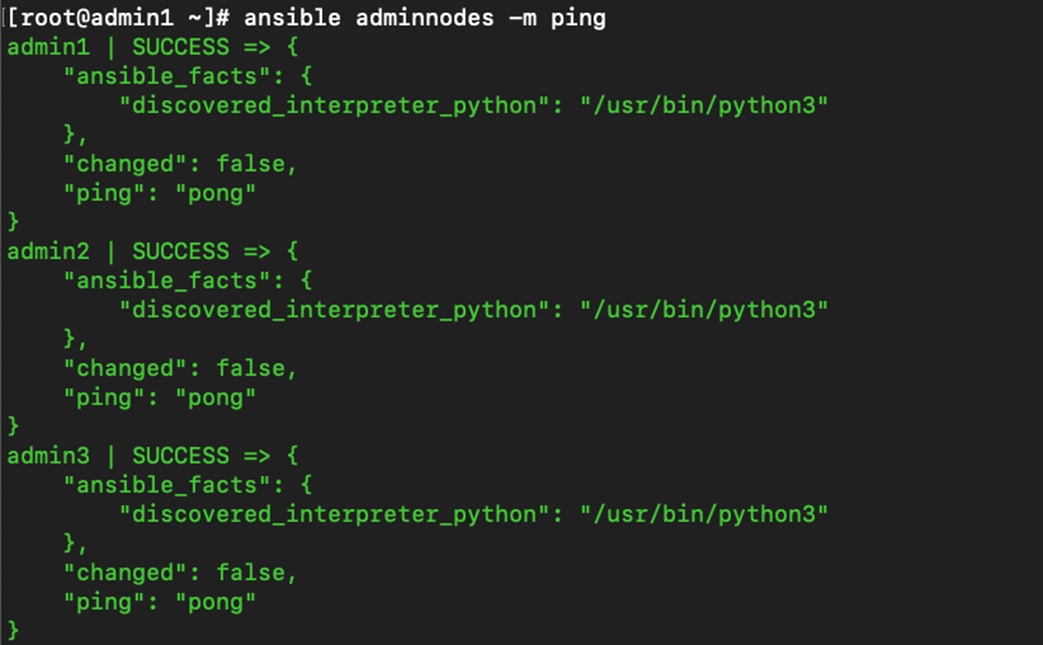
Step 4. Check all the cluster nodes as shown below:
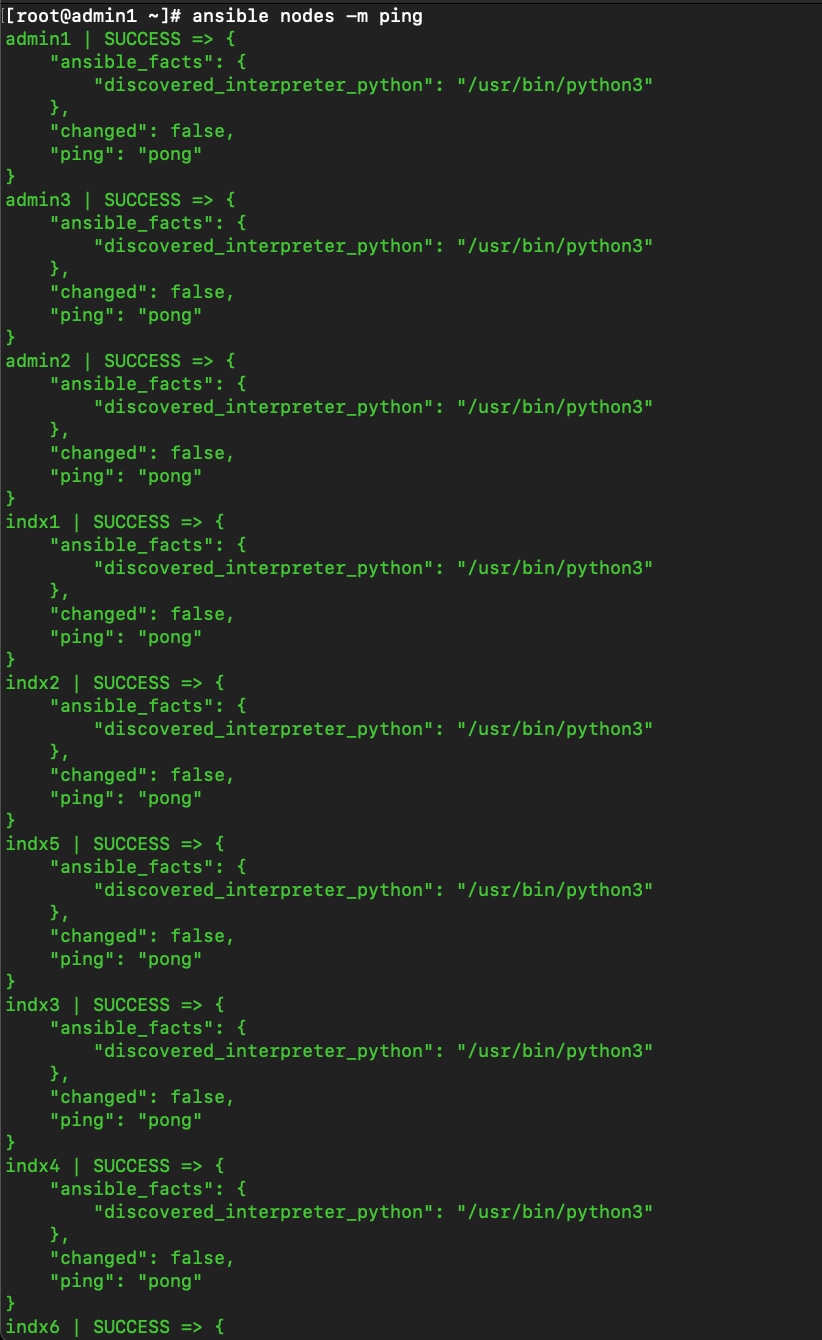
Step 5. Copy “/etc/hosts file” to each of the cluster nodes as a part of the Splunk cluster deployment to resolve fqdn across the cluster:
# ansible nodes -m copy -a "src=/etc/hosts dest=/etc/hosts"
Setting up the RHEL repository on the admin node requires httpd.
Step 1. Install httpd on the admin node to host repositories:
Note: The Red Hat repository is hosted using HTTP on the admin node; this machine is accessible by all the hosts in the cluster.
# dnf install -y httpd mod_ssl
Step 2. Generate the CA certificate:
# openssl req -newkey rsa:2048 -nodes -keyout /etc/pki/tls/private/httpd.key -x509 -days 3650 -out /etc/pki/tls/certs/httpd.crt
You are about to be asked to enter information that will be incorporated
into your certificate request.
What you are about to enter is what is called a Distinguished Name or a DN.
There are quite a few fields but you can leave some blank
For some fields there will be a default value,
If you enter '.', the field will be left blank.
-----
Country Name (2 letter code) [XX]:US
State or Province Name (full name) []:California
Locality Name (eg, city) [Default City]:San Jose
Organization Name (eg, company) [Default Company Ltd]:Cisco Systems Inc
Organizational Unit Name (eg, section) []:UCS-Splunk
Common Name (eg, your name or your server's hostname) []:admin1.cisco.local
Email Address []:
# ls -l /etc/pki/tls/private/ /etc/pki/tls/certs/
/etc/pki/tls/certs/:
total 8
lrwxrwxrwx. 1 root root 49 Jan 21 2025 ca-bundle.crt -> /etc/pki/ca-trust/extracted/pem/tls-ca-bundle.pem
lrwxrwxrwx. 1 root root 55 Jan 21 2025 ca-bundle.trust.crt -> /etc/pki/ca-trust/extracted/openssl/ca-bundle.trust.crt
-rw-r--r--. 1 root root 1432 Dec 4 12:34 httpd.crt
-rw-r--r--. 1 root root 2260 Dec 1 11:36 postfix.pem
/etc/pki/tls/private/:
total 8
-rw-------. 1 root root 1700 Dec 4 12:34 httpd.key
-rw-------. 1 root root 3268 Dec 1 11:36 postfix.key
Step 3. Create the certificate directory to server content from:
# mkdir -p /var/www/https/
# echo secure content > /var/www/https/index.html
[root@admin1 ~]# cat /var/www/https/index.html
secure content
Step 4. Edit “httpd.conf” file; add “ServerName” and make the necessary changes to the server configuration file:
# vi /etc/httpd/conf/httpd.conf
ServerName admin1.cisco.local:80
Step 5. Start httpd service:
# systemctl start httpd
# systemctl enable httpd
# chkconfig httpd on
Procedure 7. Set up All Nodes to use the RHEL Repository
Step 1. Copy the “rheliso.repo” to all the nodes of the cluster:
# ansible nodes -m copy -a "src=/var/www/html/rhelrepo/rheliso.repo dest=/etc/yum.repos.d/."
Step 2. Copy the “/etc/hosts” file to all nodes:
# ansible nodes -m copy -a "src=/etc/hosts dest=/etc/hosts"
Step 3. Purge the yum caches:
# ansible nodes -a "dnf clean all"
# ansible nodes -a "dnf repolist"
Note: While the suggested configuration is to disable SELinux as shown below, if for any reason SELinux needs to be enabled on the cluster, run the following command to make sure that the httpd can read the Yum repofiles.
#chcon -R -t httpd_sys_content_t /var/www/html/
Procedure 8. Disable the Linux Firewall
Note: The default Linux firewall settings are too restrictive for any application deployment. Since the Cisco Splunk deployment will be in its own isolated network there is no need for that additional firewall.
Step 1. Run the following commands to disable the Linux firewall:
# ansible all -m command -a "firewall-cmd --zone=public --add-port=80/tcp --permanent"
# ansible all -m command -a "firewall-cmd --zone=public --add-port=443/tcp --permanent"
# ansible all -m command -a "firewall-cmd --reload"
# ansible all -m command -a "systemctl stop firewalld"
# ansible all -m command -a " systemctl disable firewalld"
Note: SELinux must be disabled during the install procedure and cluster setup. SELinux can be enabled after installation and while the cluster is running.
Step 1. SELinux can be disabled by editing /etc/selinux/config and changing the SELINUX line to SELINUX=disabled. To disable SELinux, run the following commands:
# ansible nodes -m shell -a "sed –i 's/SELINUX=enforcing/SELINUX=disabled/g' /etc/selinux/config"
# ansible nodes -m shell -a "setenforce 0"
Note: This command may fail if SELinux is already disabled. This requires reboot to take effect.
Step 2. Reboot the machine, if needed for SELinux to be disabled in case it does not take effect. It can be checked using the following command:
# ansible nodes -a "sestatus"
Procedure 10. Upgrade Cisco UCS VIC Driver for Cisco UCS VIC
The latest Cisco Network driver is required for performance and updates. The latest drivers can be downloaded from here: https://software.cisco.com/download/home/283862063/type/283853158/release/4.3(5e)
In the ISO image, the required driver can be located here: “\Network\Cisco\VIC\RHEL\RHEL9.4\kmod-enic-4.8.0.0-1128.4.rhel9u4_5.14.0_427.13.1.x86_64.rpm”
Step 1. From a node connected to the Internet, download, extract, and transfer “kmod-enic-*.rpm to admin1 (admin node).
Step 2. Copy the rpm on all nodes of the cluster using the following Ansible commands. For this example, the rpm is assumed to be in present working directory of admin1:
# ansible all -m copy -a "src=/root/kmod-enic-4.8.0.0-1128.4.rhel9u4_5.14.0_427.13.1.x86_64.rpm dest=/root/."
Step 3. Use the yum module to install the “enic” driver rpm file on all the nodes through Ansible:
# ansible all -m shell -a "rpm -ivh =/root/kmod-enic-4.8.0.0-1128.4.rhel9u4_5.14.0_427.13.1.x86_64.rpm"
Step 4. Make sure that the above installed version of “kmod-enic” driver is being used on all nodes by running the command "modinfo enic" on all nodes:
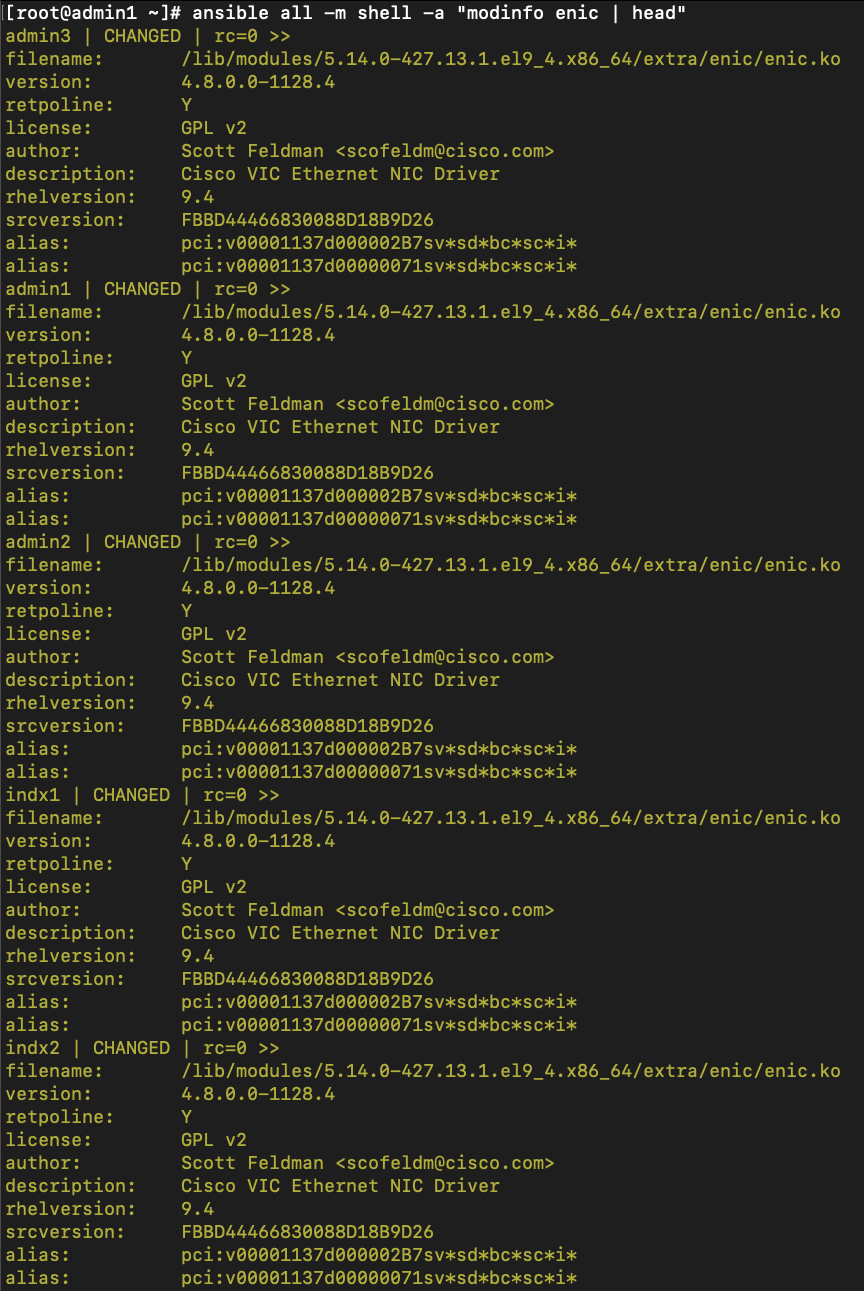
Procedure 11. Configure Chrony
Step 1. edit “/etc/chrony.conf” file:
# vi /etc/chrony.conf
pool <ntpserver> iburst
driftfile /var/lib/chrony/drift
makestep 1.0 3
rtcsync
#(optional) edit on ntpserver allow 10.29.134.0/24
local stratum 10 # local stratum 8 on ntpserver
keyfile /etc/chrony.keys
leapsectz right/UTC
logdir /var/log/chrony
Step 2. Copy “chrony.confg” file from the admin node to the “/etc/” of all nodes by running command below:
# ansible nodes -m copy -a "src=/etc/chrony.conf dest=/etc/chrony.conf"
Step 3. Start Chrony service:
# ansible nodes -m shell -a "timedatectl set-timezone America/Los_Angeles"
# ansible nodes -m shell -a "systemctl start chronyd"
# ansible nodes -m shell -a "systemctl enable chronyd"
# ansible nodes -m shell -a "hwclock --systohc"
Syslog must be enabled on each node to preserve logs regarding killed processes or failed jobs. Modern versions such as “syslog-ng” and “rsyslog” are possible, making it more difficult to be sure that a syslog daemon is present.
Step 1. Use one of the following commands to confirm that the service is properly configured:
# ansible all -m command -a "rsyslogd -v"
# ansible all -m command -a "service rsyslog status"
On each node, “ulimit -n” specifies the number of i-nodes that can be opened simultaneously. With the default value of 1024, the system appears to be out of disk space and shows no i-nodes available. This value should be set to 64000 on every node for user root and splunk.
Note: When the Splunk enterprise software is installed, a service user account by name “splunk” gets created automatically. Since all Splunk related operations are performed as user “splunk,” its ulimits need to be increased as well. Higher values are unlikely to result in an appreciable performance gain.
Step 1. For setting the “ulimit” on Red Hat, edit “/etc/security/limits.conf” on admin node admin1 and add the following lines:
# vi /etc/security/limits.conf
splunk hard nofile 64000
splunk soft nofile 64000
splunk hard nproc 16000
splunk soft nproc 16000
splunk hard fsize unlimited
splunk soft fsize unlimited
or for all users (not recommended for production Splunk environments, but possible for testing):
* hard nofile 64000
* soft nofile 64000
* hard nproc 16000
* soft nproc 16000
* hard fsize unlimited
* soft fsize unlimited
Note: For RHEL 9.4: nproc: On recent RHEL versions, nproc should be set in “/etc/security/limits.d/90-nproc.conf” rather than directly in “limits.conf” for non-root users.
Note: For systemd: If Splunk is run as a systemd service (the default on RHEL 9+), you must also set limits in a systemd drop-in file (e.g., /etc/systemd/system/Splunkd.service.d/limits.conf). Run the following commands:
[Service]
LimitNOFILE=64000
LimitNPROC=16000
LimitFSIZE=infinity
Step 2. Copy the “/etc/security/limits.conf” file from admin node (admin1) to all the nodes using the following command:
# ansible nodes -m copy -a "src=/etc/security/limits.conf dest=/etc/security/limits.conf"
Step 3. Make sure that the “/etc/pam.d/su” file contains the following settings:
[root@admin1 ~]# cat /etc/pam.d/su
#%PAM-1.0
auth required pam_env.so
auth sufficient pam_rootok.so
# Uncomment the following line to implicitly trust users in the "wheel" group.
#auth sufficient pam_wheel.so trust use_uid
# Uncomment the following line to require a user to be in the "wheel" group.
#auth required pam_wheel.so use_uid
auth include system-auth
auth include postlogin
account sufficient pam_succeed_if.so uid = 0 use_uid quiet
account include system-auth
password include system-auth
session include system-auth
session include postlogin
session optional pam_xauth.so
Step 4. Copy the “/etc/pam.d/su” file from admin node (admin1) to all the nodes using the following command:
# ansible nodes -m copy -a "src=/etc/pam.d/su dest=/etc/pam.d/su"
Note: The “ulimit” values are applied on a new shell, running the command on a node on an earlier instance of a shell will show old values.
Note: Splunk requires high file descriptor limits (nofile) and process limits (nproc) for stable operation. PAM must load pam_limits.so during the session setup to enforce these limits when users switch or start services. Without this line in “/etc/pam.d/su,” limits may not be applied when using “su” or starting splunk under a non-root user. Please ensures Splunk on RHEL 9.4 inherits the configured “ulimit” settings correctly when switching users or starting the service according to your environments.
Adjusting the “tcp_retries” parameter for the system network enables faster detection of failed nodes. Given the advanced networking features of UCS, this is a safe and recommended change (failures observed at the operating system layer are most likely serious rather than transitory).
Note: On each node, set the number of TCP retries to 5 can help detect unreachable nodes with less latency.
Step 1. Edit the file “/etc/sysctl.conf” and on admin node admin1 and add the following lines:
# net.ipv4.tcp_retries2=5
Step 2. Copy the “/etc/sysctl.conf” file from admin node to all the nodes using the following command:
# ansible nodes -m copy -a "src=/etc/sysctl.conf dest=/etc/sysctl.conf"
Step 3. Load the settings from default sysctl file “/etc/sysctl.conf” by running the following command:
# ansible nodes -m command -a "sysctl -p"Start and enable xinetd, dhcp and vsftpd service.
Procedure 15. Disable Swapping
Splunk is memory-intensive and expects fast access to data. Swapping slows down operations dramatically. If Splunk starts using swap, it can get stuck in a loop where it’s constantly waiting for memory to be paged in and out, leading to crashes or severe slowdowns.
Step 1. Run the following on all nodes:
# ansible all -m shell -a "echo 'vm.swappiness=1' >> /etc/sysctl.conf"
Step 2. Load the settings from default sysctl file “/etc/sysctl.conf” and verify the content of “sysctl.conf”:
# ansible all -m shell -a "sysctl –p"
# ansible all -m shell -a "cat /etc/sysctl.conf"
Procedure 16. Disable IPv6 Defaults
Step 1. Run the following command:
# ansible all -m shell -a "echo 'net.ipv6.conf.all.disable_ipv6 = 1' >> /etc/sysctl.conf"
# ansible all -m shell -a "echo 'net.ipv6.conf.default.disable_ipv6 = 1' >> /etc/sysctl.conf"
# ansible all -m shell -a "echo 'net.ipv6.conf.lo.disable_ipv6 = 1' >> /etc/sysctl.conf"
Step 2. Load the settings from default sysctl file “/etc/sysctl.conf”:
# ansible all -m shell -a "sysctl –p"
Procedure 17. Disable Transparent Huge Pages
Splunk has observed at least a 20-30 percent degradation in indexing and search performance when THP is enabled, with a similar increase in latency. THP can interfere with Splunk’s memory allocator, preventing memory from being released back to the OS, and can cause I/O regressions related to swapping. Disabling Transparent Huge Pages (THP) reduces elevated CPU usage caused by THP.
Step 1. You must run the following commands for every reboot; copy this command to “/etc/rc.local” so they are executed automatically for every reboot:
# ansible all -m shell -a "echo never > /sys/kernel/mm/transparent_hugepage/enabled"
# ansible all -m shell -a "echo never > /sys/kernel/mm/transparent_hugepage/defrag"
Step 2. On the Admin node, run the following commands:
# rm –f /root/thp_disable
# echo "echo never > /sys/kernel/mm/transparent_hugepage/enabled" >> /root/thp_disable
# echo "echo never > /sys/kernel/mm/transparent_hugepage/defrag" >> /root/thp_disable
Step 3. Copy file to each node:
# ansible nodes -m copy -a "src=/root/thp_disable dest=/root/thp_disable"
Step 4. Append the content of file thp_disable to /etc/rc.d/rc.local:
# ansible nodes -m shell -a "cat /root/thp_disable >> /etc/rc.d/rc.local"
# ansible nodes -m shell -a "chmod +x /etc/rc.d/rc.local"
Procedure 18. Configure File System for all Linux Server Nodes
As previously documented in the UCS configuration steps, for this solution we configured and created local storage and RAID configuration on each of the indexer node as shown below:
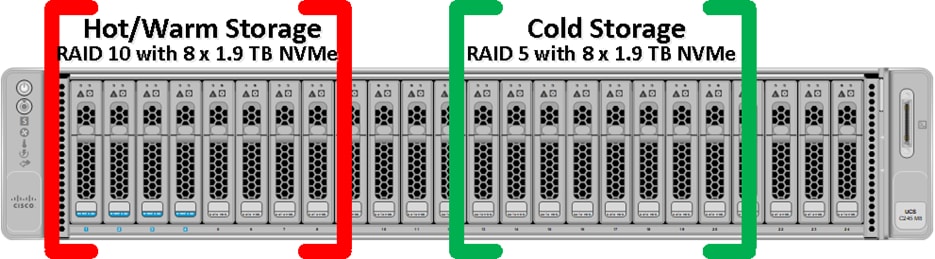
All the indexer Cisco UCS C245 M8 server nodes having 2 x Cisco Tri-Mode 24G SAS RAID controller and to take advantage of this RAID controllers for better read/write performance and even drive distribution, we spread 16 NVMe drives across two groups with each group having 8 drives for storage. First set of 8 NVMe drives were placed on RAID controller 1 (drive slot 1 to 8) as highlighted in red here and then RAID10 was configured for storing Hot/Warm local storage. Second set of 8 drives were distributed on RAID controller 2 (drive slot 13 to 20) as shown in green and then RAID5 was configured for storing Cold local storage. After installing OS, we used Linux “fdisk” utility and created partition. We then formatted these both partition as xfs format and created two mount point. “/data/disk1” was configured for storing Hot/Warm storage while “/data/disk2” was configured for storing Cold storage as shown below from one of the indexer nodes:
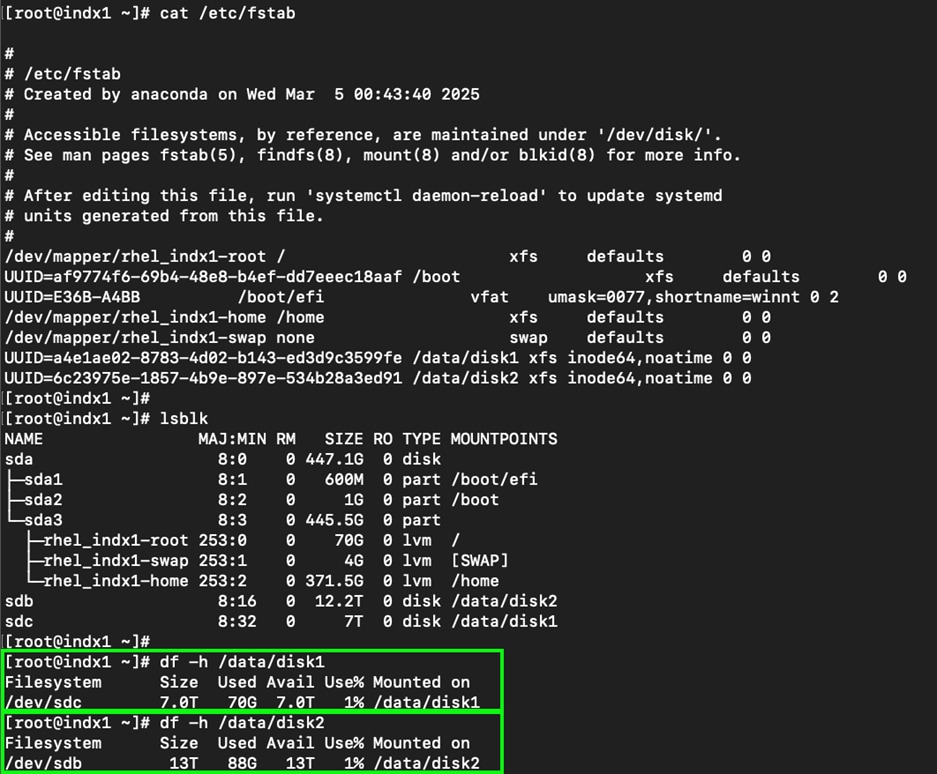
Procedure 19. Set up ClusterShell
ClusterShell (or clush) is a cluster-wide shell to run commands on several hosts in parallel. ClusterShell is available through the EPEL (Extra Packages for Enterprise Linux) repository, which is the recommended method for Red Hat system.
Step 1. Log into the Admin Node:
# ssh 10.101.1.62
Step 2. Enable the EPEL Repository:
# dnf install epel-release
Step 3. Install the clustershell package on admin node (admin1):
# dnf install clustershell
Step 4. Verify Installation:
# clush --version
Step 5. Edit “/etc/clustershell/groups.d/local.cfg” file to pre-define hostnames for all the nodes of the Splunk cluster. Also, create three special groups [admins/searchheads/indexers] besides the group that takes all the hosts of the cluster. These groups help target the cluster wide commands to a specific set of nodes grouped by their role in the Splunk deployment as shown below:
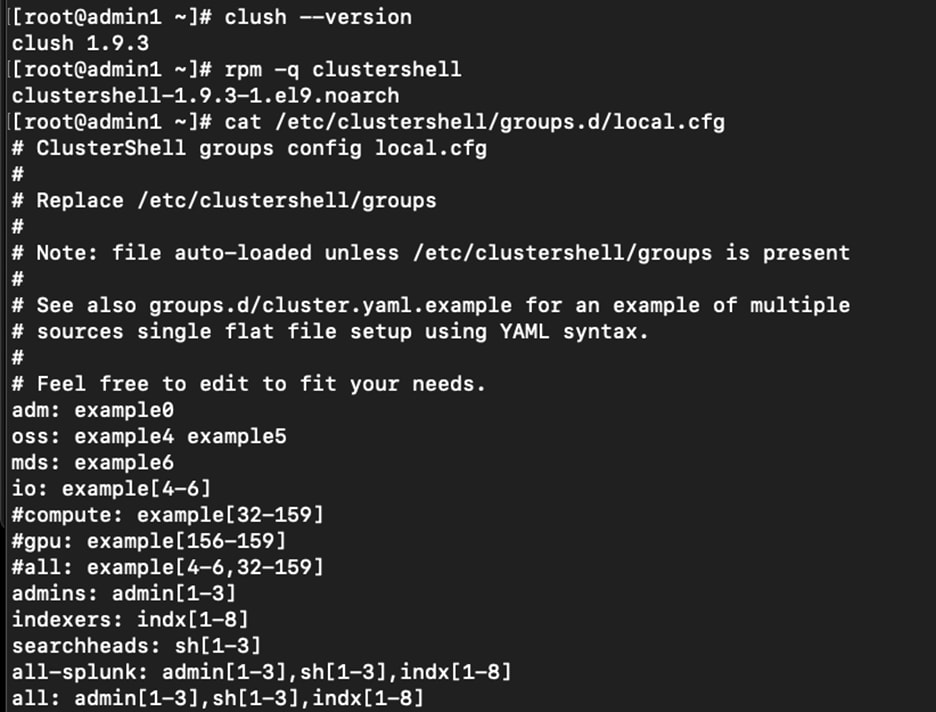
This procedure explains how to create the script “cluster_verification.sh” that helps to verify the CPU, memory, NIC, and storage adapter settings across the cluster on all nodes. This script also checks additional prerequisites such as NTP status, SELinux status, ulimit settings, IP address and hostname resolution, Linux version and firewall settings.
Note: The following script uses cluster shell (clush) which needs to be installed and configured.
Step 1. Create the cluster_verification.sh script as follows on the admin node (admi1):
vi cluster_verification.sh
#!/bin/bash
shopt -s expand_aliases
# Setting Color codes
green='\e[0;32m'
red='\e[0;31m'
NC='\e[0m' # No Color
echo -e "${green} === Cisco UCS Integrated Infrastructure for Big Data Cluster
Verification === ${NC}"
echo ""
echo ""
echo -e "${green} ==== System Information ==== ${NC}"
echo ""
echo ""
echo -e "${green}System ${NC}"
clush -a -B " `which dmidecode` |grep -A2 '^System Information'"
echo ""
echo ""
echo -e "${green}BIOS ${NC}"
clush -a -B " `which dmidecode` | grep -A3 '^BIOS I'"
echo ""
echo ""
echo -e "${green}Memory ${NC}"
clush -a -B "cat /proc/meminfo | grep -i ^memt | uniq"
echo ""
echo ""
echo -e "${green}Number of Dimms ${NC}"
clush -a -B "echo -n 'DIMM slots: '; `which dmidecode` |grep -c '^[[:space:]]*Locator:'"
clush -a -B "echo -n 'DIMM count is: '; `which dmidecode` | grep "Size"| grep -c "MB""
clush -a -B " `which dmidecode` | awk '/Memory Device$/,/^$/ {print}' | grep -e '^Mem' -e Size: -e Speed: -e Part | sort -u | grep -v -e 'NO DIMM' -e 'No
Module Installed' -e Unknown"
echo ""
echo ""
# probe for cpu info #
echo -e "${green}CPU ${NC}"
clush -a -B "grep '^model name' /proc/cpuinfo | sort -u"
echo ""
clush -a -B "`which lscpu` | grep -v -e op-mode -e ^Vendor -e family -e Model: -e Stepping: -e BogoMIPS -e Virtual -e ^Byte -e '^NUMA node(s)'"
echo ""
echo ""
# probe for nic info #
echo -e "${green}NIC ${NC}"
clush -a -B "`which ifconfig` | egrep '(^e|^p)' | awk '{print \$1}' | xargs -l `which ethtool` | grep -e ^Settings -e Speed"
echo ""
clush -a -B "`which lspci` | grep -i ether"
echo ""
echo ""
# probe for disk info #
echo -e "${green}Storage ${NC}"
clush -a -B "echo 'Storage Controller: '; `which lspci` | grep -i -e raid -e storage -e lsi"
echo ""
clush -a -B "dmesg | grep -i raid | grep -i scsi"
echo ""
clush -a -B "lsblk -id | awk '{print \$1,\$4}'|sort | nl"
echo ""
echo ""
echo -e "${green} ================ Software ======================= ${NC}"
echo ""
echo ""
echo -e "${green}Linux Release ${NC}"
clush -a -B "cat /etc/*release | uniq"
echo ""
echo ""
echo -e "${green}Linux Version ${NC}"
clush -a -B "uname -srvm | fmt"
echo ""
echo ""
echo -e "${green}Date ${NC}"
clush -a -B date
echo ""
echo ""
echo -e "${green}NTP Status ${NC}"
clush -a -B "ntpstat 2>&1 | head -1"
echo ""
echo ""
echo -e "${green}SELINUX ${NC}"
clush -a -B "echo -n 'SElinux status: '; grep ^SELINUX= /etc/selinux/config2>&1"
echo ""
echo ""
echo -e "${green}IPTables ${NC}"
clush -a -B "`which chkconfig` --list iptables 2>&1"
echo ""
clush -a -B " `which service` iptables status 2>&1 | head -10"
echo ""
echo ""
echo -e "${green}Transparent Huge Pages ${NC}"
clush -a -B " cat /sys/kernel/mm/*transparent_hugepage/enabled"
echo ""
echo ""
echo -e "${green}CPU Speed${NC}"
clush -a -B "echo -n 'CPUspeed Service: '; `which service` cpuspeed status2>&1"
clush -a -B "echo -n 'CPUspeed Service: '; `which chkconfig` --list cpuspeed2>&1"
echo ""
echo ""
echo -e "${green}Hostname Lookup${NC}"
clush -a -B " ip addr show"
echo ""
echo ""
echo -e "${green}Open File Limit${NC}"
clush -a -B 'echo -n "Open file limit(should be >32K): "; ulimit -n'
Step 2. Change permissions to executable:
# chmod 755 cluster_verification.sh
Step 3. Run the Cluster Verification tool from the admin node. This can be run before starting the Splunk installation to identify any discrepancies in Post OS Configuration between the servers or during troubleshooting of any cluster issues:
#./cluster_verification.sh
Install and Configure Splunk Enterprise
This chapter contains the following:
● Splunk Enterprise Installation
Splunk software comes packaged as an ‘all-in-one’ distribution. The single file can be configured to function as one or all the following components except Universal Forwarder. Splunk Universal forwarder comes in separate binary package.
A Splunk Enterprise server installs a process on your host, splunkd. splunkd is a distributed C/C++ server that accesses processes and indexes streaming IT data. It also handles search requests. splunkd processes and indexes your data by streaming it through a series of pipelines, each made up of a series of processors. Pipelines are single threads inside the splunkd process, each configured with a single snippet of XML. Processors are individual, reusable C or C++ functions that act on the stream of IT data passing through a pipeline. Pipelines can pass data to one another through queues. splunkd supports a command-line interface for searching and viewing results.
“splunkd” also provides the Splunk Web user interface. It allows users to search and navigate data stored by Splunk servers and to manage your Splunk deployment through a Web interface. It communicates with your Web browser through Representational State Transfer (REST). splunkd runs administration and management services on port 8089 with SSL/HTTPS turned on by default. It also runs a Web server on port 8000 with SSL/HTTPS turned off by default. Figure 8 illustrates the various components of Splunk Enterprise, and this section will provide the details about the configured components.
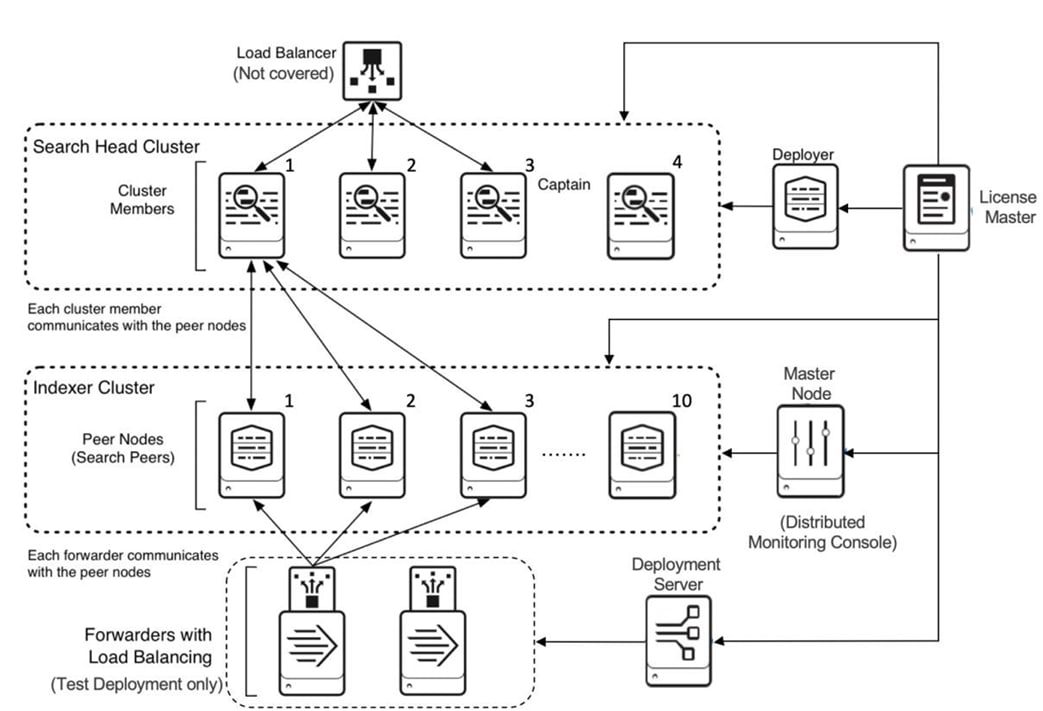
It is highly recommended that assigned hostnames match their corresponding function, for example a search head may be 'splksh1.domain.com' or an indexer may be idx1.domain.com. Throughout this document, instructions are provided, and examples include the use of hostnames. Your deployment may or may not use the same hostnames. Use the table below to plan and track assigned roles and hostnames/lP addresses.
In this CVD, we configured three (3) clustered Search Heads, eight (8) clustered indexers, one dedicated deployment server, and one dedicated distributed monitoring console. We also configured one dedicated admin node to run as license manager, cluster manager and search head cluster deployer as described in Table 9.
Table 9. Server Node information
| Server Node |
Linux Host Name |
Function / Role |
IP Address |
Splunk Binaries & Hot/Warm Storage |
Cold Storage |
| Indexer Server Node 1 |
indx1 |
Indexer 1 |
10.101.1.51 |
/data/disk1 |
/data/disk2 |
| Indexer Server Node 2 |
indx2 |
Indexer 2 |
10.101.1.52 |
/data/disk1 |
/data/disk2 |
| Indexer Server Node 3 |
indx3 |
Indexer 3 |
10.101.1.53 |
/data/disk1 |
/data/disk2 |
| Indexer Server Node 4 |
indx4 |
Indexer 4 |
10.101.1.54 |
/data/disk1 |
/data/disk2 |
| Indexer Server Node 5 |
indx5 |
Indexer 5 |
10.101.1.55 |
/data/disk1 |
/data/disk2 |
| Indexer Server Node 6 |
indx6 |
Indexer 6 |
10.101.1.56 |
/data/disk1 |
/data/disk2 |
| Indexer Server Node 7 |
indx7 |
Indexer 7 |
10.101.1.57 |
/data/disk1 |
/data/disk2 |
| Indexer Server Node 8 |
indx8 |
Indexer 8 |
10.101.1.58 |
/data/disk1 |
/data/disk2 |
| Search Head Server Node 1 |
sh1 |
Search Head 1 |
10.101.1.59 |
/data/disk1 |
- |
| Search Head Server Node 2 |
sh2 |
Search Head 2 |
10.101.1.60 |
/data/disk1 |
- |
| Search Head Server Node 3 |
sh3 |
Search Head 3 |
10.101.1.61 |
/data/disk1 |
- |
| Admin Server Node 1 |
admin1 |
License Manager |
10.101.1.62 |
/data/disk1 |
- |
| Cluster Manager |
|||||
| Search Head Cluster Deployer |
|||||
| Admin Server Node 2 |
admin2 |
Deployment Server |
10.101.1.63 |
/data/disk1 |
- |
| Admin Server Node 3 |
admin3 |
Monitoring Console |
10.101.1.64 |
/data/disk1 |
- |
The Splunk installation and configuration order is as follows:
1. Splunk Installation
2. Configure License Manager
3. Configure Cluster Manager Node
4. Configure Indexing Cluster
5. Configure Deployer
6. Configure Search Head Cluster
7. Configure Distributed Management Console
8. Configure Deployment Server
9. Install Universal forwarder
10. Verify Installation
Splunk Enterprise Installation
This section contains the following procedures:
Procedure 1. Install Splunk Enterprise
Procedure 2. Set up Login for Splunk User
Procedure 3. Start the Splunk Enterprise Cluster
Procedure 5. Initialize Splunk on Boot
Procedure 6. Add Splunk User into sudo group
Procedure 7. Splunk Network Ports
Procedure 1. Install Splunk Enterprise
Step 1. Download the Splunk Enterprise version 9.4.1 software “splunk-9.4.1-e3bdab203ac8.x86_64.rpm” from the Splunk website as https://www.splunk.com/en_us/products/splunk-enterprise.html and save it to “/tmp/” directory on admin1.
Step 2. Log into admin1 as a root user and run the following commands:
ssh 10.101.1.62
wget -O splunk-9.4.1-e3bdab203ac8.x86_64.rpm https://download.splunk.com/products/splunk/releases/9.4.1/linux/splunk-9.4.1-e3bdab203ac8.x86_64.rpm
Step 3. Copy the Splunk software over to all nodes (2 admin, 3 search heads and 8 indexers):
clush -a -c ./splunk-9.4.1-e3bdab203ac8.x86_64.rpm -- dest=/tmp/
Step 4. Modify the permission on the splunk enterprise RPM file to include execution privileges:
clush -a chmod +x /tmp/splunk-9.4.1-e3bdab203ac8.x86_64.rpm
Note: As previously mentioned, we configured the “/data/disk1” directory across all cluster nodes and will install the Splunk enterprise in the directory “/data/disk1” in all nodes (search heads, indexers, and admin nodes).
[root@admin1 ~]# clush -a -B rpm -ivh --prefix=/data/disk1 /root/splunk-9.4.1-e3bdab203ac8.x86_64.rpm
---------------
admin[1-3],indx[1-8],sh[1-3] (14)
---------------
warning: /root/splunk-9.4.1-e3bdab203ac8.x86_64.rpm: Header V4 RSA/SHA256 Signature, key ID b3cd4420: NOKEY
Verifying... ########################################
Preparing... ########################################
no need to run the pre-install check
Updating / installing...
splunk-9.4.1-e3bdab203ac8 ########################################
complete
This step installs Splunk Enterprise software and creates a user named Splunk.
Note: When Splunk Enterprise is installed by means of the RPM package as mentioned above, the installation tool automatically creates a user named “splunk” and group named “splunk.”
Step 5. Setup the environment variable:
clush --group=all-splunk "echo SPLUNK_HOME=/data/disk1/splunk >> /etc/environment"
Step 6. Log off and log back in to the server admin1.
Step 7. Use the clustershell utility command to verify if the environment has been setup correctly:
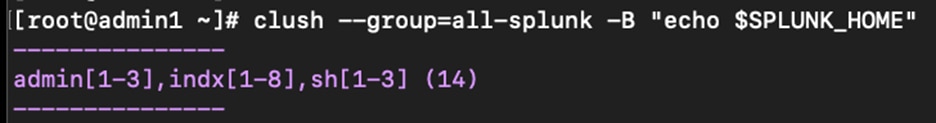
Step 8. Verify the ownerships of the “SPLUNK_HOME” directory and its contents. All these files should belong to “splunk” user and “splunk” group:
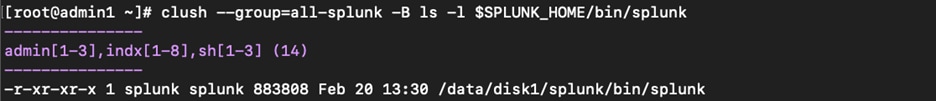
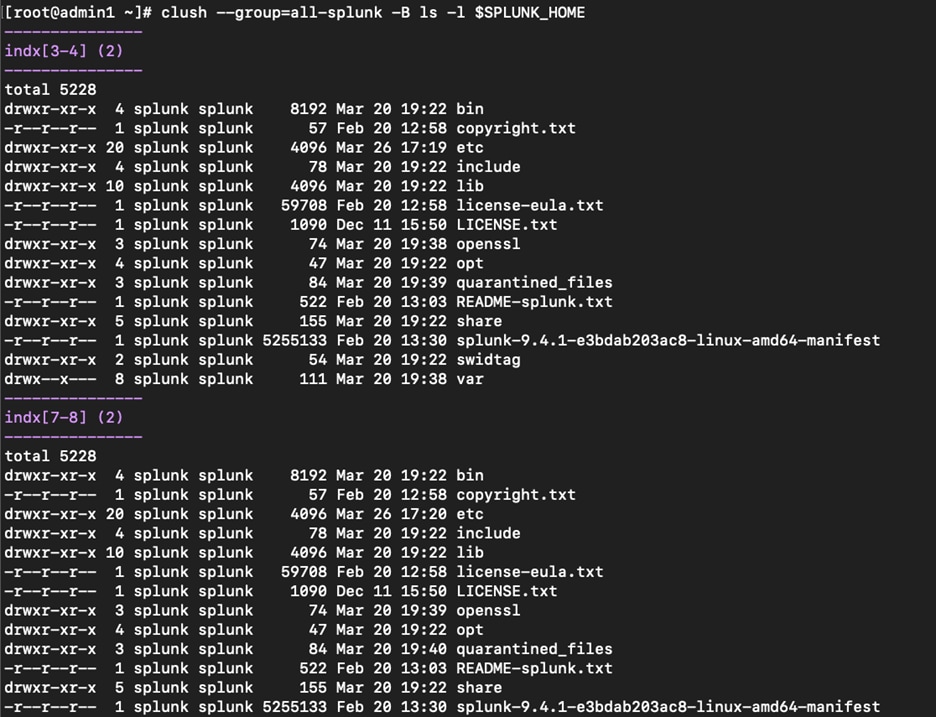
Procedure 2. Set up Login for Splunk User
This procedure describes how to assign a password and configure the passwordless login for the user account.
Step 1. From the admin node (admin1), assign the password for the user “splunk” on all the splunk indexers, search heads and admin servers:
[root@admin1 ~]# clush --group=all-splunk -B "echo cisco123 | passwd splunk --stdin"
---------------
admin[1-3],indx[1-8],sh[1-3] (14)
---------------
Changing password for user splunk.
passwd: all authentication tokens updated successfully.
Note: In this example, we are using a command line method with clear text password for the sake of simplification. It is recommended to setup a strong password and set the password manually on each server individually to match your security practices.
Step 2. Log into the admin node as user “splunk.”
Step 3. Run the ssh-keygen command to create both public and private keys on the admin node for the user splunk:
[splunk@admin1 ~]$ ssh-keygen
Generating public/private rsa key pair.
Enter file in which to save the key (/data/disk1/splunk/.ssh/id_rsa):
Created directory '/data/disk1/splunk/.ssh'.
Enter passphrase (empty for no passphrase):
Enter same passphrase again:
Your identification has been saved in /data/disk1/splunk/.ssh/id_rsa
Your public key has been saved in /data/disk1/splunk/.ssh/id_rsa.pub
The key fingerprint is:
SHA256:0Z5MxndEwehL/NtS554/kyI23CWyYgf5KrP9HfnCIWo splunk@admin1
The key's randomart image is:
+---[RSA 3072]----+
| ++. |
| o ... |
| . =o. . |
| * o+. |
| S =. o |
| o o.oo.o|
| = *o+=o|
| o.E O.==++|
| .*o*.o.o=*|
+----[SHA256]-----+
Step 4. Run the following script from the admin node to copy the public key to all the splunk servers that is indexers, search heads and admins of the cluster:
for host in admin1 admin2 admin3 indx1 indx2 indx3 indx4 indx5 indx6 indx7 indx8 sh1 sh2 sh3; do echo -n "$host -> "; ssh-copy-id -i ~/.ssh/id_rsa.pub $host; done
Step 5. Enter yes for “Are you sure you want to continue connecting (yes/no/[fingerprint])? ” and then enter the password of the remote host.
Step 6. Verify the password less login by entering the following command. The output should display the hostname of all splunk servers:
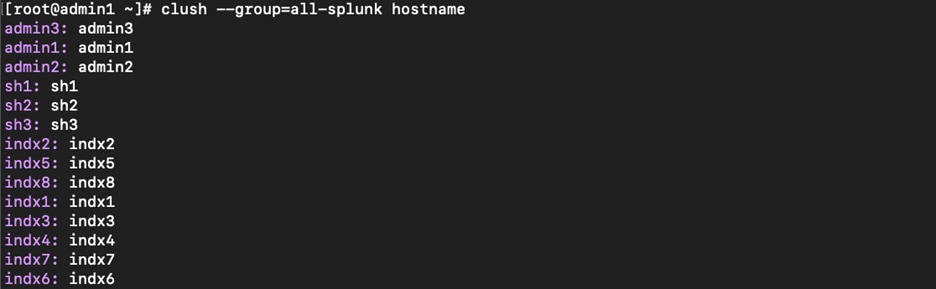
Procedure 3. Start the Splunk Enterprise Cluster
Step 1. To start Splunk on all cluster instances, log into each of the nodes one-by-one as “splunk” user and start the splunk services by running the following command:
Note: On initial start up, start “splunk” one by one node individually and accept license as needed.
splunk start --accept-license
Step 2. After starting the splunk instances on all nodes, log back into admin1 and verify the status of the splunk services by running the following command:
clush --group=all-splunk $SPLUNK_HOME/bin/splunk status
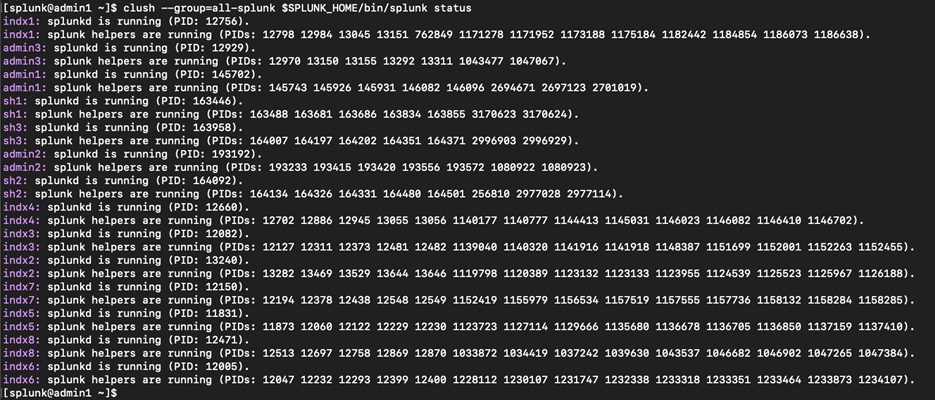
Step 1. Log into the admin1 instance. The URL will point to the default port of ‘8000’. For example, http://admin1:8000

Note: In this solution, the password for the Splunk Administrator is set to ‘cisco123’ (the same as the os user). Throughout this solution, the user “splunk” is used to run all the splunk processes.
Procedure 5. Initialize Splunk on Boot
On Linux machines that use the systemd system manager, you can configure Splunk Enterprise to let systemd control it. By default, Splunk Enterprise configures itself to run as an init-managed service and does not use system but init scripts are not compatible with RHEL 8 and above. To ensure Splunk Enterprise starts automatically at boot on RHEL 9.4, you must configure it to run as a systemd-managed service.
Step 1. Log into the admin server (admin1) as a root user and stop the splunk:
clush --group=all-splunk $SPLUNK_HOME/bin/splunk status
clush --group=all-splunk $SPLUNK_HOME/bin/splunk stop
Step 2. Enable Boot-Start with systemd:
$SPLUNK_HOME/bin/splunk enable boot-start -systemd-managed 1 -user splunk -group splunk
Note: This command creates a Splunkd.service unit file in /etc/systemd/system/ and configures Splunk to start at boot under systemd management.
Step 3. Reload systemd Daemon:
systemctl daemon-reload
Step 4. Start and Enable Splunk Service:
systemctl start Splunkd
systemctl enable Splunkd
This starts Splunk and ensures it will start automatically on future boots.
Step 5. Verify Service Status:
systemctl status Splunkd
Procedure 6. Add Splunk User into sudo group
By following these steps, Splunk Enterprise will be managed by systemd and start automatically on boot in RHEL 9.4. It is recommended to run Splunk as a non-root user for security reasons. However, running as a non-root user may require additional permissions for Splunk to read certain log files. Also, to grant the “splunk” user (or any user running Splunk) sudo privileges on a Linux system, you must update the system's sudoers configuration. This allows the user to execute commands with elevated privileges, which is sometimes necessary for managing Splunk services or configuring system-level settings.
Step 1. Log in as root user into admin node1.
Step 2. Edit the “sudoers” file using visudo:
visudo
Step 3. Add the splunk user to the sudoers file:
splunk ALL=(ALL) NOPASSWD: ALL
This allows the “splunk” user to run any command as any user on any host, without being prompted for a password.
Step 4. (Optional) Grant limited sudo access.
Step 5. For better security, restrict the “splunk” user to only the necessary commands. For example, to allow only Splunk management commands:
splunk ALL=(ALL) NOPASSWD: /data/disk1/splunk/bin/splunk
or add splunk start/stop/restart to the system control processes that can be executed by the user splunk as the sudo user, by adding the following contents into the file /etc/sudoers:
splunk ALL=(root) NOPASSWD: /usr/bin/systemctl restart Splunkd.service
splunk ALL=(root) NOPASSWD: /usr/bin/systemctl stop Splunkd.service
splunk ALL=(root) NOPASSWD: /usr/bin/systemctl start Splunkd.service
Step 6. After editing, save and exit the editor. If configured with NOPASSWD, the user should not be prompted for a password:
sudo -u splunk -i
sudo /data/disk1/splunk/bin/splunk status
Step 7. Reboot the admin server node admin1. When the server boots up, verify that the Splunk software starts upon boot and verify the sudo commands work.
Step 8. Repeat steps 1 - 7 on all the cluster nodes so that the Splunk user can get sudo privileges on a Linux system.
Splunk Enterprise components require network connectivity to work properly if they have been distributed across multiple machines. Splunk components communicate with each other using TCP and UDP network protocols. The following ports, but not limited to these ports, must be available to cluster nodes, and should be configured as open can to allow communication between the Splunk instances:
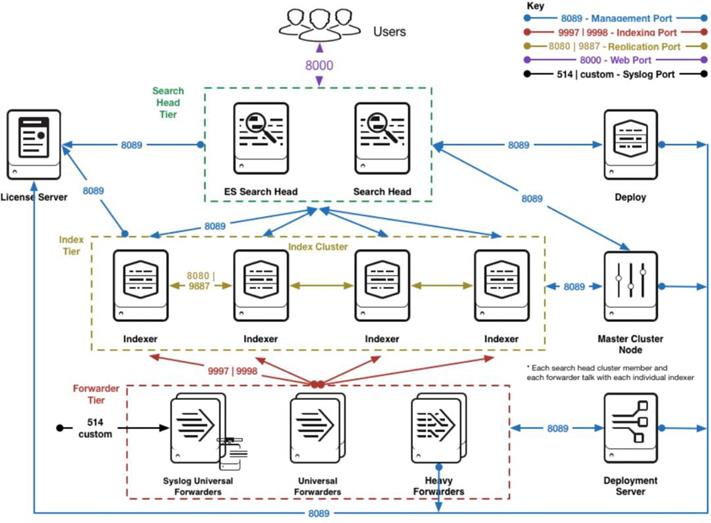
● On the manager
◦ The management port (by default, 8089) must be available to all other cluster nodes.
◦ The http port (by default, 8000) must be available to any browsers accessing the monitoring console.
● On each peer
◦ The management port (by default, 8089) must be available to all other cluster nodes.
◦ The replication port (by default, 8080) must be available to all other peer nodes.
◦ The receiving port (by default, 9997) must be available to all forwarders sending data to that peer.
● On each search head
◦ The management port (by default, 8089) must be available to all other nodes.
◦ The http port (by default, 8000) must be available to any browsers accessing data from the search head.
This section describes step by step process to configure and setup Splunk Enterprise Cluster on different nodes with server specific and its individual role.
Configure the Splunk Enterprise Licenses and Setup License Manager
This section contains the following procedure:
Procedure 1. Configure the server admin1 as the central license manager
The servers in the Splunk Enterprise infrastructure that performs indexing must be licensed. Any Splunk can be configured perform the role of license manager. In this CVD, the admin node (admin1) is configured to be the license manager and all the other Splunk instances are configured as license peer nodes.
Procedure 1. Configure the server admin1 as the central license manager
Step 1. Log into the server admin1 as user admin.
Step 2. Go to Settings > System > Licensing.
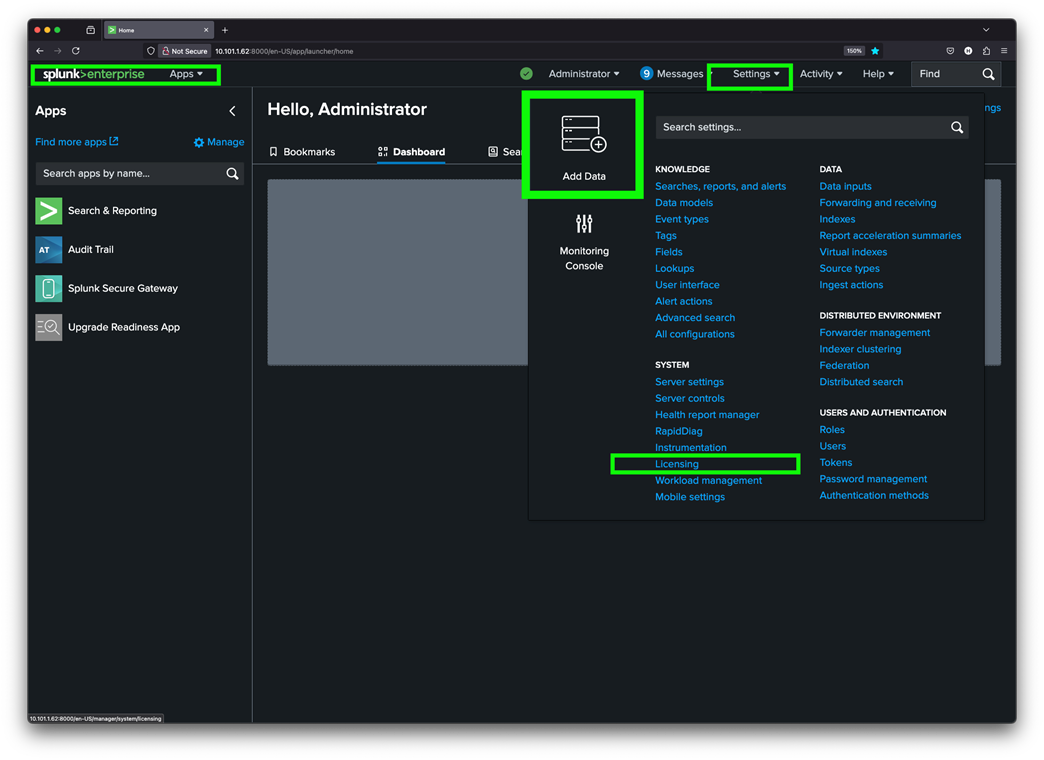
Step 3. Click Change License Group.
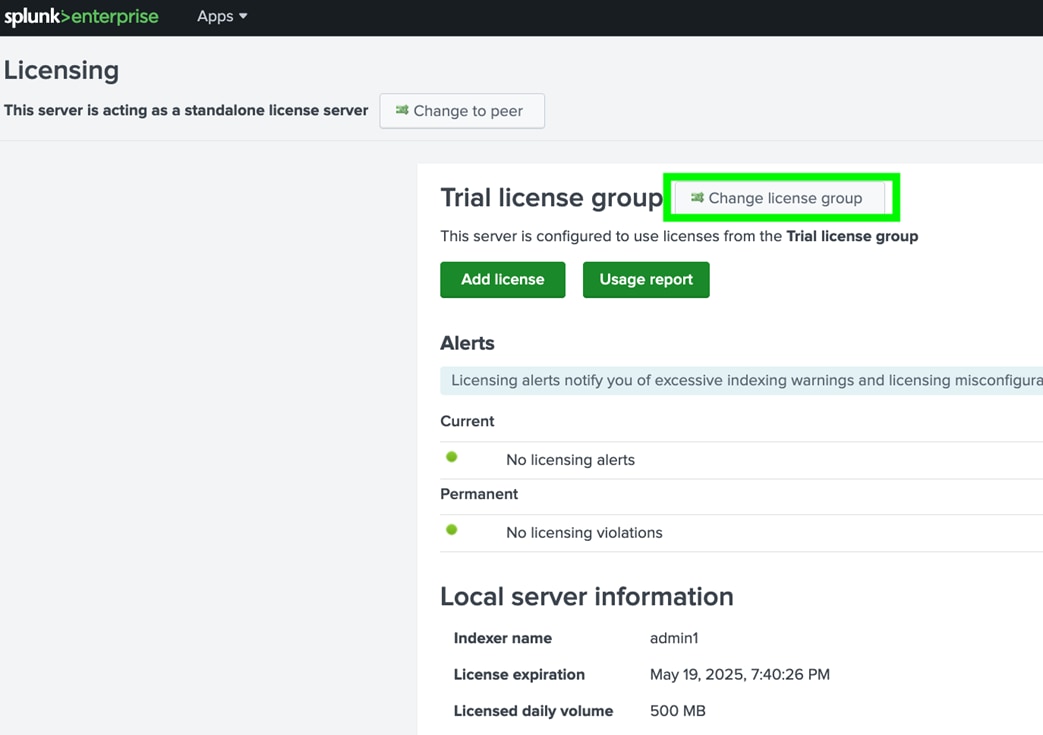
Step 4. Click Enterprise license radio button. Click Save.
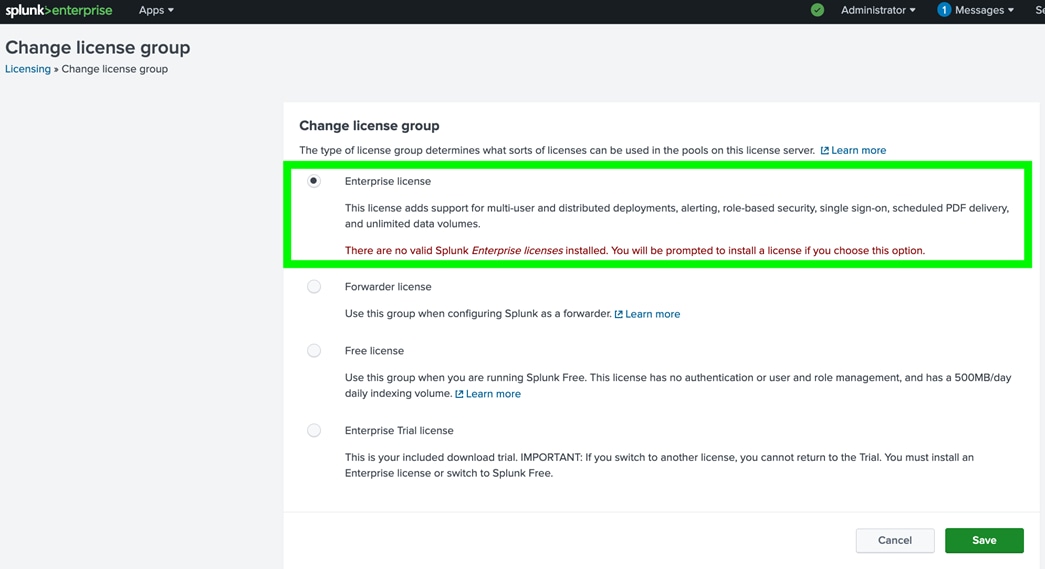
Step 5. In the Add new license dialog, click Choose File to select your license file. Click Install to install the license.
Step 6. Click Restart and then Click OK to restart Splunk to complete the license installation.
Step 7. Log back into Splunk. If “are you sure you want to restart Splunk” is still visible, click Cancel.
Configure the Indexers, Search Heads and Admin Nodes as License Peer
Configure all the other Splunk instances to be the License peer to the Splunk License manager, for example, admin1.
This can be performed by following one of two methods:
● Method 1: The first and preferred method is to use ClusterShell command (clush) to configure all the Splunk instances to be license peers to the license manager.
● Method 2: The second method is to configure each node as a license peer individually from the respective Web UI.
Method 1: To configure the indexers, search heads, and admin nodes, follow these steps:
Step 1. Log into the admin node as user ‘splunk’ and execute the command:
[splunk@admin1 ~]$ clush --group=all-splunk -x admin1 -B $SPLUNK_HOME/bin/splunk edit licenser-localpeer -manager_uri https://admin1:8089 -auth admin:cisco123
---------------
admin3,indx[1-8],sh[1-3] (12)
---------------
The licenser-localpeer object has been edited.
Step 2. You need to restart the Splunk Server (splunkd) for your changes to take effect. Restart Splunk service on the peer nodes:
clush --group=all -B /data/disk1/splunk/bin/splunk restart
Step 3. Optional with Authentication (if needed): If Splunk requires authentication, add the -auth flag:
clush --group=all -B /data/disk1/splunk/bin/splunk restart -auth admin:<password>
Step 4. Start and stop Splunk services running the systemctl command:
clush --group=all -x admin1 -B sudo /usr/bin/systemctl restart Splunkd.service
Method 2: To configure each node as a license peer individually from the Web UI follow these steps:
Step 1. Log into an indexer (indx1) server web interface as user admin. (for example, http://indx1:8000)
Step 2. Go to Settings > Licensing.
Step 3. Select Change License Group and then select the Enterprise License radio button and click Save.
Step 4. After applying licenses into this node, go to Licensing > Change to peer > and then select “Designate a different Splunk instance as the manager license server” and provide manager license URI as shown below:
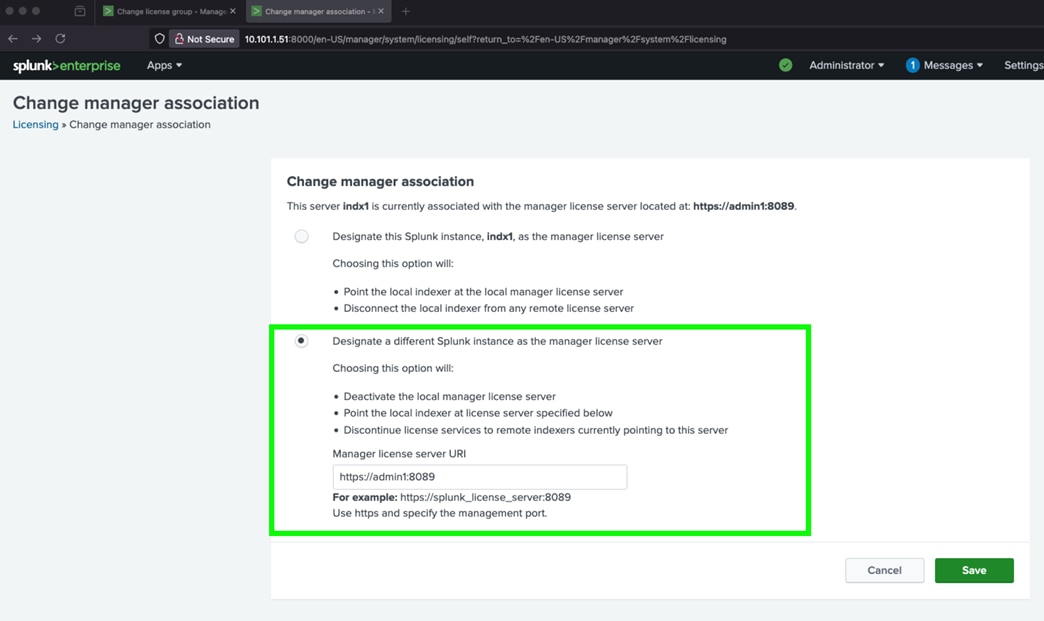
Step 5. Click Save and then click OK to restart Splunk to complete the license installation. When the process is complete, the Licensing window will show the successful license installation and manager server URI:
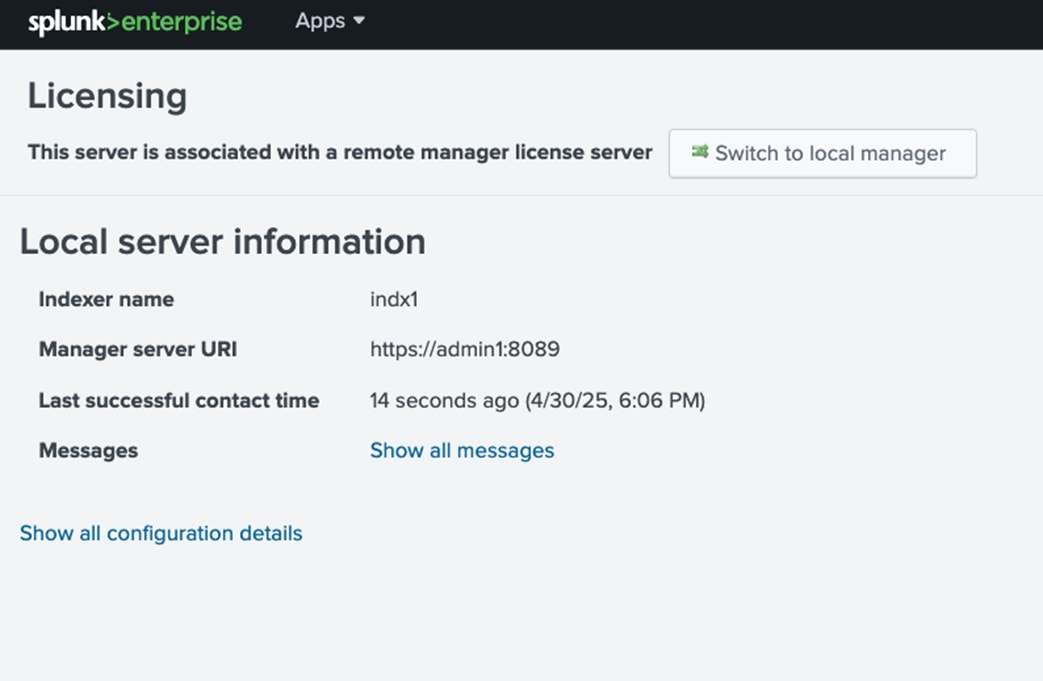
Step 6. Repeat steps 1 – 5 and configure each node individually by accessing the respective web user interfaces and then “Designate a different Splunk instance as the manager license server” and setup all the nodes for this cluster.
Step 7. Verify the Licensing screen in the web user interface of the license manager instance: here, admin1. At the bottom of this screen, click Show All indexer Details to view the details.
You will see all license peers listed: eight indexers, three search heads, and three admin servers so total 14 server nodes as shown below:
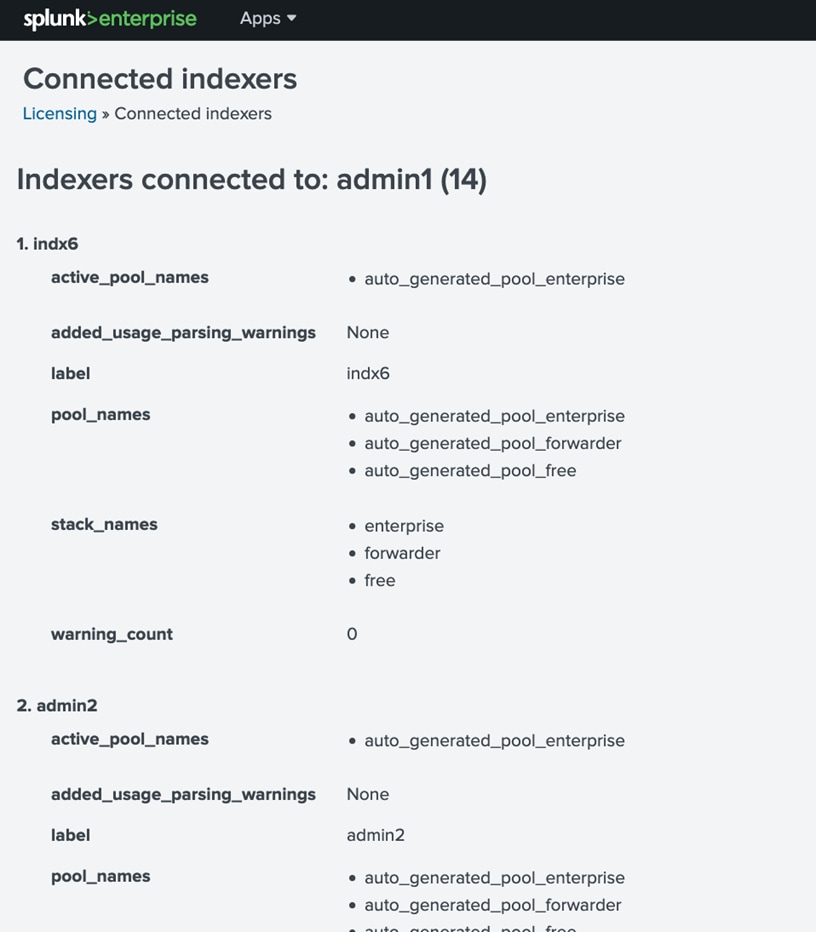
Note: The license manager counts all the license peer as Splunk indexer instances despite the actual roles that the instances have been configured to perform.
Configure Index Cluster and Cluster Manager Node
This section contains the following procedure:
Procedure 1. Configure the admin node admin1 as the Indexer Cluster Manager
An indexer cluster is a group of Splunk Enterprise instances, or nodes, that, working in concert, provide a redundant indexing and searching capability. The parts of an indexer cluster are:
● A single cluster manager node to manage the cluster
● A number of peer nodes to index and maintain multiple copies of the data and to search the data.
● One or more search heads to coordinate searches across the set of peer nodes
The Splunk Enterprise indexers of an indexer cluster are configured to replicate each other’s data, so that the system keeps multiple copies of all data. This process is known as index replication. The number of copies is controlled by a parameter known as replication factor. By maintaining multiple, identical copies of Splunk Enterprise data, clusters prevent data loss while promoting data availability for searching. Indexer clusters feature automatic failover from one indexer to the next. This means that, if one or more indexers fail, incoming data continues to get indexed and indexed data continues to be searchable.
Procedure 1. Configure the admin node admin1 as the Indexer Cluster Manager
Step 1. Using a web browser, go to the manager node (admin1) http://hostname-or-IP:8000/ (such as https://admin1:8000/).
Step 2. Go to Settings > Distributed Environment > Indexer Clustering.
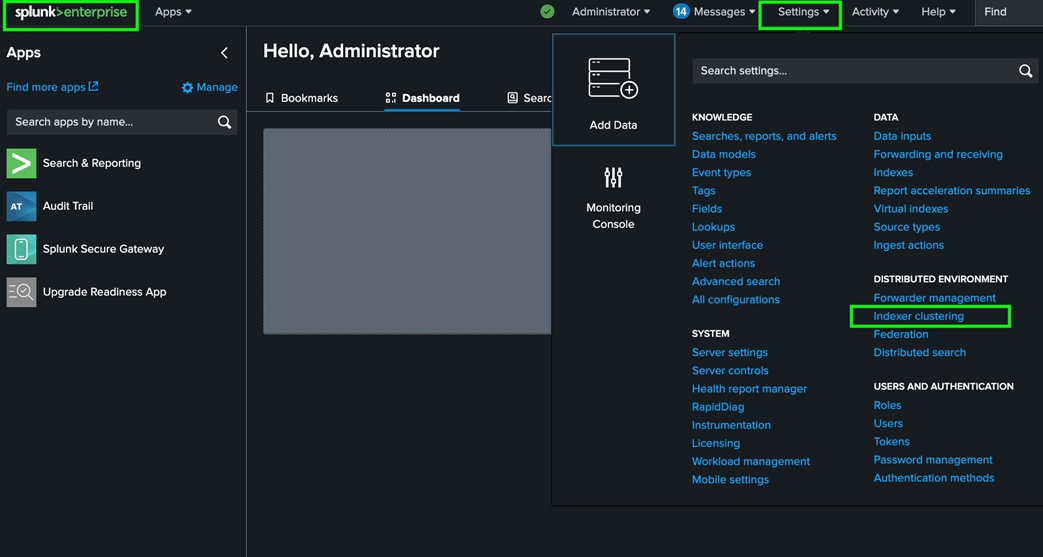
Step 3. Click Enable Indexer Clustering.
Step 4. Select Manager Node and click Next.
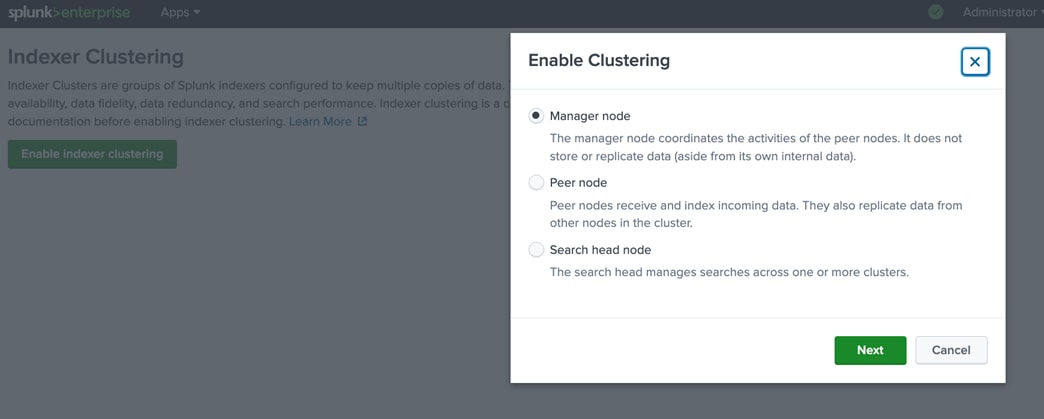
Step 5. Set the fields Replication Factor to be 3 and Search Factor to be 2. Enter your Security Key and Cluster Label for the cluster.
Note: For this solution, we used ‘splunk+cisco’ as a security key. Click Enable Manager Node.
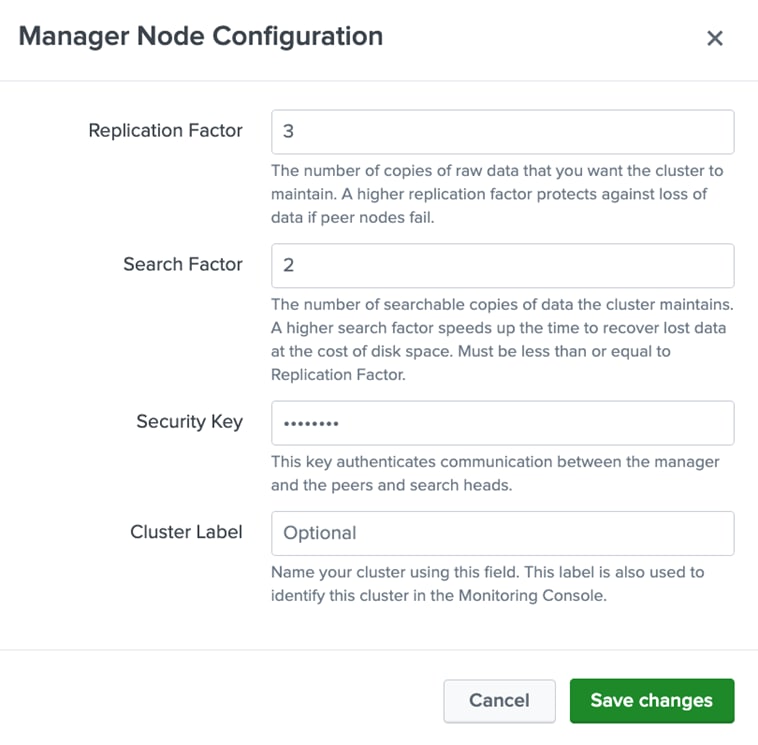
Note: Replication and Search factors vary by deployment. The replication factor indicates the number of copies to be maintained on the indexers. The search factor indicates how many of those copies will return search results. In the configuration shown above, one indexer could be down, and searches still return all results. If the configuration needs to be more resilient, the replication factor may be increased but will also increase disk consumption. Refer to the Splunk documentation for more information: http://docs.splunk.com/Documentation/Splunk/latest/Indexer/Thereplicationfactor
Step 6. Click Restart Now to restart the Splunk service as indicated.
Step 7. Wait until the Restart Successful message appears, click OK to go back to the Login screen.
Step 8. Log in as the admin user again and into indexer clustering page, you will see “No Peers Configured” as shown below:
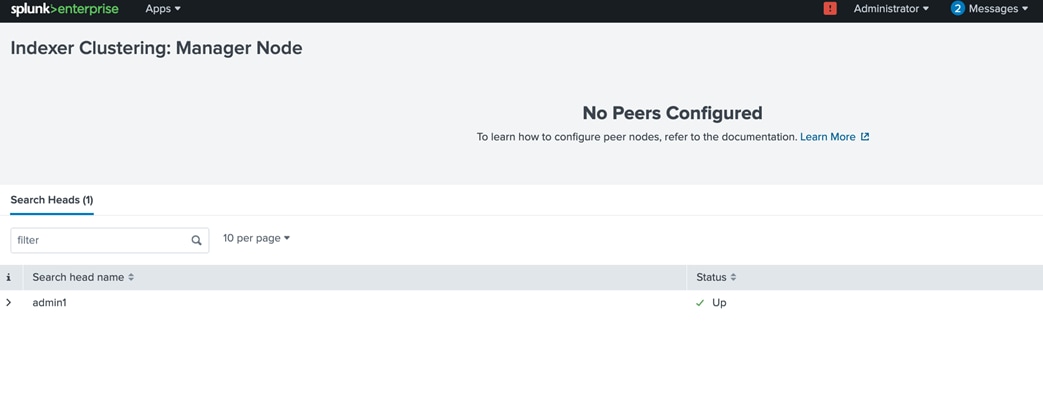
Configure Indexing Peers and Indexer Clusters
Add the Splunk indexer instances as the indexing peers to the Cluster Manager, for example, admin1.
This can be performed by following one of two methods:
● Method-1: The first and preferred method is to use ClusterShell command (clush) to configure all the Splunk indexer nodes to be indexing peers to the cluster manager.
● Method-2: The second method is to configure each Splunk indexer server node as an indexing peer individually by accessing the respective Web UI.
Method 1: Using ClusterShell. To configure indexing peers, follow these steps:
Step 1. From the admin node, as the ‘splunk’ user, run the following command:
[splunk@admin ~]$ clush --group=indexers $SPLUNK_HOME/bin/splunk edit cluster-config -mode peer -manager_uri https://admin1:8089 -replication_port 8080 -secret splunk+cisco -auth admin:cisco123
Step 2. After editing the cluster configuration, restart the effected server nodes:
[splunk@admin ~]$ clush --group=indexers -B sudo /usr/bin/systemctl restart Splunkd.service
Step 3. After all the splunk process in peer nodes are restarted, check the Manager node’s (such as admin1) web UI. The Manager node must report number of available peers.
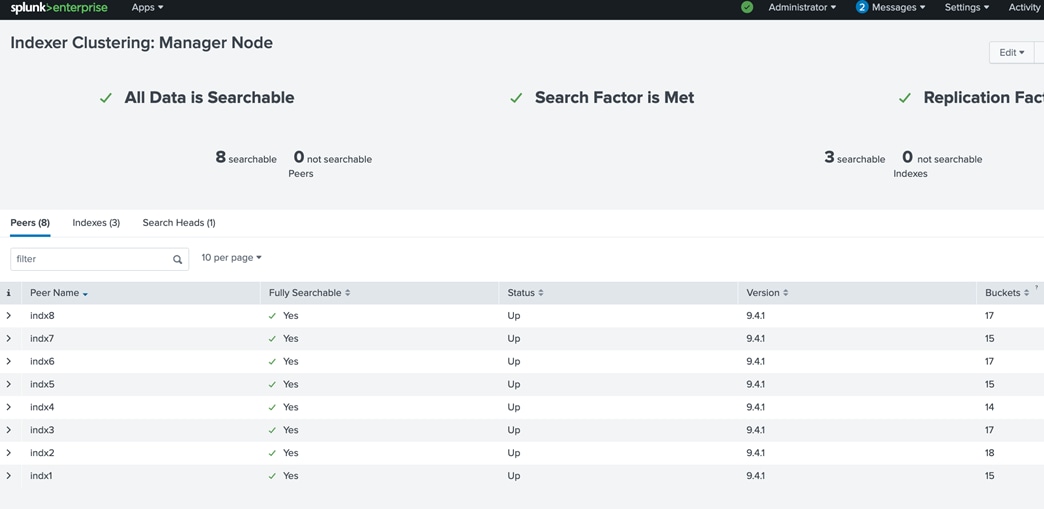
Note: When the indexers are added to the cluster, it is not advised to use the command ‘$SPLUNK_HOME/bin/splunk restart’ on individual indexers. Refer to the documentation for detailed information: http://docs.splunk.com/Documentation/Splunk/latest/Indexer/Restartthecluster
Step 4. Verify that all eight (8) indexers should appear as searchable, and the Search Factor and Replication Factor are met.
Method 2: Use Splunk Web Interface. To use Splunk Web Interface, follow these steps:
Step 1. Using your browser, go to the Splunk Enterprise instance’s web user interface: for example, go to https://indx1:8000/
Step 2. Go to Settings > Indexer Clustering > Enable Indexer Clustering.
Step 3. Select the node type as “Peer Node” radio button. Click Next.
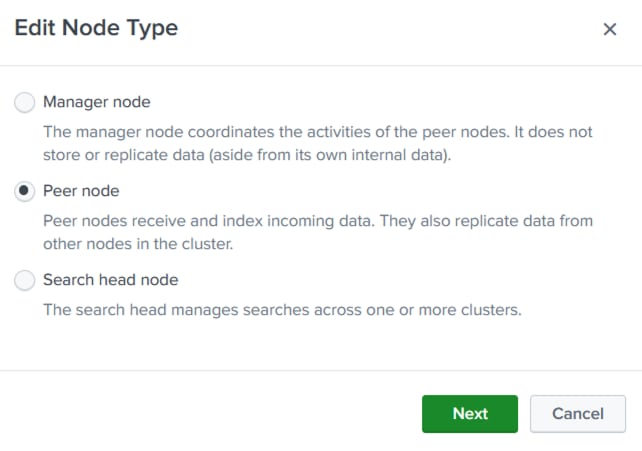
Step 4. Set the Manager URI, peer replication port and security key as shown below.
Step 5. Click Enable peer mode.
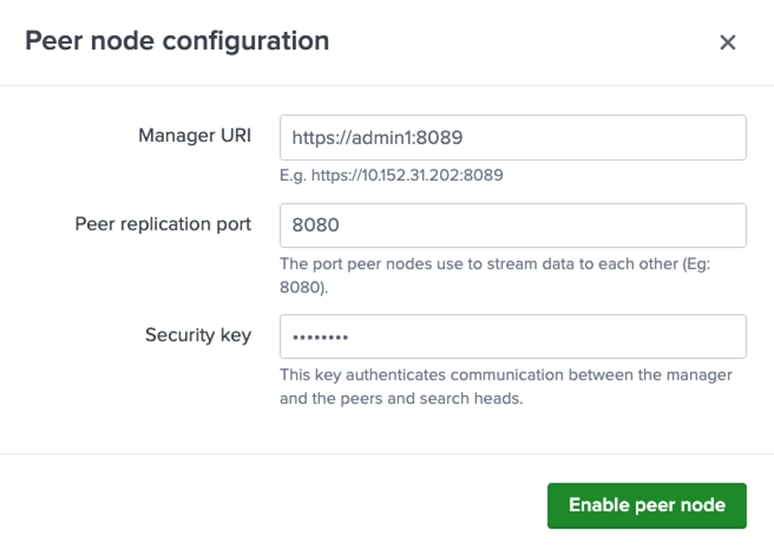
Step 6. After the cluster configuration has been edited, restart the Splunk Enterprise instances on the indexers.
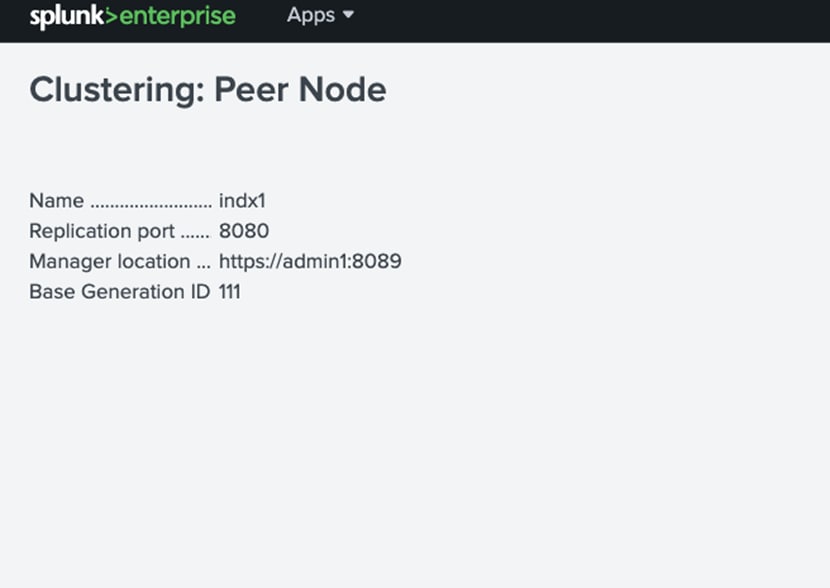
Step 7. Repeat this procedure on each indexer and restart all the Splunk Enterprise instances on all the indexers to configure peer nodes and indexer clustering.
Set Dedicated Replication Address
This section contains the following procedure:
Procedure 1. Set the dedicated replication address
Splunk enterprise provides a way to use of a dedicated network interface for index replication data traffic that happens at the indexers in Splunk Enterprise Indexer Cluster. In this CVD, the OS second interface eth2 with an IP address in the range “192.168.1.0/24” is utilized for replication purpose. This feature is configured in the “server.conf” on each of Splunk Enterprise Indexer instance by setting the “register_replication_address” property. This property can be configured with an IP address or a resolvable hostname.
Procedure 1. Set the dedicated replication address
Step 1. ssh to indexer node 1 (indx1) as splunk user.
Step 2. Edit the “server.conf” on Indexer node located at $SPLUNK_HOME/etc/system/local/server.conf
Step 3. Add the following line, replacing <eth2_ip> with the actual IP address of eth2 for that indexer:
[clustering]
register_replication_address = 192.168.1.51
This will setup Splunk to use only the specified interface for accepting replication data
Step 4. After making changes on indexer node 1, repeat the same above steps across all the remaining indexer nodes.
Step 5. After setting up dedicated replication interface on each indexer node, we mush restart the splunk instance on indexers.
Step 6. To restart the Splunk indexing cluster safely and with minimal disruption, use the rolling restart feature from the cluster manager. This method restarts each indexer peer one at a time, allowing the cluster to remain available during the process.
Step 7. Run the following command on the cluster manager node admin1. This will sequentially restart all indexer peers in the cluster:
splunk rolling-restart cluster-peers
Step 8. SSH to the cluster manager node admin1 as splunk user and restart.
Configure Receiving on the Peer Nodes
This section contains the following procedure:
Procedure 1. Configure receiving on the peer nodes
For the indexers (aka peer nodes) to receive data from the forwarders, the “inputs.conf” file of all the indexers needs to be configured with a stanza to enable the tcp port 9997.
This is done by editing a special purpose app’s “input.conf” file in the cluster manager (admin1).
Procedure 1. Configure receiving on the peer nodes
Step 1. On the command line of the manager node (admin1), navigate to “$SPLUNK_HOME/etc/manager-apps/_cluster/local.”
Step 2. Create and edit the file ‘inputs.conf’ with the following content:
[splunk@admin1 local]$ cat inputs.conf
[splunktcp://:9997]
connection_host = ip
Note: If this configuration uses DNS, edit ‘connection_host = dns.’
Step 3. Open the admin1 web management interface through browser. Navigate to ‘Settings> Distributed Environment > Indexer Clustering.’
Step 4. Go to Edit > Configuration Bundle Actions.
Step 5. Select Validate and Check Restart option.
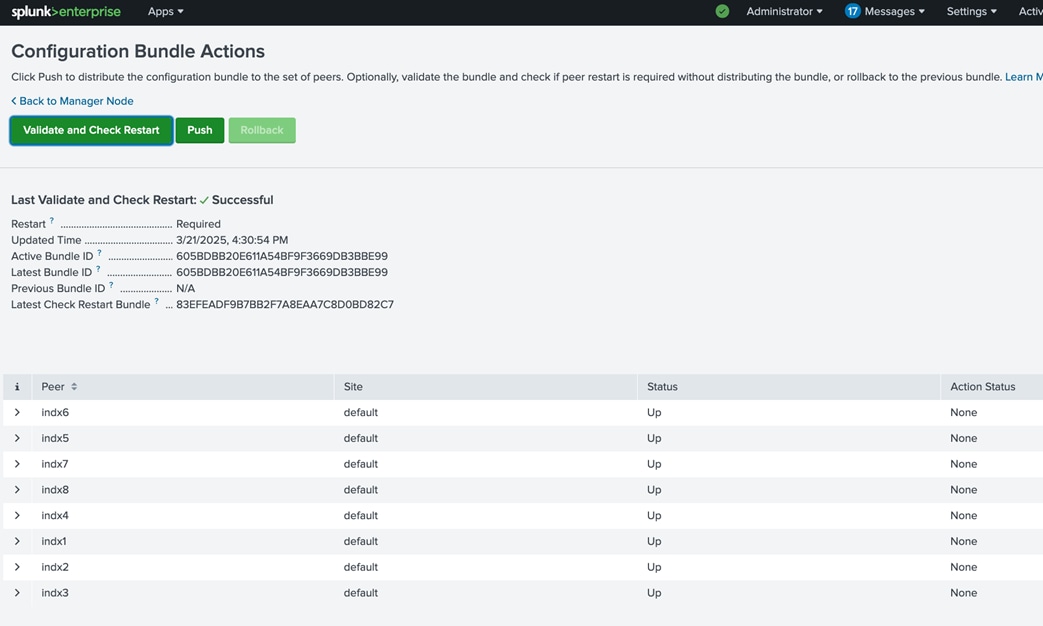
Step 6. Wait until check Successful.
Step 7. Select Push. Acknowledge the warning and Push Changes. The configuration changes are pushed to all the indexing peers. Rolling restart of all the peers are in progress.
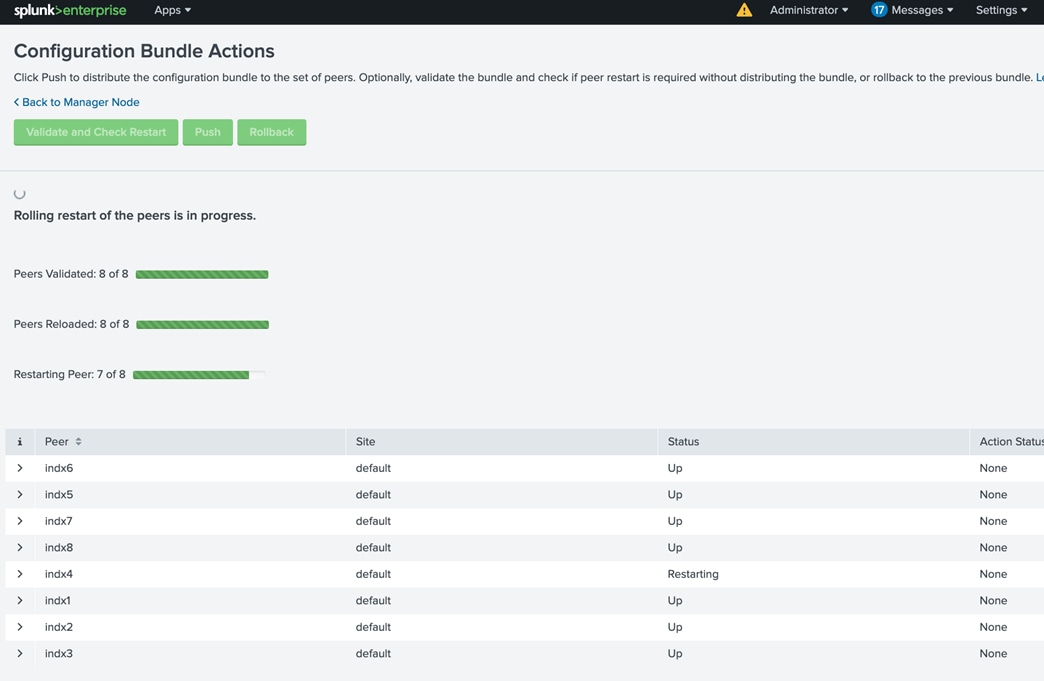
When Push is complete, the GUI will reflect a successful push.
Step 8. Log into one of the indexers through SSH.
Step 9. Go to $SPLUNK_HOME/etc/slave-apps/_cluster/local.
Step 10. Verify that the file ‘inputs.conf’ has been pushed to the indexers.
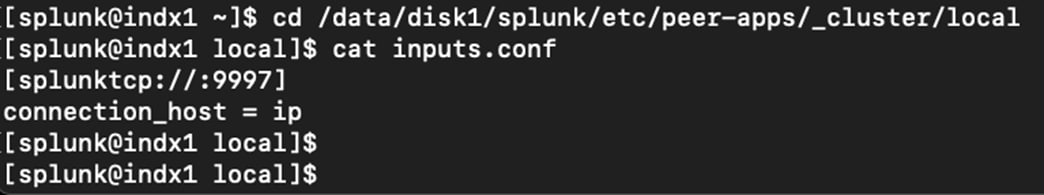
Configure Manager to forward all data to the Indexer Layer
This section contains the following procedures:
Procedure 1. Configure the manager as a forwarder
Procedure 2. Configure the cluster manager node admin1
It is a best practice to forward all manager node internal data to the indexer (peer node) layer. This has several advantages: It enables diagnostics for the manager node if it goes down. The data leading up to the failure is accumulated on the indexers, where a search head can later access it. The preferred approach is to forward the data directly to the indexers, without indexing separately on the manager.
Procedure 1. Configure the manager as a forwarder
Step 1. Make sure that all necessary indexes exist on the indexers. This is normally the case unless you have created custom indexes on the manager node. Since _audit and _internal exist on indexers as well as the manager, there is no need to create separate versions of those indexes to hold the corresponding manager data.
Step 2. Configure the manager as a forwarder. Create an “outputs.conf” file on the manager node that configures it for load-balanced forwarding across the set of peer nodes. The indexing function on the manager must also be turned off, so that the manager does not retain the data locally as well as forward it to the peers.
Procedure 2. Configure the cluster manager node admin1
Step 1. Create “outputs.conf” file in the manager node at $SPLUNK_HOME/etc/system/local directory.
Step 2. Create an outputs.conf file with the following content:
#Turn off indexing on the manager
[indexAndForward]
index = false
[tcpout]
defaultGroup = search_peers
forwardedindex.filter.disable = true
indexAndForward = false
[tcpout:search_peers]
server=indx1:9997,indx2:9997,indx3:9997,indx4:9997,indx5:9997,indx6:9997,indx7:9997,indx8:9997
autoLB = true
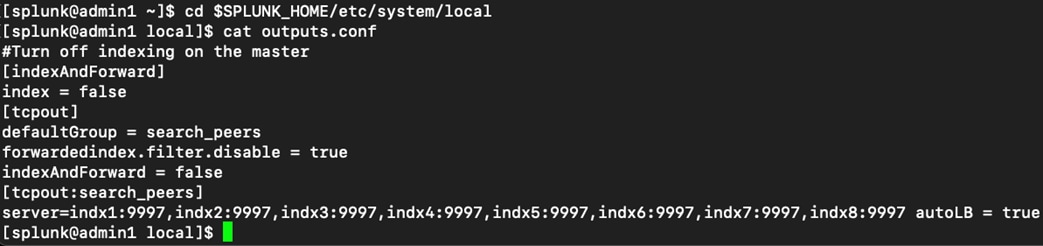
Step 3. Restart Splunk service on admin1.
Configure Search Head Clustering
This section contains the following procedures:
Procedure 1. Add Search Heads to Manager Node
Procedure 2. Configure Search Head Cluster Members
Procedure 3. Elect a Search Head Captain
Procedure 4. Configure the Search Head Deployer
Procedure 5. Configure Search Heads to forward data to the Indexer Layer
A search head cluster is a group of Splunk Enterprise search heads that serves as a central resource for searching. The members of a search head cluster are essentially interchangeable. You can run the same searches, view the same dashboards, and access the same search results from any member of the cluster.
Note: In order to take full advantage of the search head cluster, it is required to utilize a virtual or physical load balancer according to the enterprise’s standards. Due to variability, the operator is suggested to use their own discretion in installing and configuring this.
Procedure 1. Add Search Heads to Manager Node
A Splunk Enterprise instance can be configured as a search head through the Indexer clustering feature.
Step 1. Log into one of the search heads as user admin.
Step 2. Go to Settings> Distributed Environment > Indexer Clustering.
Step 3. Click Enable Indexer Clustering.
Step 4. In the Enable Clustering dialog box, click Search head node. Click Next.
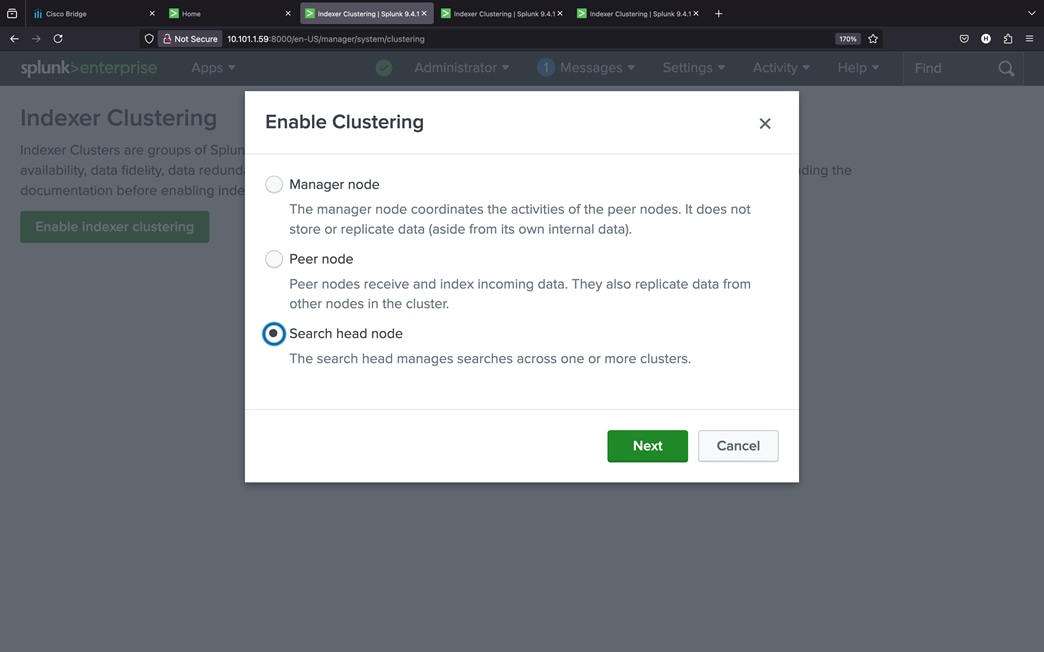
Step 5. Enter the Manager URI and security key as shown below.
Step 6. Enter the same security key that was used while configuring the manager node.
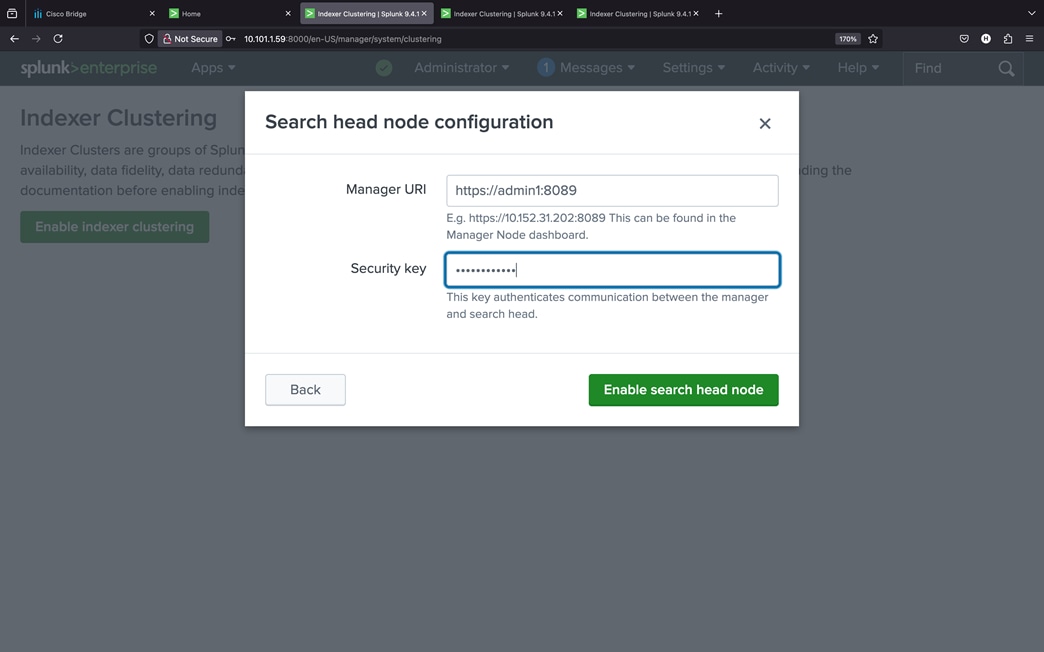
Step 7. Click Enable search head node.
Step 8. Click Restart Now to restart Splunk service as indicated.
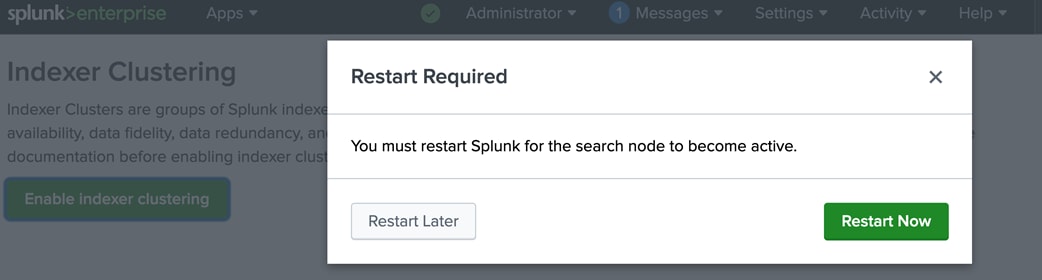
Step 9. Wait until Restart Successful message appears, click OK to go back to the Login screen.
Step 10. Repeat steps 1 - 9 to configure all four servers with hostnames sh1, sh2 and sh3 to be search heads.
Step 11. Verify the search head cluster members in the manager node, by navigating to Settings > Distributed Environment > Indexer clustering.
Step 12. Click the Search Heads tab as shown below:
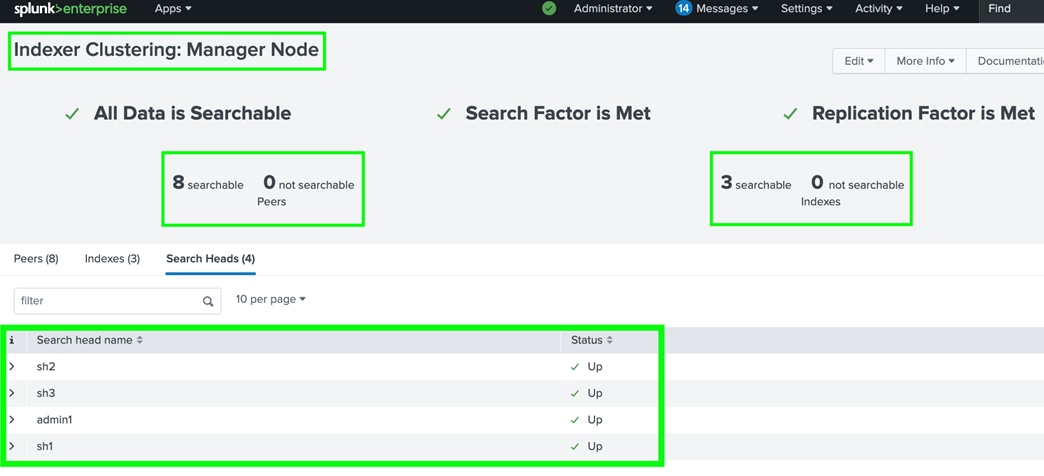
Procedure 2. Configure Search Head Cluster Members
Step 1. Log into the search head server node sh1 as the user ‘splunk’.
Step 2. Enter the following commands to make this search head join the search head cluster:
$SPLUNK_HOME/bin/splunk init shcluster-config -auth admin:cisco123 -mgmt_uri https://sh1:8089 -replication_port 18081 -replication_factor 2 -conf_deploy_fetch_url https://admin1:8089 -secret splunk+cisco
Step 3. Restart Splunk service on the Search Head sh1:
sudo /usr/bin/systemctl restart Splunkd.service
Step 4. Repeat steps 1 - 3 for all the search heads.
Procedure 3. Elect a Search Head Captain
A search head cluster consists of a group of search heads that share configurations, job scheduling, and search artifacts. The search heads are known as the cluster members. One cluster member has the role of captain, which means that it coordinates job scheduling and replication activities among all the members. It also serves as a search head like any other member, running search jobs, serving results, and so on. Over time, the role of captain can shift among the cluster members.
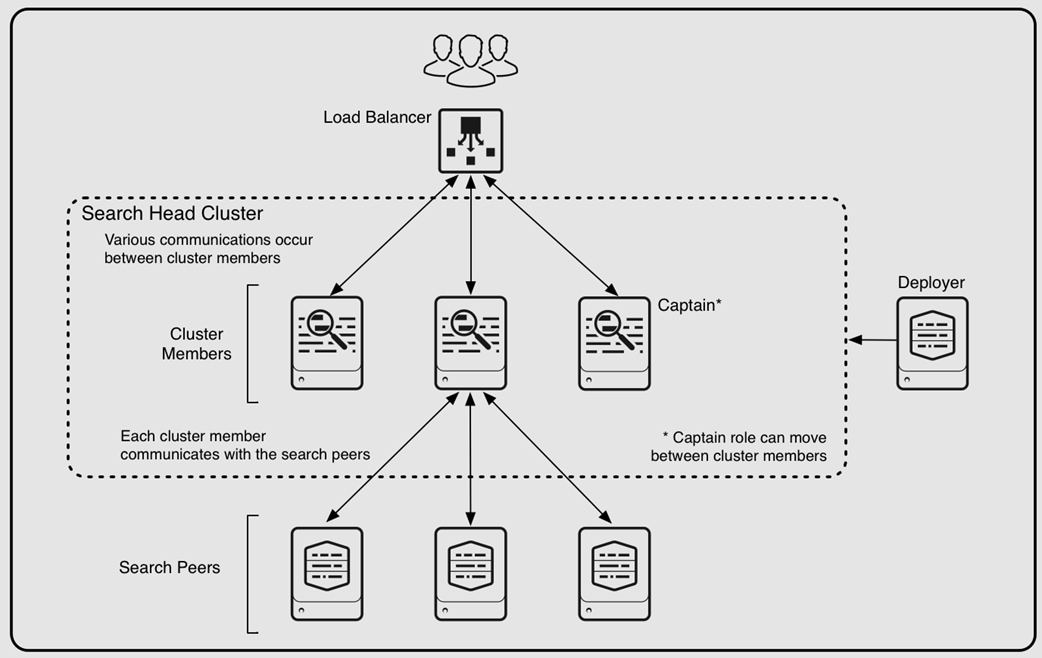
A search head cluster uses a dynamic captain. This means that the member serving as captain can change over the life of the cluster. Any member can function as captain. When necessary, the cluster holds an election, which can result in a new member taking over the role of captain. The procedure described in this section helps bootstrap the election process.
Step 1. SSH into any one of the search heads as the user ‘splunk.’
Step 2. Start the search head caption election bootstrap process by running the following command:
$SPLUNK_HOME/bin/splunk bootstrap shcluster-captain -servers_list "https://sh1:8089,https://sh2:8089,https://sh3:8089, https://sh4:8089" -auth admin:cisco123
Note: The search head captain election process can be started from any of the search head cluster members.
Step 3. Log into one of the search heads GUI as user admin. Navigate to ‘Settings> Distributed Environment > Search Head Clustering.’
Step 4. Verify the Captain has been dynamically chosen.
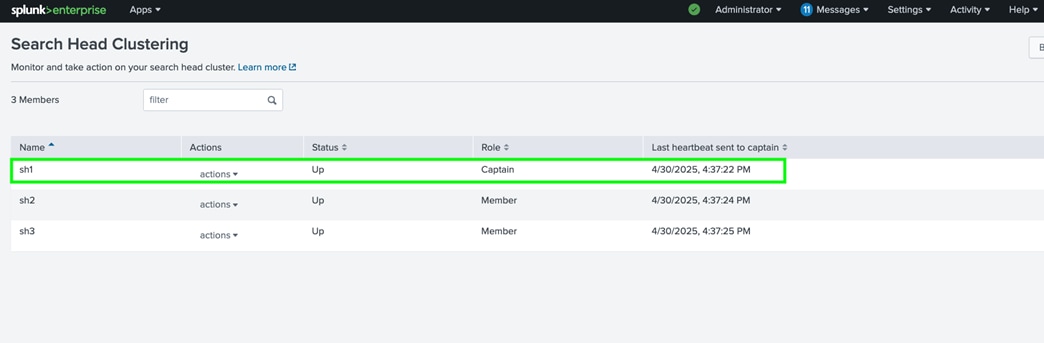
Procedure 4. Configure the Search Head Deployer
A Splunk Enterprise instance that distributes apps and certain other configuration updates to search head cluster members is referred to as a “Search Head Deployer (SHC-D).” Any Splunk Enterprise instance can be configured to act as the Deployer. In this solution the admin1 is selected to serve this function as well.
Note: Do not locate deployer functionality on a search head cluster member. The deployer must be a separate instance from any cluster member, as it is used to manage the configurations for the cluster members.
Step 1. Open an SSH session to admin1 as the user ‘splunk’.
Step 2. Navigate to $SPLUNK_HOME/etc/system/local/.
Step 3. Edit server.conf to include the following stanza:
[shclustering]
pass4SymmKey = your_secret_key (for example, splunk+cisco used in this solution)
Step 4. Restart the Splunk instance on admin1.
Procedure 5. Configure Search Heads to forward data to the Indexer Layer
It is a best practice to forward all search head internal data to the search peer (indexer) layer. This has several advantages. One, It enables diagnostics for the search head if it goes down. The data leading up to the failure is accumulated on the indexers, where another search head can later access it. And two, by forwarding the results of summary index searches to the indexer level, all search heads have access to them. Otherwise, they're only available to the search head that generates them.
The recommended approach is to forward the data directly to the indexers, without indexing separately on the search head. You do this by configuring the search head as a forwarder by creating an “outputs.conf” file on the search head that configures the search head for load-balanced forwarding across the set of search peers (indexers).
The indexing on the search head is disabled so that the search head does not both retain the data locally as well as forward it to the search peers.
Step 1. SSH to admin1 node as the splunk user.
Step 2. Go to $SPLUNK_HOME/etc/shcluster/apps.
Step 3. Create the directory “outputs” and “outputs/local.”
Step 4. Go to the newly created ‘local’ directory, create the file “outputs.conf” with the following content:
# Turn off indexing on the manager
[indexAndForward]
index = false
[tcpout]
defaultGroup = search_peers
forwardedindex.filter.disable = true
indexAndForward = false
[tcpout:search_peers]
server=indx1:9997,indx2:9997,indx3:9997,indx4:9997,indx5:9997,indx6:9997,indx7:9997,indx8:9997
autoLB = true
Step 5. Run the ‘apply shcluster-bundle’ command:
$SPLUNK_HOME/bin/splunk apply shcluster-bundle -target https://sh1:8089 -auth admin:cisco123
Step 6. Acknowledge the warning, a prompt will notify that the bundle has been pushed successfully.
Step 7. Log into one of the search heads through SSH.
Step 8. Go to $SPLUNK_HOME/etc/apps/outputs/default.
Step 9. Verify that the file “outputs.conf” has been pushed to the search heads.
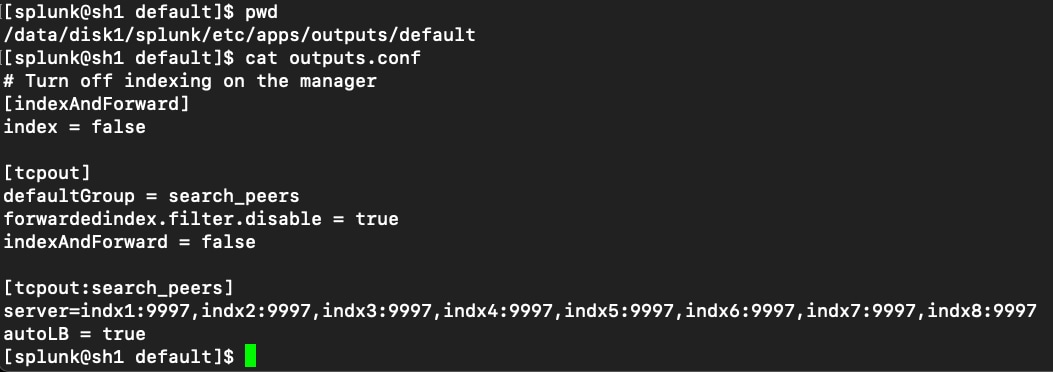
Configure Search Head Load Balancing
It is useful to utilize a load balancer to take advantage of the Search Head Cluster. Designate a common URL for use throughout the enterprise (for example, https://splunk.domain.com). The common URL should balance traffic between all four search heads and their respective ports, for example https://sh1:8000, https://sh2:8000, https://sh3:8000)
Verify Search Head Clustering as shown below:
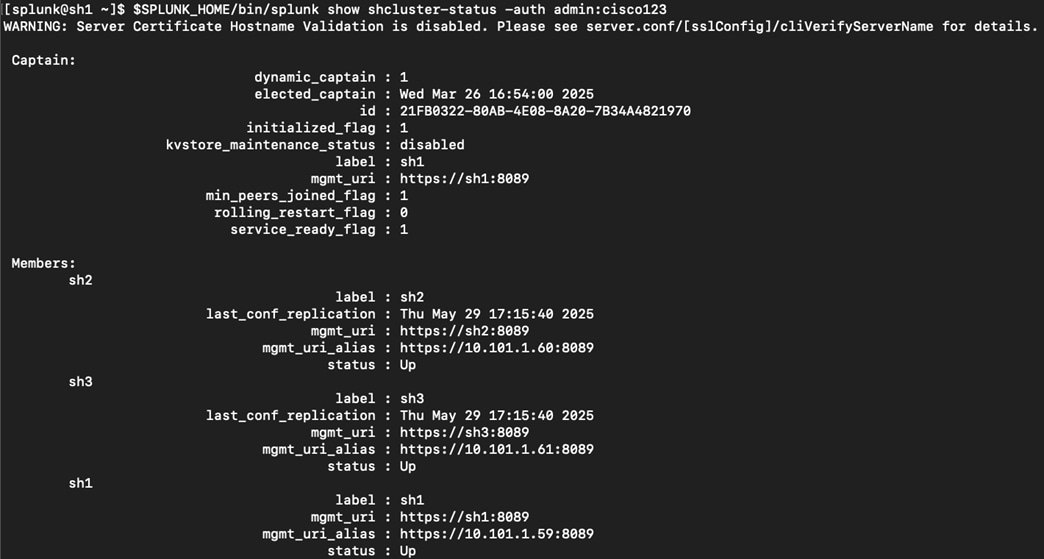
Note: The instructions to configure the designated load balancer will differ by vendor, but the functionality and load balancing direction is the same. No load balancer is used for this CVD.
Configure Deployment Server
Any Splunk instance can act as a Deployment Server that assists in maintaining and deploying apps. In particular, the Deployment Server acts as a central manager for Universal Forwarders deployed throughout the enterprise. Any configuration to be pushed to remote instances will be hosted under "$SPLUNK_HOME/etc/deployment-apps/."
Note: The Deployment Server is installed by default when Splunk Enterprise is deployed.
In this CVD, the server node "admin2" is configured as the designated Deployment Server.
Configure the Distributed Monitoring Console
This section contains the following procedure:
The Distributed Monitoring Console (DMC) is a special purpose pre-packaged app that comes with Splunk Enterprise providing detailed performance information about the Splunk Enterprise deployment. This section describes the procedure to configure the Distributed Monitoring Console for this deployment. In this solution DMC is installed on the server node "admin3".
Distributed Monitoring Console (DMC) is configured to manage all the indexers, search heads and the admin nodes.
Step 1. Navigate to the Splunk Web Interface on admin3 (such as https://admin3:8000/).
Step 2. Click Settings > Monitoring Console.
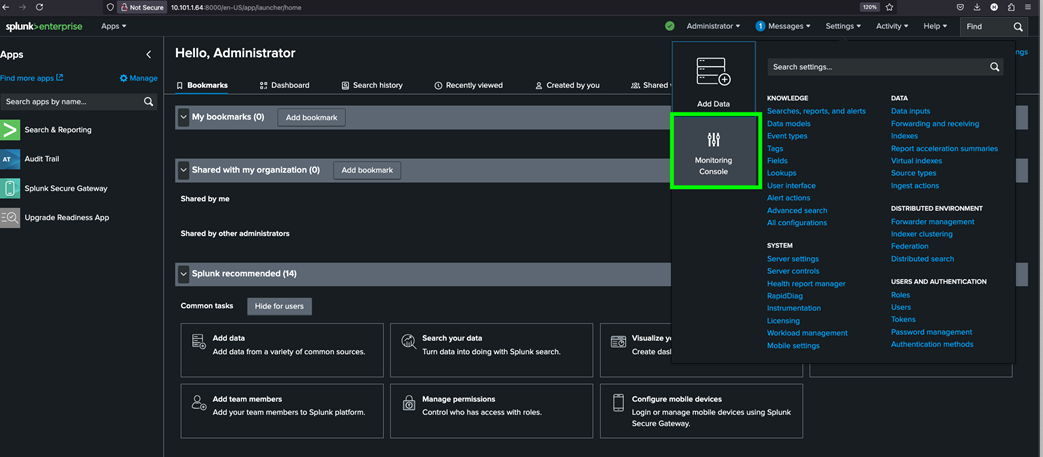
Step 3. In the Monitoring Console app, click Settings > General Setup.
Step 4. From the General Setup page, click Distributed to change the monitoring console on this server node from the Standalone mode to the Distribute mode.
Step 5. Click Continue to acknowledge the warning message.
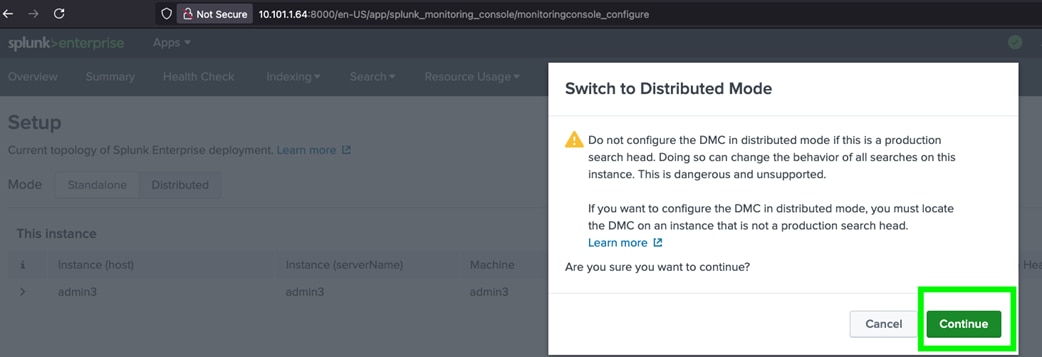
Step 6. Select Edit > Edit Server Role on the admin3 instance; the server must change roles to function properly.
Step 7. Select only “Cluster Manager: role for admin3 node. Click Save.
Step 8. Confirm that the changes have been saved successfully.
Step 9. Click Done to return to General Setup page. Click Apply Changes.
Step 10. Confirm that changes have been applied successfully.
Step 11. Click Refresh to return to the Setup page and verify that the role of admin3 has been changed.
Step 12. Ensure that the Manager Node (admin1 and admin3) does not have the role of “search head.”
Step 13. Add and configure DMC to monitor all the server nodes, go to Settings > Distributed Environment > Distributed search.
Step 14. Select Search Peers.
Step 15. Add a new peer with the following inputs:
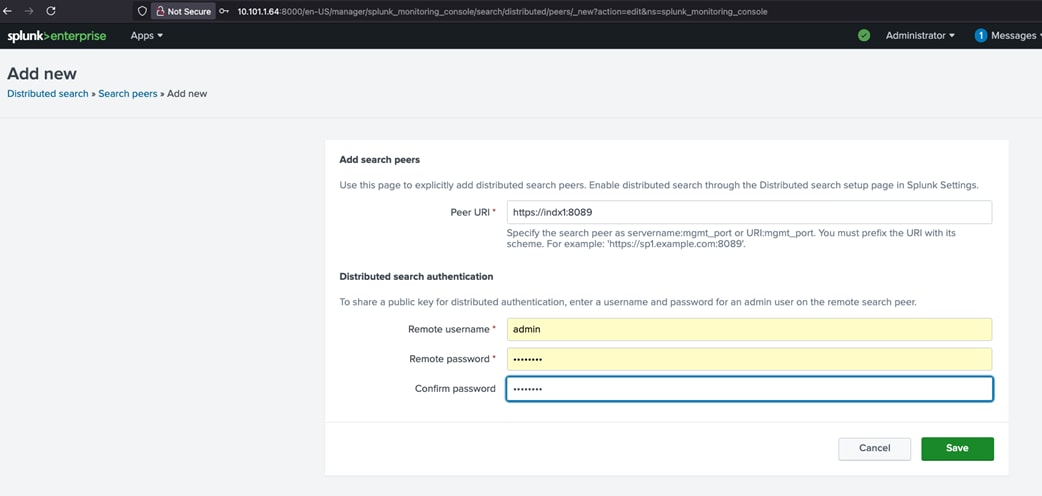
Step 16. Click Save to add the peer.
Step 17. Repeat this procedure and add all the indexer, search head and admin nodes as the distributed peers on this monitoring console node.
Step 18. Make sure to set up the appropriate server nodes and its role after adding all the peer nodes and confirm the cluster as shown below:
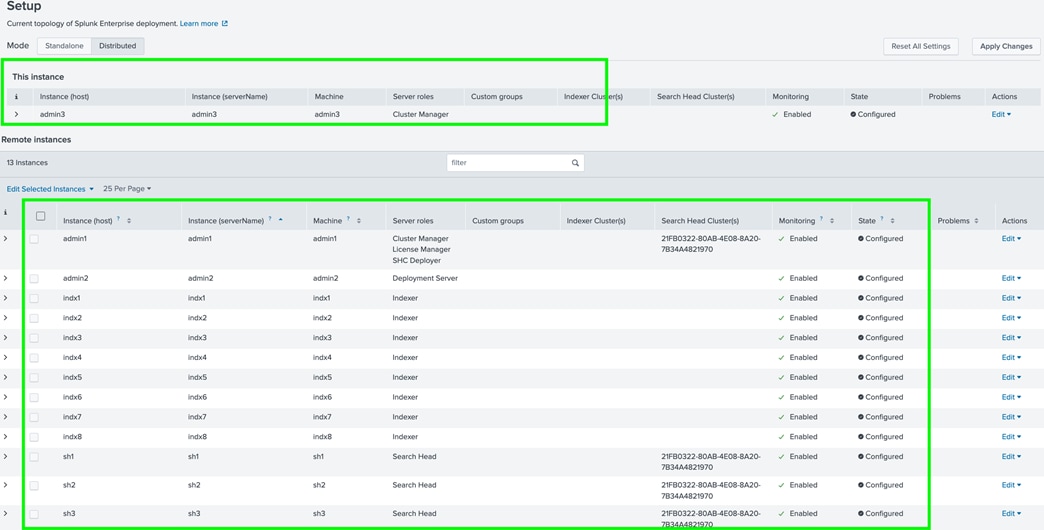
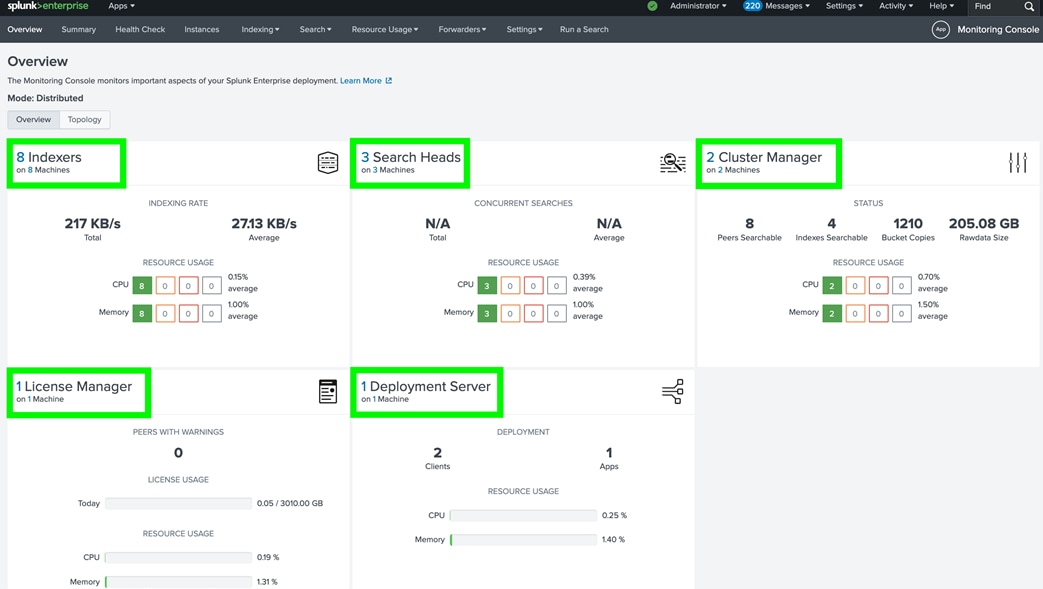
Conclusion
Cisco UCS provides a tightly integrated platform combining compute, storage, and networking, which is purpose-built to support high-performance, scalable workloads like Splunk. This integration ensures predictable performance and high availability for Splunk Enterprise deployments. Deploying Splunk Enterprise on Cisco UCS servers managed by Cisco Intersight offers a unified, high-performance, and scalable infrastructure for operational analytics. The key benefits are as follows:
● Simplified and Unified Management: Cisco Intersight provides a cloud-based, SaaS platform for managing Cisco UCS infrastructure, enabling centralized lifecycle management, configuration, and monitoring from anywhere via a browser. Automation of daily tasks and workflows reduces manual effort and operational complexity.
● Scalability and Performance: Cisco UCS, combined with Intersight, supports horizontal scaling to thousands of servers, making it ideal for growing Splunk deployments that require rapid data ingestion and real-time analytics. The architecture is designed for linear scaling to handle petabytes of data, ensuring consistent performance as your Splunk environment expands.
● Rapid, Consistent Deployment: Service profiles and automation features in UCS and Intersight enable fast, repeatable server provisioning and configuration, minimizing deployment errors and accelerating time to value. Firmware updates and system maintenance can be performed cluster wide as a single operation.
● Enhanced Visibility and Support: Intersight delivers global visibility into infrastructure health, status, and performance, with advanced monitoring, alerting, and integrated support capability. Integration with Splunk (via add-ons) allows for collection and analysis of UCS and Intersight operational data, improving troubleshooting and security monitoring.
● Flexibility and Security: Supports hybrid and multi-cloud environments, managing both on-premises and cloud-based infrastructure as a cohesive whole. Security features include audit logging, integration with SIEM platforms like Splunk, and robust access controls.
About the Author
Hardikkumar Vyas, Technical Marketing Engineer, Cisco Systems, Inc.
Hardikkumar Vyas is a Solution Architect at Cisco Systems with over 12 years of experience in architecting and implementing databases and other enterprise solutions on Cisco UCS Servers with enterprise storage platforms. He holds a master’s in electrical engineering and specializes in developing reference architectures, conducting performance benchmarks, and authoring technical documentation for mission-critical workloads.
Acknowledgements
For their support and contribution to the design, validation, and creation of this Cisco Validated Design, the authors would like to thank:
● Hardik Patel, Technical Marketing Leader, Cisco Systems, Inc.
● John George, Technical Marketing Leader, Cisco Systems, Inc.
● Tushar Patel, Distinguished Technical Marketing Engineer, Cisco Systems, Inc.
● Christopher Dudkiewicz, Engineering Product Manager, Cisco Systems, Inc.
● Troy Wollenslegel, Splunk Technology Consultant, Cisco Systems, Inc.
● Paul Davies, Splunk Apps/Sys Engineering Mgmt, Cisco Systems, Inc.
● Nisarg Shah, Splunk Product Management Engineer, Cisco Systems, Inc.
Appendix
This appendix contains the following:
● Appendix A: Bill of Materials
Appendix A: Bill of Materials
Table 10 lists the hardware used for this solution
| Line Number |
Part Name |
Part Description |
Quantity |
| 1.0 |
UCS-M8-MLB |
UCS M8 RACK MLB |
1 |
| 1.1 |
UCSC-C225-M8S |
UCS C225 M8 Rack w/oCPU, mem, drv, 1U wSFF HDD/SSD backplane |
3 |
| 1.1.1 |
UCS-CPU-A9224 |
AMD 9224 2.5GHz 200W 24C/64MB Cache DDR5 4800MT/s |
3 |
| 1.1.2 |
UCSC-M-V5D200GV2D |
Cisco VIC 15237 2x 40/100/200G mLOM C-Series w/Secure Boot |
3 |
| 1.1.3 |
UCS-M2-480G-D |
480GB M.2 SATA SSD |
6 |
| 1.1.4 |
UCS-M2-HWRAID-D |
Cisco Boot optimized M.2 Raid controller |
3 |
| 1.1.5 |
UCS-TPM2-002D-D |
TPM 2.0 FIPS 140-2 MSW2022 compliant AMD M8 servers |
3 |
| 1.1.6 |
UCSC-RAIL-D |
Ball Bearing Rail Kit for C220 & C240 M7 rack servers |
3 |
| 1.1.7 |
CIMC-LATEST-D |
IMC SW (Recommended) latest release for C-Series Servers. |
3 |
| 1.1.8 |
UCSC-HSLP-C225M8 |
UCS C225 M8 Heatsink |
3 |
| 1.1.9 |
UCSC-BBLKD-M8 |
UCS C-Series M6 & M8 SFF drive blanking panel |
24 |
| 1.1.10 |
UCSC-HPBKT-225M8 |
C225 M8 Tri-Mode 24G SAS RAID Controller Bracket |
3 |
| 1.1.11 |
CBL-FNVME-C225M8 |
C225M8 NVME Cable, Mainboard to backplane |
3 |
| 1.1.12 |
CBL-SAS-C225M8 |
C225M8 SAS Cable, Mainboard to RAID card |
3 |
| 1.1.13 |
CBL-SCAP-C220-D |
C220/C240M7 1U/2U Super Cap cable |
3 |
| 1.1.14 |
UCS-SCAP-D |
M7 / M8 SuperCap |
3 |
| 1.1.15 |
UCS-MRX32G1RE3 |
32GB DDR5-5600 RDIMM 1Rx4 (16Gb) |
36 |
| 1.1.16 |
UCSC-RIS1B-225M8 |
C225 M8 1U Riser 1B PCIe Gen5 x16 HH |
3 |
| 1.1.17 |
UCSC-RIS2B-225M8 |
C225 M8 1U Riser 2B PCIe Gen5 x16 HH |
3 |
| 1.1.18 |
UCSC-RIS3A-225M8 |
C225 M8 1U Riser 3A PCIe Gen4 x16 HH |
3 |
| 1.1.19 |
UCSC-RAID-HP |
Cisco Tri-Mode 24G SAS RAID Controller w/4GB Cache |
3 |
| 1.1.20 |
UCS-NVMEG4-M960-D |
960GB 2.5in U.3 15mm P7450 Hg Perf Med End NVMe |
6 |
| 1.1.21 |
UCSC-PSU1-2300W-D |
Cisco UCS 2300W AC Power Supply for Rack Servers Titanium |
6 |
| 1.1.22 |
CAB-C19-CBN |
Cabinet Jumper Power Cord, 250 VAC 16A, C20-C19 Connectors |
6 |
| 1.1.23 |
UCS-SID-INFR-BD-D |
Big Data and Analytics Platform (Hadoop/IoT/ITOA/AI/ML) |
3 |
| 1.1.24 |
UCS-SID-WKL-BD-D |
Big Data and Analytics (Hadoop/IoT/ITOA) |
3 |
| 1.2 |
UCSC-C225-M8S |
UCS C225 M8 Rack w/oCPU, mem, drv, 1U wSFF HDD/SSD backplane |
3 |
| 1.2.1 |
UCS-CPU-A9124 |
AMD 9124 3.0GHz 200W 16C/64MB Cache DDR5 4800MT/s |
3 |
| 1.2.2 |
UCSC-M-V5D200GV2D |
Cisco VIC 15237 2x 40/100/200G mLOM C-Series w/Secure Boot |
3 |
| 1.2.3 |
UCS-M2-480G-D |
480GB M.2 SATA SSD |
6 |
| 1.2.4 |
UCS-M2-HWRAID-D |
Cisco Boot optimized M.2 Raid controller |
3 |
| 1.2.5 |
UCS-TPM2-002D-D |
TPM 2.0 FIPS 140-2 MSW2022 compliant AMD M8 servers |
3 |
| 1.2.6 |
UCSC-RAIL-D |
Ball Bearing Rail Kit for C220 & C240 M7 rack servers |
3 |
| 1.2.7 |
CIMC-LATEST-D |
IMC SW (Recommended) latest release for C-Series Servers |
3 |
| 1.2.8 |
UCSC-HSLP-C225M8 |
UCS C225 M8 Heatsink |
3 |
| 1.2.9 |
UCSC-BBLKD-M8 |
UCS C-Series M6 & M8 SFF drive blanking panel |
24 |
| 1.2.10 |
UCSC-HPBKT-225M8 |
C225 M8 Tri-Mode 24G SAS RAID Controller Bracket |
3 |
| 1.2.11 |
CBL-FNVME-C225M8 |
C225M8 NVME Cable, Mainboard to backplane |
3 |
| 1.2.12 |
CBL-SAS-C225M8 |
C225M8 SAS Cable, Mainboard to RAID card |
3 |
| 1.2.13 |
CBL-SCAP-C220-D |
C220/C240M7 1U/2U Super Cap cable |
3 |
| 1.2.14 |
UCS-SCAP-D |
M7 / M8 SuperCap |
3 |
| 1.2.15 |
UCS-MRX16G1RE3 |
16GB DDR5-5600 RDIMM 1Rx8 (16Gb) |
36 |
| 1.2.16 |
UCSC-RIS1B-225M8 |
C225 M8 1U Riser 1B PCIe Gen5 x16 HH |
3 |
| 1.2.17 |
UCSC-RIS2B-225M8 |
C225 M8 1U Riser 2B PCIe Gen5 x16 HH |
3 |
| 1.2.18 |
UCSC-RIS3A-225M8 |
C225 M8 1U Riser 3A PCIe Gen4 x16 HH |
3 |
| 1.2.19 |
UCSC-RAID-HP |
Cisco Tri-Mode 24G SAS RAID Controller w/4GB Cache |
3 |
| 1.2.20 |
UCS-NVMEG4-M960-D |
960GB 2.5in U.3 15mm P7450 Hg Perf Med End NVMe |
6 |
| 1.2.21 |
UCSC-PSU1-2300W-D |
Cisco UCS 2300W AC Power Supply for Rack Servers Titanium |
6 |
| 1.2.22 |
CAB-C19-CBN |
Cabinet Jumper Power Cord, 250 VAC 16A, C20-C19 Connectors |
6 |
| 1.2.23 |
UCS-SID-INFR-BD-D |
Big Data and Analytics Platform (Hadoop/IoT/ITOA/AI/ML) |
3 |
| 1.2.24 |
UCS-SID-WKL-BD-D |
Big Data and Analytics (Hadoop/IoT/ITOA) |
3 |
| 1.3 |
UCSC-C245-M8SX |
UCS C245M8 Rack w/oCPU, mem, drv, 2Uw24SFF HDD/SSD backplane |
8 |
| 1.3.1 |
UCS-CPU-A9224 |
AMD 9224 2.5GHz 200W 24C/64MB Cache DDR5 4800MT/s |
16 |
| 1.3.2 |
UCSC-M-V5D200GV2D |
Cisco VIC 15237 2x 40/100/200G mLOM C-Series w/Secure Boot |
8 |
| 1.3.3 |
UCS-M2-480G-D |
480GB M.2 SATA SSD |
16 |
| 1.3.4 |
UCS-M2-HWRAID-D |
Cisco Boot optimized M.2 Raid controller |
8 |
| 1.3.5 |
UCS-TPM2-002D-D |
TPM 2.0 FIPS 140-2 MSW2022 compliant AMD M8 servers |
8 |
| 1.3.6 |
UCSC-RAIL-D |
Ball Bearing Rail Kit for C220 & C240 M7 rack servers |
8 |
| 1.3.7 |
CIMC-LATEST-D |
IMC SW (Recommended) latest release for C-Series Servers |
8 |
| 1.3.8 |
UCSC-HSHP-C245M8 |
UCS C245 M8 Heatsink |
16 |
| 1.3.9 |
UCSC-BBLKD-M8 |
UCS C-Series M6 & M8 SFF drive blanking panel |
64 |
| 1.3.10 |
UCS-DDR5-BLK |
UCS DDR5 DIMM Blanks |
96 |
| 1.3.11 |
UCSC-FBRS3-C240-D |
C240 M7/M8 2U Riser3 Filler Blank |
8 |
| 1.3.12 |
UCS-SCAP-D |
M7 / M8 SuperCap |
16 |
| 1.3.13 |
CBL-FNVME-C245M8 |
C245M8 NVME CBL MB CN NEAR RIS3-RAID/HBA SLT1 RDRVX2 FNVMEX4 |
8 |
| 1.3.14 |
CBL-NVME-C245M8 |
C245M8 CBL, ON MB CON NEAR RISR3 TO BKPLANE RDRV X2 FNVME X4 |
8 |
| 1.3.15 |
CBL-SASR1-C245M8 |
C245M8 2U SAS CBL, ON MB CON NEAR RISER 1 TO RAIDS/HBA SLT 2 |
8 |
| 1.3.16 |
UCSC-M2EXT-240-D |
C240M7 2U M.2 Extender board |
8 |
| 1.3.17 |
UCSC-HPBKT-245M8 |
UCS C-Series M8 2U HP RAID Controller Bracket |
16 |
| 1.3.18 |
CBL-SCAP-C240-D |
C240M7 2U Super Cap cable |
16 |
| 1.3.19 |
UCS-MRX32G1RE3 |
32GB DDR5-5600 RDIMM 1Rx4 (16Gb) |
96 |
| 1.3.20 |
UCSC-RIS1C-245M8 |
UCS C-Series M8 2U Riser 1C PCIe Gen5 (2x16) |
8 |
| 1.3.21 |
UCSC-RIS2C-245M8 |
UCS C-Series M8 2U Riser 2C PCIe Gen5 (2x16); (CPU2) |
8 |
| 1.3.22 |
UCSC-RAID-HP |
Cisco Tri-Mode 24G SAS RAID Controller w/4GB Cache |
16 |
| 1.3.23 |
UCS-NVMEG4-M1920D |
1.9TB 2.5in U.3 15mm P7450 Hg Perf Med End NVMe |
128 |
| 1.3.24 |
UCSC-PSU1-2300W-D |
Cisco UCS 2300W AC Power Supply for Rack Servers Titanium |
16 |
| 1.3.25 |
CAB-C19-CBN |
Cabinet Jumper Power Cord, 250 VAC 16A, C20-C19 Connectors |
16 |
| 1.3.26 |
UCS-SID-INFR-BD-D |
Big Data and Analytics Platform (Hadoop/IoT/ITOA/AI/ML) |
8 |
| 1.3.27 |
UCS-SID-WKL-BD-D |
Big Data and Analytics (Hadoop/IoT/ITOA) |
8 |
| 1.4 |
CNDL-DESELECT-D |
Conditional Deselect |
1 |
| 1.4.1 |
OPTOUT-EA-ONLY |
License not needed: Customer already owns Licenses in an EA |
1 |
| 2.0 |
UCSX-FI-6536-U |
Fabric Interconnect 6536 for IMM |
2.00 |
| 2.0.1 |
N10-MGT018 |
UCS Manager v4.2 and Intersight Managed Mode v4.2 |
2.00 |
| 2.0.2 |
UCS-FI-6500-SW |
Perpetual SW License for the 6500 series Fabric Interconnect |
2.00 |
| 2.0.3 |
UCS-PSU-6536-AC |
UCS 6536 Power Supply/AC 1100W PSU - Port Side Exhaust |
4.00 |
| 2.0.4 |
CAB-N5K6A-NA |
Power Cord, 200/240V 6A North America |
4.00 |
| 2.0.5 |
QSFP-100G-CU3M |
100GBASE-CR4 Passive Copper Cable, 3m |
48.00 |
| 2.0.6 |
UCS-ACC-6536 |
UCS 6536 Chassis Accessory Kit |
2.00 |
| 2.0.7 |
UCS-FAN-6536 |
UCS 6536 Fan Module |
12.00 |
Feedback
For comments and suggestions about this guide and related guides, join the discussion on Cisco Community here: https://cs.co/en-cvds.
CVD Program
"DESIGNS") IN THIS MANUAL ARE PRESENTED "AS IS," WITH ALL FAULTS. CISCO AND ITS SUPPLIERS DISCLAIM ALL WARRANTIES, INCLUDING, WITHOUT LIMITATION, THE WARRANTY OF MERCHANTABILITY, FITNESS FOR A PARTICULAR PURPOSE AND NONINFRINGEMENT OR ARISING FROM A COURSE OF DEALING, USAGE, OR TRADE PRACTICE. IN NO EVENT SHALL CISCO OR ITS SUPPLIERS BE LIABLE FOR ANY INDIRECT, SPECIAL, CONSEQUENTIAL, OR INCIDENTAL DAMAGES, INCLUDING, WITHOUT LIMITATION, LOST PROFITS OR LOSS OR DAMAGE TO DATA ARISING OUT OF THE USE OR INABILITY TO USE THE DESIGNS, EVEN IF CISCO OR ITS SUPPLIERS HAVE BEEN ADVISED OF THE POSSIBILITY OF SUCH DAMAGES.
THE DESIGNS ARE SUBJECT TO CHANGE WITHOUT NOTICE. USERS ARE SOLELY RESPONSIBLE FOR THEIR APPLICATION OF THE DESIGNS. THE DESIGNS DO NOT CONSTITUTE THE TECHNICAL OR OTHER PROFESSIONAL ADVICE OF CISCO, ITS SUPPLIERS OR PARTNERS. USERS SHOULD CONSULT THEIR OWN TECHNICAL ADVISORS BEFORE IMPLEMENTING THE DESIGNS. RESULTS MAY VARY DEPENDING ON FACTORS NOT TESTED BY CISCO.
CCDE, CCENT, Cisco Eos, Cisco Lumin, Cisco Nexus, Cisco StadiumVision, Cisco TelePresence, Cisco WebEx, the Cisco logo, DCE, and Welcome to the Human Network are trademarks; Changing the Way We Work, Live, Play, and Learn and Cisco Store are service marks; and Access Registrar, Aironet, AsyncOS, Bringing the Meeting To You, Catalyst, CCDA, CCDP, CCIE, CCIP, CCNA, CCNP, CCSP, CCVP, Cisco, the Cisco Certified Internetwork Expert logo, Cisco IOS, Cisco Press, Cisco Systems, Cisco Systems Capital, the Cisco Systems logo, Cisco Unified Computing System (Cisco UCS), Cisco UCS B-Series Blade Servers, Cisco UCS C-Series Rack Servers, Cisco UCS S-Series Storage Servers, Cisco UCS X-Series, Cisco UCS Manager, Cisco UCS Management Software, Cisco Unified Fabric, Cisco Application Centric Infrastructure, Cisco Nexus 9000 Series, Cisco Nexus 7000 Series. Cisco Prime Data Center Network Manager, Cisco NX-OS Software, Cisco MDS Series, Cisco Unity, Collaboration Without Limitation, EtherFast, EtherSwitch, Event Center, Fast Step, Follow Me Browsing, FormShare, GigaDrive, HomeLink, Internet Quotient, IOS, iPhone, iQuick Study, LightStream, Linksys, MediaTone, MeetingPlace, MeetingPlace Chime Sound, MGX, Networkers, Networking Academy, Network Registrar, PCNow, PIX, PowerPanels, ProConnect, ScriptShare, SenderBase, SMARTnet, Spectrum Expert, StackWise, The Fastest Way to Increase Your Internet Quotient, TransPath, WebEx, and the WebEx logo are registered trade-marks of Cisco Systems, Inc. and/or its affiliates in the United States and certain other countries. (LDW_P4)
All other trademarks mentioned in this document or website are the property of their respective owners. The use of the word partner does not imply a partnership relationship between Cisco and any other company. (0809R)