Configuring RMON

Finding Feature Information

Your software release may not support all the features documented in this module. For the latest caveats and feature information, see Bug Search Tool and the release notes for your platform and software release. To find information about the features documented in this module, and to see a list of the releases in which each feature is supported, see the feature information table at the end of this module.

Use Cisco Feature Navigator to find information about platform support and Cisco software image support. To access Cisco Feature Navigator, go to http://www.cisco.com/go/cfn. An account on Cisco.com is not required.
Information About RMON

Understanding RMON

RMON is an Internet Engineering Task Force (IETF) standard monitoring specification that defines a set of statistics and functions that can be exchanged between RMON-compliant console systems and network probes. RMON provides comprehensive network-fault diagnosis, planning, and performance-tuning information.

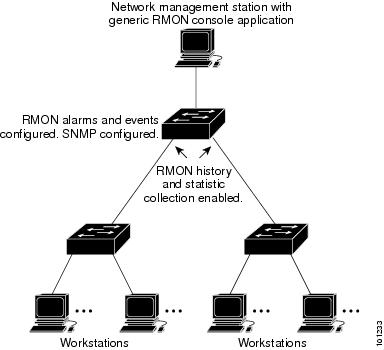
The following figure shows a sample configuration of the RMON feature with the Simple Network Management Protocol (SNMP) agent in the device. This monitors all the traffic flowing among all the devices on all connected LAN segments.
Figure 1. Remote Monitoring Sample

The device supports these RMON groups (defined in RFC 1757):

  • Statistics (RMON group 1)—Collects Ethernet statistics (including Fast Ethernet and Gigabit Ethernet statistics, depending on the device type and supported interfaces) on an interface.
  • History (RMON group 2)—Collects a history group of statistics on Ethernet ports (including Fast Ethernet and Gigabit Ethernet statistics, depending on the device type and supported interfaces) for a specified polling interval.
  • Alarm (RMON group 3)—Monitors a specific management information base (MIB) object for a specified interval, triggers an alarm at a specified value (rising threshold), and resets the alarm at another value (falling threshold). Alarms can be used with events; the alarm triggers an event, which can generate a log entry or an SNMP trap.
  • Event (RMON group 9)—Specifies the action to take when an event is triggered by an alarm. The action can be to generate a log entry or an SNMP trap.

Because devices supported by this software release use hardware counters for RMON data processing, the monitoring is more efficient, and little processing power is required.


Note

64-bit counters are not supported for RMON alarms.


How to Configure RMON

Default RMON Configuration

RMON is disabled by default. No alarms or events are configured.

Configuring RMON Alarms and Events

Before you begin

You can configure your switch for RMON by using the command-line interface (CLI) or an SNMP-compatible network management station.


Note

64-bit counters are not supported for RMON alarms.

Follow these steps to enable RMON alarms and events.

  • It is recommended to use a generic RMON console application on the network management station (NMS) to take advantage of the RMON network management capabilities.
  • You must also configure SNMP on the switch to access RMON MIB objects.

Procedure

  Command or Action Purpose
Step 1

enable

Example:


Switch> enable

Enables privileged EXEC mode.

  • Enter your password if prompted.

Step 2

configure terminal

Example:

Switchconfigure terminal

Enters global configuration mode.

Step 3

rmon alarm {number variable interval absolute | delta } rising-thresholdvalue [event-number] falling-threshold value [event-number] [ownerstring ]

Example:

Switch(config)# rmon alarm 10 ifEntry.20.1 20 delta rising-threshold 15 1 falling-threshold 0 owner jjohnson

Sets an alarm on a MIB object.

For number , specify the alarm number. The range is 1 to 65535.

For variable , specify the MIB object to monitor

For interval , specify the time in seconds the alarm monitors the MIB variable. The range is 1 to 4294967295 seconds.

Specify the absolute keyword to test each MIB variable directly. Specify the delta keyword to test the change between samples of a MIB variable.

For value , specify a number at which the alarm is triggered and one for when the alarm is reset. The range for the rising threshold and falling threshold values is -2147483648 to 2147483647.

(Optional) For event-number , specify the event number to trigger when the rising or falling threshold exceeds its limit.

(Optional) For owner string , specify the owner of the alarm.

Step 4

rmon event number [description string ] [log ] [owner string ] [trap community ]

Example:

Switch(config)# rmon event 1 log trap eventtrap description "High ifOutErrors" owner jjones

Adds an event in the RMON event table that is associated with an RMON event number.

For number , assign an event number. The range is 1 to 65535.

(Optional) For description string , specify a description of the event.

(Optional) Use the log keyword to generate an RMON log entry when the event is triggered.

(Optional) For owner string , specify the owner of this event.

(Optional) For trap community , enter the SNMP community string used for this trap.

Step 5

end

Example:


Switch(config)# end

Returns to privileged EXEC mode.

Step 6

show running-config

Example:


Switch# show running-config 

Verifies your entries.

Step 7

copy running-config startup-config

Example:


Switch# copy running-config startup-config 

(Optional) Saves your entries in the configuration file.

What to do next

To disable an alarm, use the no rmon alarm number global configuration command on each alarm you configured. You cannot disable at once all the alarms that you configured. To disable an event, use the no rmon event number global configuration command.

Collecting Group History Statistics on an Interface

Follow these steps to collect group history statistics on an interface. This procedure is optional.

Before you begin

You must first configure RMON alarms and events to display collection information.

Procedure

  Command or Action Purpose
Step 1

enable

Example:


Switch> enable

Enables privileged EXEC mode.

  • Enter your password if prompted.

Step 2

configure terminal

Example:

Switch# configure terminal
Enters the global configuration mode.
Step 3

interface interface-id

Example:

Switch(config)# interface gigabitethernet2/0/1
Specifies the interface on which to collect history, and enter interface configuration mode.
Step 4

rmon collection history index [buckets bucket-number ] [interval seconds ] [owner ownername ]

Example:

Enables history collection for the specified number of buckets and time period.

For index , identify the RMON group of statistics The range is 1 to 65535.

(Optional) For buckets bucket-number , specify the maximum number of buckets desired for the RMON collection history group of statistics. The range is 1 to 65535. The default is 50 buckets.

(Optional) For interval seconds , specify the number of seconds in each polling cycle. The range is 1 to 3600. The default is 1800 seconds.

(Optional) For owner ownername , enter the name of the owner of the RMON group of statistics.

Step 5

end

Example:


Switch(config)# end

Returns to privileged EXEC mode.

Step 6

show running-config

Example:


Switch# show running-config 

Verifies your entries.

Step 7

copy running-config startup-config

Example:


Switch# copy running-config startup-config 

(Optional) Saves your entries in the configuration file.

What to do next

To disable history collection, use the no rmon collection history index interface configuration command.

Collecting Group Ethernet Statistics on an Interface

Follow these steps to collect group Ethernet statistics on an interface. This procedure is optional.

Procedure

  Command or Action Purpose
Step 1

enable

Example:


Switch> enable

Enables privileged EXEC mode.

  • Enter your password if prompted.

Step 2

configure terminal

Example:

Switch# configure terminal
Enters the global configuration mode.
Step 3

interface interface-id

Example:

Switch(config)# interface gigabitethernet2/0/1
Specifies the interface on which to collect statistics, and enter interface configuration mode.
Step 4

rmon collection stats index [owner ownername ]

Example:

Switch(config-if)# rmon collection stats 2 owner root

Enables RMON statistic collection on the interface.

For index , specify the RMON group of statistics. The range is from 1 to 65535.

(Optional) For owner ownername , enter the name of the owner of the RMON group of statistics.

Step 5

end

Example:


Switch(config)# end

Returns to privileged EXEC mode.

Step 6

show running-config

Example:


Switch# show running-config 

Verifies your entries.

Step 7

copy running-config startup-config

Example:


Switch# copy running-config startup-config 

(Optional) Saves your entries in the configuration file.

What to do next

To disable the collection of group Ethernet statistics, use the no rmon collection stats index interface configuration command.

Monitoring RMON Status

Table 1. Commands for Displaying RMON Status
Command Purpose
show rmon Displays general RMON statistics.
show rmon alarms Displays the RMON alarm table.
show rmon events Displays the RMON event table.
show rmon history Displays the RMON history table.
show rmon statistics Displays the RMON statistics table.