Traffic Analytics
Traffic Analytics is a feature that
-
provides the ability to identify services offered by servers behind a switch, aggregates analytics data, and exports summarized flow records for analysis
-
distinguishes between servers and clients using TCP flags (SYN and SYN ACK) in a three-way handshake
-
collapses multiple TCP session data traffic into a single record in the show flow cache database and exports it to the collector; during aggregation, the source port of TCP is set to 0
-
supports faster export cadence for troubleshoot flows, and
-
supports traffic analytics interface filter and VRF filter.
A flow is defined by the source interface, protocol, source IP address, source port, destination IP address, and destination port values. If traffic analytics is enabled, the flows of TCP sessions are aggregated based on source IP address (SIP), destination IP address (DIP), source port (SP) for server to client traffic and SIP, DIP, destination port (DP) for client to server traffic.
Aging of traffic database entries
The traffic database entries will be monitored every 24 hours using a timer. If there is no traffic hitting a database entry, then within 24 to 48 hours that traffic database entry will be deleted. By default the size of the database is 5000.
Troubleshooting rules
The troubleshooting rules are used to debug a flow by programming an analytics ACL filter. These rules take precedence over the traffic analytics rules and can be used for capturing specific flow. Troubleshooting rules might result in two entries in the flow cache.
Troubleshooting rules should be used only for specific flows preferably host for short duration only.
Faster export cadence for troubleshoot flow records
Currently, the flow records and troubleshoot records are exported at a fixed interval of one minute. A new filter export-interval command is introduced. This command facilitates the export of troubleshoot records at a faster interval by utilizing a dedicated hash database.
This configuration can be applied only if traffic analytics is enabled, and a filter is set up within the flow system settings. For more information on filter export-interval command, see Example for Traffic Analytics.
UDP port support and configuration
UDP port support in Traffic Analytics allows masking of exported flows based on configured UDP ports, starting from Cisco NX-OS Release 10.5(2)F.
-
When UDP ports are configured, flows are masked in the TA DB and NFM flow cache.
-
If the destination port matches, the source port is masked, and if the source port matches, the destination port is masked.
-
If UDP port is not configured, the current functionality is not impacted.
 Note |
First enter the NetFlow entry, and then make the TA entries. |
UDP port configuration
Configure UDP port(s) for masking exported flows, use the [no] udp-port port-range command under the flow traffic-analytics submode (under analytics).
-
The UDP port must be in the range of 1 to 65565.
-
Ports can be entered in a comma-separated and/or range-based format (for example:
2000-3000, 400, 500).
When the number of ports in the input exceeds the maximum number of ports that can be displayed in a single line command, they are spilled over to a new configuration line as shown in this example.
analytics
  flow traffic-analytics
    udp-port 53,400,500,1002,1004,1006,1008,1010,1012,1014,1016,1018,1020,1022,1024,1026,1028,1030,1032,1034,1036,1038,1040,1042,1044,1046,1048,1050,1052,1054,1056,1058,1060,1062,1064,1066,1068,1070,1072,1074,1076,1078,1080,1082,1084,1086,1088,1090,1092,1094,1096,1098,1100,1102,1104,1106,1108,1110,1112,1114,1116,1118,1120,1122
    udp-port 1124,1126,1128,1130,1132,1134,1136,1138,1140,1142,1144,1146,1148,1150,1152,1154,1156,1158,1160,1162,1164,1166,1168,1170,1172,1174,1176,1178,1180,1182,1184,1186,1188,1190,1192,1194,1196,1198,1200,2000-3000,3002,3004,3006
Traffic Analytics interface filter and VRF filter
The Traffic Analytics (TA) feature is enhanced to offer more granular support to capture TCP flows using filter configuration at both the interface and VRF levels, similar to the existing FT interface configuration.
Under this TA filter configuration, you can achieve the following:
-
Configure an IP address that is required for monitoring and use keywords such as
-
permit for IP address that requires monitoring,
-
deny to avoid the flow being collected, and
-
ft-collapse to integrate flows into a single service.
Note
The ft-collapse keyword is not used for troubleshoot filters .
-
-
Configure the VRF filter across all interfaces in a given VRF.
-
Provide permit subnet rules for TCP packets (TCP SYN, SYN ACK, and without any TCP flag).
-
For general TCP packets (without SYN or SYN ACK) which are considered for profile 31, the TCS flows forwarded to the collector can be stopped using the show flow cache command.
-
The output option is introduced for flow filter to be applied in the egress direction only.
-
Both IPv4 and IPv6 access-list are supported under the filter.
For more information on TA interface filter and VRF filter, see Example for Traffic Analytics interface filter and VRF filter.
Interface Traffic Analytics
Interface Traffic Analytics is a network analytics feature that provides
-
granular flow control for ingress and egress interfaces, enabling specific actions on traffic that comes in and goes out of interfaces
-
filters can be applied at both the interface and VRF level, similar to FT interface configuration, and
-
removal of Traffic Analytics is not allowed if it is enabled at the interface level.
Granular flow control for Traffic Analytics is provided for
-
ingress interface and
-
egress interface.
This feature provides an ability to take specific action on traffic that comes in and goes out of interfaces.
Note |
Removal of TA is not allowed if it is enabled at interface level. |
Granular control for TA feature is provided on ingress and egress interfaces by allowing filters at interface and VRF level, like FT interface configuration.
The table displays the interfaces that are supported on ingress and egress interfaces through releases.
|
Interface |
Ingress Support |
Egress Support |
|---|---|---|
|
SVI interface |
From Release 10.5(2)F |
From Release 10.5(3)F |
|
sub interface |
From Release 10.5(3)F |
From Release 10.5(3)F |
|
port-channel interface |
From Release 10.5(2)F |
From Release 10.5(3)F |
|
VRF interface |
From Release 10.5(2)F |
From Release 10.5(3)F |
|
VNI interface |
From Release 10.5(3)F |
From Release 10.5(3)F |
VNI interface
Flow filters can be applied under Layer 3 VNI interfaces in a VXLAN fabric like any other interface filters. The flow filters are supported in both ingress and egress directions. The filters can be either IPv4 or IPv6 filters.
The limitations for TA on VNI interface include:
-
Bridged traffic or Layer 2 forwarded traffic cannot be filtered using flow filters applied under L3VNI interface in BGW of a VXLAN fabric.
-
A deny flow filter in one direction blocks the traffic in the opposite direction too as VNI interfaces are not direction aware in BGWs of a VXLAN fabric.
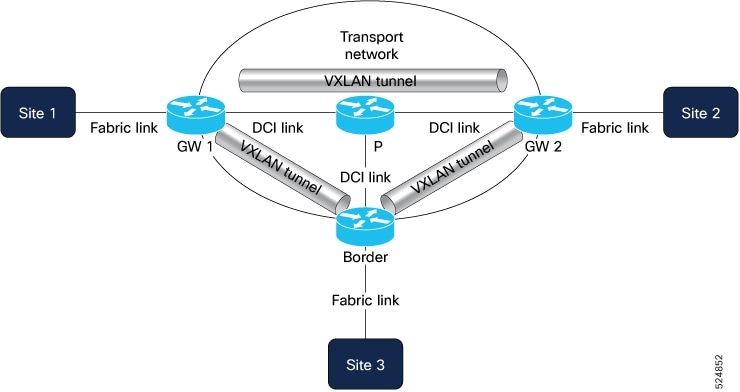
The image depicts what happens during Traffic Analytics in the VNI interface in ingress and egress directions.
-
Ingress - All traffic coming from DCI link gets decapsulated using VTEP and goes through the VNI interface where policy is applied. It is then forwarded to either fabric or host interface.
-
Egress – All traffic coming from either fabric or host interface goes through VNI interface where policy is applied and gets encapsulated using VTEP. It is then forwarded to the DCI link.
Example configuration for VNI interface.
vrf context TENANT-VRF
vni 70000 l3

interface nve1
  member vni 70000 associate-vrf


interface vni70000
  flow filter v4_vni_filter_input
  flow filter v4_vni_filter_output output
ECN detection for Traffic Analytics
Explicit Congestion Notification (ECN) is a mechanism that provides
-
Enhanced network management—Accurate detection of ECN bits provides administrators with the necessary information to effectively manage congestion, such as rerouting traffic or adjusting bandwidth.
-
Optimized quality of service—By focusing on CE notifications, this feature helps keep real-time applications running smoothly, allowing for proactive management of congestion.
-
Better troubleshooting—Monitoring ECN bits provides detailed insights into the network's health, aiding in quick fixes and long-term planning.
Explicit Congestion Notification (ECN) helps network devices signal congestion without losing packets. It focuses on the CE (Congestion Experienced) notification, which indicates that a packet has encountered congestion on its path. The enhancement in Traffic Analytics allows the system to find and report ECN bits in the IP header. This feature is designed for use with switches managed by Network Insights, where records are exported to Network Insights Resources (NIR) for consumption and further analysis.
This feature is crucial for closely monitoring and managing congestion across network traffic. It is particularly beneficial for real-time applications, such as VoIP calls and video streaming, where maintaining consistent quality is vital. By focusing on CE notifications and leveraging Network Insights Resources (NIR), network managers gain insights into congestion patterns, helping maintain performance stability in environments sensitive to delays.
How ECN Detection Works
These stages describe how the Traffic Analytics system detects and reports ECN bits in IP traffic:
-
The Traffic Analytics system continuously monitors IP traffic.
-
For each packet, the system examines the IP header to detect ECN bits, specifically looking for the CE (Congestion Experienced) notification.
-
When ECN bits are detected, the system records this information, identifying instances of congestion.
-
The collected data is used to generate reports or alerts for network administrators, highlighting congestion areas, and is further analyzed using NIR.
This process ensures that network administrators receive timely and accurate information about congestion in IP traffic, enabling effective management and optimization of network performance.
Disable global Traffic Analytics
Procedure
|
Configure mode interface under flow traffic-analytics to disable global Traffic Analytics. Example:Use the no form of the mode interface command to disable the interface mode. |
 Feedback